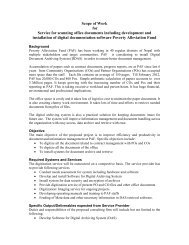
Fiscal year 2010/11 - Poverty Alleviation Fund, Nepal
Fiscal year 2010/11 - Poverty Alleviation Fund, Nepal
Fiscal year 2010/11 - Poverty Alleviation Fund, Nepal

Create successful ePaper yourself
Turn your PDF publications into a flip-book with our unique Google optimized e-Paper software.
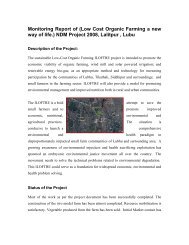
Table 2: CO registration, CO Agreement and Sub-project Agreement<br />
FY <strong>2010</strong>/<strong>11</strong><br />
Cumulative<br />
Categories<br />
No. of Regd. COs<br />
Agreement<br />
No. of Regd. COs<br />
Agreement<br />
No. of COs No. Of Agreement No. of COs No. Of Agreement<br />
Mountain 6<strong>11</strong> 519 590 2,007 1,862 2,100<br />
Hills 1367 1,149 1,309 9,653 8,818 10,198<br />
Terai 1,066 1,144 1,229 5,773 5,698 5,888<br />
Innovative Districts 26 20 20 465 441 492<br />
Grand total 3,070 2,832 3,148 17,898 16,819 18,678<br />
In the case of income generation, the most demanded activities from the community are related to agriculture, livestock, cottage industries, trade and<br />
skill based services. Similarly, infrastructure sub-projects are related to micro-irrigation, link road, culvert/bridge, ropeway, electricity/micro-hydro,<br />
water mill, water supply, sanitation, school and health post building, among others.<br />
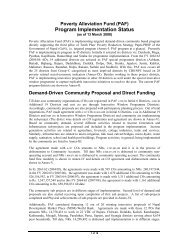
Table 3: PAF investment to the Community Sub -projects<br />
Categories<br />
FY <strong>2010</strong>/<strong>11</strong>(Million Rs.)<br />
Cumulative (Million Rs.)<br />
IG Infra Total IG Infra Total<br />
Mountain 191.812 59.104 250.916 919.531 189.628 1,109.159<br />
Hills 451.545 194.918 646.462 3,640.130 1,350.903 4,997.322<br />
Terai 614.779 90.399 705.177 2,535.484 341.379 2,871.525<br />
Innovative Districts 6.023 0 6.023 153.826 51.475 205.302<br />
Grand total 1,264.157 344.421 1,608.578 7,248.973 1,933.386 9,183.310<br />
Till the end of previous FY 2009/10, agreements were made with 13,987 COs amounting to Rs. 7,574m while during the reporting <strong>year</strong> alone additional<br />
2,832 COs signed agreement amounting to 1,608m. Therefore in cumulative terms, agreements were made with 16,819 COs amounting Rs. 9,183m<br />
till the end of reporting <strong>year</strong> i.e. FY <strong>2010</strong>/<strong>11</strong>. Details are illustrated in Annex 2, Annex 3, Annex 4 and Annex 5. PAF coverage in Terai border VDCs and<br />
Karnali region is given in Annex 6 and Annex 7.<br />
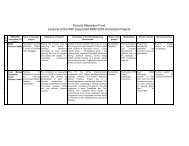
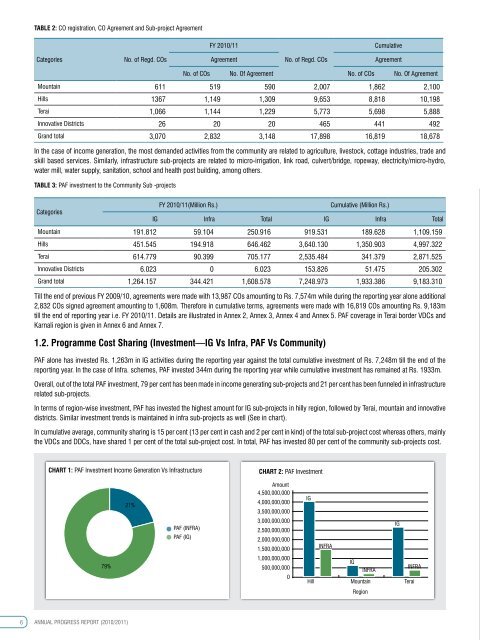
1.2. Programme Cost Sharing (Investment—IG Vs Infra, PAF Vs Community)<br />
PAF alone has invested Rs. 1,263m in IG activities during the reporting <strong>year</strong> against the total cumulative investment of Rs. 7,248m till the end of the<br />
reporting <strong>year</strong>. In the case of Infra. schemes, PAF invested 344m during the reporting <strong>year</strong> while cumulative investment has remained at Rs. 1933m.<br />
Overall, out of the total PAF investment, 79 per cent has been made in income generating sub-projects and 21 per cent has been funneled in infrastructure<br />
related sub-projects.<br />
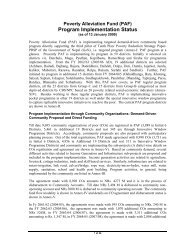
In terms of region-wise investment, PAF has invested the highest amount for IG sub-projects in hilly region, followed by Terai, mountain and innovative<br />
districts. Similar investment trends is maintained in infra sub-projects as well (See in chart).<br />
In cumulative average, community sharing is 15 per cent (13 per cent in cash and 2 per cent in kind) of the total sub-project cost whereas others, mainly<br />
the VDCs and DDCs, have shared 1 per cent of the total sub-project cost. In total, PAF has invested 80 per cent of the community sub-projects cost.<br />
chart 1: PAF Investment Income Generation Vs Infrastructure<br />
chart 2: PAF Investment<br />
Amount<br />
21%<br />
4,500,000,000<br />
4,000,000,000<br />
3,500,000,000<br />
IG<br />
PAF (INFRA)<br />
PAF (IG)<br />
3,000,000,000<br />
2,500,000,000<br />
2,000,000,000<br />
1,500,000,000<br />
INFRA<br />
IG<br />
79%<br />
1,000,000,000<br />
500,000,000<br />
0<br />
IG<br />
INFRA<br />
INFRA<br />
Hill Mountain Terai<br />
Region<br />
6 ANNUAL PROGRESS REPORT (<strong>2010</strong>/20<strong>11</strong>)