Fiscal year 2010/11 - Poverty Alleviation Fund, Nepal
Fiscal year 2010/11 - Poverty Alleviation Fund, Nepal
Fiscal year 2010/11 - Poverty Alleviation Fund, Nepal

You also want an ePaper? Increase the reach of your titles
YUMPU automatically turns print PDFs into web optimized ePapers that Google loves.
Annex 21<br />
Summary Results of Follow-on Impact Survey <strong>2010</strong><br />
(Done by TU and the World Bank)<br />
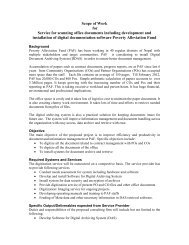
1. PAF’s monitoring data is developed on 5 different databases<br />
which support the process of working with partner and community<br />
organizations and monitoring the sub-project activities (figure 1). These<br />
databases provide a rich source of information on PAF activities and<br />
have been increasingly analyzed to improve planning and address<br />
weaknesses in the project implementation process and to identify areas<br />
of strength that can be scaled up.<br />
2. In addition to the MIS, an independent impact evaluation has also been<br />
integrated into the design of the program. The IE has been a long-term<br />
partnership between the PAF Secretariat, Tribhuvan University (TU) (that<br />
carried out the surveys) and the WB task team (that provided Technical<br />
Assistance- TA during the design phase and carried out the analysis).<br />
Data for the PAF Impact Evaluation (IE) come from two rounds of surveys<br />
Partner<br />
Organization<br />
Selection<br />
Partner<br />
Organization<br />
Selection<br />
of 3,000 households from 200 villages. The baseline was carried out in<br />
late 2007 and the follow-up of the same households in early <strong>2010</strong>. The<br />
survey questionnaire is adapted from the <strong>Nepal</strong> Living Standards Survey<br />
(NLSS) and includes detailed information on consumption and income,<br />
socio-economic and demographic issues, including education, health<br />
and nutrition, housing conditions and physical assets, migration and<br />
remittances, employment, social environment, community relationship,<br />
voice and participation. For comparability with the national household<br />
survey based welfare measures, PAF survey includes a very similar<br />
consumption module and follows the same consumption aggregation<br />
method. The IE analysis uses panel households (2774 out of 3,000),<br />
half of which are PAF beneficiaries (treatment) the rest non-beneficiaries<br />
(control) households. Outcome indicators on PAF beneficiary households<br />
and carefully matched non-beneficiary households are compared for the<br />
periods before and after the initiation of the PAF program. This method<br />
is known as difference-in-difference combined with propensity score<br />
matching.<br />
Consumption Effects<br />
Community<br />
organization<br />
selection and<br />
registration<br />
Community<br />
organizations<br />
database-Beneficiary<br />
Assessment<br />
Community:<br />
Selection<br />
priority<br />
activites<br />
Community<br />
Agreements<br />
database<br />
Subproject<br />
Projects<br />
database<br />
Community:<br />
Implementation<br />
of activites<br />
Revolving<br />
<strong>Fund</strong><br />
database<br />
3. The estimated net program impact on per capita consumption (in<br />
real terms adjusted for price inflation) growth is 13% for PAF Income<br />
Generating (IG) participant households, 28% for PAF money recipient<br />
households and 49% for those beneficiaries who have received the<br />
money for at least six months. It is not a surprise that these impact<br />
estimates are larger for money recipients but it is interesting to note<br />
that this effect remains strong for those who have had the funds for<br />
some time and have invested them in IGAs. The magnitudes of these<br />
estimates are impressive across all three categories of treatments both<br />
in terms of per cent change and absolute change. For example, money<br />
recipients for more than 6 months recorded on net a 49 per cent growth<br />
and Rupees 6,900 (approximately US$100) absolute change in real per<br />
capita consumption in just over two <strong>year</strong>s of time. These results are all<br />
statistically significant and robust across different matching algorithms.<br />
The higher levels of welfare impact over time may suggest that IGA<br />
revenue is contributing to the welfare of these households, a result that<br />
would be desirable from a policy and sustainability point of view.<br />
4. The net impact in the growth in per capita consumption is even higher<br />
for Dalit and Janajatis, implying the program’s ability to distribute growth<br />
towards targeted groups. The net effect for money recipients among this<br />
caste/ethnic group was an increase in real per capita consumption of 34<br />
per cent, compared to 28 per cent for the overall sample of the same<br />
treatment category.<br />
Food Security Effects<br />
5. Chronic food insecurity is a particularly important concern in <strong>Nepal</strong><br />
and substantial amount is spent per <strong>year</strong> on public works programmes<br />
aimed at alleviating hardship for food insecure households. Sustained<br />
food price inflation remains a concern and an estimated 3.7 million<br />
people are currently food insecure. The impact of high prices and food<br />
insecurity is most severe on economically, geographically and socially<br />
marginalized communities. Since <strong>Nepal</strong>‟s poorest households spend<br />
more than 75% of their income on food, high prices will continue to<br />
affect poverty alleviation efforts. The analysis estimates that the net<br />
PAF impact on incidence of food insecurity (as defined as self-reported<br />
food sufficiency for six months or less) is 10 per centage points decline<br />
when the treatment group is PAF money recipients, and 14 per centage<br />
points decrease among money recipients at least 6 months prior to<br />
second-round survey. These effects are stronger for Dalit and Janajati<br />
households. However, there is no impact for PAF IG households (the<br />
base treatment category), possibly implying that the self-reported food<br />
sufficiency indicator (measure of perceived change in household’s ability<br />
to increase their food consumption) is not affected by PAF participation<br />
alone when the household is yet to receive funds and start an IG activity.<br />
Once again, these results are quite robust across different matching<br />
alternatives.<br />
School Enrolment Effects<br />
6. Due to PAF, school enrolment rate among 6-15 <strong>year</strong> old children<br />
increased by a net 7 per centage points for PAF IG households, by a<br />
net 9 per centage points for PAF money recipient households , and a<br />
net 12 per centage points for PAF money recipients for more than six<br />
months. These are all notable and statistically significant impacts. While<br />
child education is not a direct outcome associated with PAF intervention,<br />
one can think of at least two ways by which a treated household would<br />
change its behavior in relation to this outcome. First, PAF households<br />
are part of the larger PAF community organization (CO) are and likely<br />
to benefit from social-networking and mobilization. Second, actual<br />
and perceived positive change in income (PAF funds) will likely reduce<br />
potential constraints to sending a child to school.<br />
68 ANNUAL PROGRESS REPORT (<strong>2010</strong>/20<strong>11</strong>)