Fiscal year 2010/11 - Poverty Alleviation Fund, Nepal
Fiscal year 2010/11 - Poverty Alleviation Fund, Nepal
Fiscal year 2010/11 - Poverty Alleviation Fund, Nepal

Create successful ePaper yourself
Turn your PDF publications into a flip-book with our unique Google optimized e-Paper software.
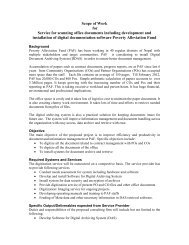
3.2. Results From Monitoring<br />
Data Analysis<br />
The re-social assessment of the sample 289 COs which are three or more<br />
than three <strong>year</strong>s of maturity period was carried out during <strong>2010</strong>.<br />
The comparative analysis of the re-social assessment data with the<br />
baseline social assessment shows that HH level assets increased, School<br />
enrollment of the children increased, improvement in food sufficiency<br />
duration of individual HH, and Construction and use of toilet/latrine<br />
increased.<br />
Similarly, the household level gross income (from all the sources) of the<br />
re-assessed 8,168 HHs has increased by 82.5 per cent in real term. A<br />
district-wise gross annual income change of CO members is provided in<br />
Annex 13. g <strong>year</strong>. The data was collected till November 15, 2009.<br />
The revolving fund assessment carried out during the end of FY<br />
2066/67, shows that community has been managing their revolving fund<br />
satisfactorily (Annex 14). The data collected as of July 16, <strong>2010</strong>, shows<br />
that fund provided to the COs by PAF has been increased by 7.8 per cent<br />
which includes the interest charges against the loan taken by its members,<br />
community contribution and fund collected from other sources.<br />
Similarly, among the total CO members, 84.6 per cent of the members have<br />
accessed the fund at least for one time to initiate their income generation<br />
activities. Out of the total members accessing the fund from RF, 8.72 per<br />
cent members have used the fund for more than two times, 19.77 per<br />
cent members have used two times and 71.51 per cent members have<br />
used one time.<br />
The assessment also shows 83.8 per cent of the total fund has been<br />
invested as loan to its members, 14.1 per cent of the fund is in bank and<br />
rest amount is as cash in hand in COs itself. Further, assessment shows<br />
that the average rate of repayment of the loan disbursed is 76 per cent<br />
3.3. Environmental Framework<br />
and Monitoring<br />
Majority of PAF supported sub- projects are of small and micro<br />
scales hence they hardly fall under legal obligations for environmental<br />
assessment. However, PAF realizes that even micro/small scale<br />
projects may have some environmental implications and has laid<br />
down Environment Management Framework (EMF) to address them as<br />
precautionary principles. EMF has standardized methods for the subprojects<br />
to assess the environmental problems associated with their<br />
implementation and ways to mitigate them.<br />
According to PAF EMF environmental assessment and planning mandatory<br />
during the project preparation for sub-project’s approval. Possible risks of<br />
proposed sub-project and their mitigation measures are identified by the<br />
community and documented as Environmental and Social Assessment<br />
(ESA) Checklist in facilitation from the partner organization. PAF monitors<br />
the compliance to this process during the sub project appraisal. During<br />
project implementation, PAF reviews the progress on implementation of<br />
the mitigation measures outlined in the ESA checklist. Both compliance<br />
and impact monitoring on environment are important components while<br />
conducting regular sub project monitoring.<br />
In addition, the monitoring team of Environmental Consultant also carries<br />
out special environmental monitoring of sub projects on sample basis.<br />
ERMC P. Ltd. In Association with SchEMs P. Ltd. has been working as<br />
environmental consultant from February 20<strong>11</strong>. 72 sub projects in six<br />
districts were monitored in FY <strong>2010</strong>/<strong>11</strong> by the environment consultant.<br />
Monitoring reports has not pointed out major harmful implications of the<br />
PAF IG or Infrastructure development activities on the local environment.<br />
The monitoring result has rather shown that Community-level<br />
environmental assessment and planning has increased environmental<br />
awareness among target communities and ensured environmental<br />
friendliness of the sub-projects.<br />
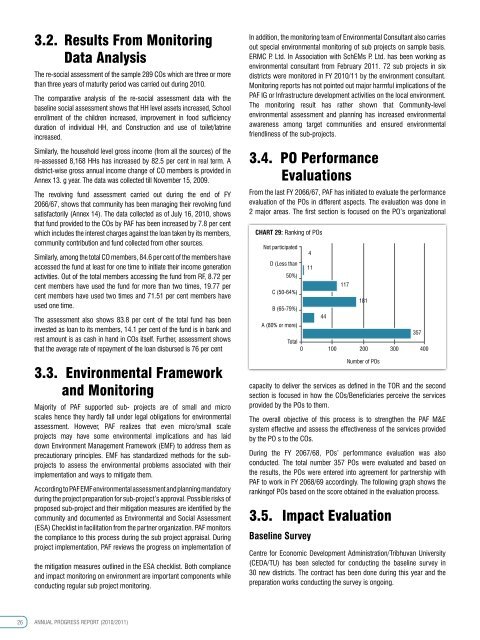
3.4. PO Performance<br />
Evaluations<br />
From the last FY 2066/67, PAF has initiated to evaluate the performance<br />
evaluation of the POs in different aspects. The evaluation was done in<br />
2 major areas. The first section is focused on the PO’s organizational<br />
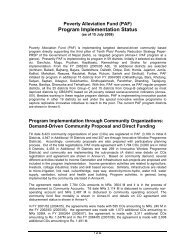
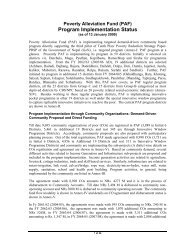
chart 29: Ranking of POs<br />
Not participated<br />
D (Less than<br />
<strong>11</strong><br />
50%)<br />
<strong>11</strong>7<br />
C (50-64%)<br />
181<br />
B (65-79%)<br />
44<br />
A (80% or more)<br />
357<br />
Total<br />
0 100 200 300 400<br />
capacity to deliver the services as defined in the TOR and the second<br />
section is focused in how the COs/Beneficiaries perceive the services<br />
provided by the POs to them.<br />
The overall objective of this process is to strengthen the PAF M&E<br />
system effective and assess the effectiveness of the services provided<br />
by the PO s to the COs.<br />
During the FY 2067/68, POs’ perfornmance evaluation was also<br />
conducted. The total number 357 POs were evaluated and based on<br />
the results, the POs were entered into agreement for partnership with<br />
PAF to work in FY 2068/69 accordingly. The following graph shows the<br />
rankingof POs based on the score obtained in the evaluation process.<br />
3.5. Impact Evaluation<br />
Baseline Survey<br />
4<br />
Number of POs<br />
Centre for Economic Development Administration/Tribhuvan University<br />
(CEDA/TU) has been selected for conducting the baseline survey in<br />
30 new districts. The contract has been done during this <strong>year</strong> and the<br />
preparation works conducting the survey is ongoing.<br />
26 ANNUAL PROGRESS REPORT (<strong>2010</strong>/20<strong>11</strong>)