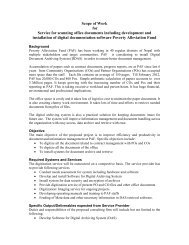
Fiscal year 2010/11 - Poverty Alleviation Fund, Nepal
Fiscal year 2010/11 - Poverty Alleviation Fund, Nepal
Fiscal year 2010/11 - Poverty Alleviation Fund, Nepal

You also want an ePaper? Increase the reach of your titles
YUMPU automatically turns print PDFs into web optimized ePapers that Google loves.
Table 17: Contribution by different agencies for infrastructure under construction<br />
Contribution in Million ( NRs)<br />
SN Type of Infrastructures<br />
PAF Community Others DDCVDC<br />
1 Rural Access 95.8 26.7 74.4 7.9<br />
2 Building 120.1 34.9 1.7 0.6<br />
3 Rural energy 146.8 66.8 133.2 42.7<br />
4 Small Irrigation 94.4 28.2 2.4 0.3<br />
5 Water supply 143.3 43.9 0.2 1<br />
6 Miscellaneous 5.2 1.3 0.1 0<br />
Total 605.4 201.3 2<strong>11</strong>.7 52.1<br />
Communities Contribution for Projects Under Construction<br />
Community has committed to contribute Rs. 201.3 million for under construction infrastructures. Their commitment is highest for rural energy (Rs 66.8<br />
million) and least for miscellaneous Rs 1.3 million).<br />
With respect to total cost, Community’s commitment for contribution is 18.9 per cent in average. This is maximum for water supply and sanitation (23.4<br />
per cent) followed by small irrigation (22.6 per cent) and least for rural access. It is 13.1 per cent with respect to total cost.<br />
Table 18: Communities Contribution for projects under construction<br />
Cost Contribution in per centage<br />
SN Type of Infrastructures<br />
PAF Community Others DDCVDC Total<br />
1 Rural Access 46.8% 13.1% 36.4% 3.9% 100<br />
2 Building 76.4% 22.2% 1.1% 0.4% 100<br />
3 Rural Energy 37.7% 17.2% 34.2% <strong>11</strong>% 100<br />
4 Small Irrigation 75.4% 22.6% 2% 0.3% 100<br />
5 Water Supply 76.1% 23.4% 0.2% 0.6% 100<br />
6 Miscellaneous 78.8% 19.7% 1.6% 0% 100<br />
Total 56.6% 18.9% 19.8% 4.9% 100<br />
ANNUAL PROGRESS REPORT (<strong>2010</strong>/20<strong>11</strong>) 21