Fiscal year 2010/11 - Poverty Alleviation Fund, Nepal
Fiscal year 2010/11 - Poverty Alleviation Fund, Nepal
Fiscal year 2010/11 - Poverty Alleviation Fund, Nepal

You also want an ePaper? Increase the reach of your titles
YUMPU automatically turns print PDFs into web optimized ePapers that Google loves.
Child Underweight Effects<br />
7. For child malnutrition, measured in terms of underweight, the impacts<br />
of PAF are as not strong as they are for other outcome indicators.<br />
Nevertheless, incidence of underweight among children under 5 <strong>year</strong>s of<br />
age is estimated to decrease by 5 to 10 per centage points. The results<br />
are however not statistically significant and also do not hold across<br />
different matching techniques and across multiple treatment groups. We<br />
take this as a sign of overall trend in the right direction and could see<br />
significant effects in the next couple of <strong>year</strong>s.<br />
Other Effects<br />
8. There are, as yet, no significant PAF impact evident on indicators<br />
associated with community/social capital (trust, respect, relationships<br />
between different ethnic groups, community disputes, etc.), although<br />
the overall trend for both groups is positive. Similarly, while there is<br />
no significant impact of PAF program on the use of health services/<br />
facilities, the effects are qualitatively positive on the use of agricultural<br />
centers, community forest services, and farmers’ groups.<br />
Targeting<br />
9. The targeting results are consistent with PAF’s objective of targeting the<br />
poorest households and support monitoring data results as well. Of the<br />
many categories that PAF uses to classify the disadvantaged, one is the<br />
level of food sufficiency. The other is whether the household is from Dalit<br />
or Janajati caste/ethnicity category. For example, the probability of being<br />
selected as PAF money recipient goes up by 25 per centage points if you<br />
are from a Dalit/Janajati household. Similarly, one per cent decrease in<br />
per capita consumption at the baseline is associated with 15 per centage<br />
points increase in the probability of being selected for PAF.<br />
70<br />
60<br />
50<br />
40<br />
30<br />
20<br />
10<br />
0<br />
-10<br />
-20<br />
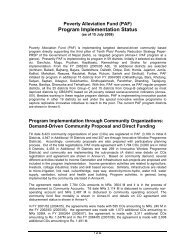
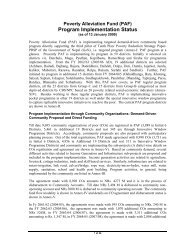
Reduction in Food insufficency<br />
6.8<br />
60.4<br />
Control<br />
Treatment<br />
17.2<br />
3 months or Less 6 months or Less<br />
10. The impact results are also consistent with PAF’s targeting the<br />
poorest households. Among other categories that PAF uses to classify<br />
the poor, one is the level of food sufficiency. Households are separated<br />
into four different groups under this category: hardcore poor (those with<br />
less than 3 months of food security either via own production or other<br />
-9.1<br />
dependable sources of income), medium poor (those with 3 to 6 months<br />
of food security), poor (those with 6 to <strong>11</strong> months of food security), and<br />
non-poor (those with 12 or more months of food security). The results<br />
show that the per centage of households with food insufficiency of 3<br />
months or less dropped from 13.8% in 2007 to about 5.5% in <strong>2010</strong>, a<br />
reduction of more than 60%, for the PAF beneficiary households (defined<br />
as those engaged in PAF supported income generating activities). The<br />
reduction was only about 6.8% for non-beneficiaries. Similarly, the<br />
per centage of households with food insufficiency of 6 months or less<br />
decreased from 40% in 2007 to about 33% in <strong>2010</strong>, a reduction of about<br />
17.5%, for PAF beneficiary households. There was no reduction for nonbeneficiaries<br />
during this period and in fact, there was an increase in food<br />
insufficiency of these households by about 9%.<br />
Access and Use of Services<br />
<strong>11</strong>. With the second phase of PAF II still ongoing, the number of poor<br />
households with access to improved infrastructure facilities has reached<br />
more than 49,000. The impact evaluation results show that the school<br />
enrollment rate for children from households engaged in PAF supported<br />
income generating activities increased by more than 7 per centage<br />
points. The enrollment rate was even higher for children from Dalit or<br />
Janajati households. While there was no obvious difference between the<br />
PAF beneficiaries and the non-beneficiaries in the use of health services/<br />
facilities, the beneficiary households were found to be making more<br />
use of agricultural centers, community forest services, and farmers’<br />
groups. The increased use of such services supports the monitoring<br />
data findings that PAF beneficiaries are investing in agriculture-related<br />
opportunities and reaching out to service providers to improve and<br />
develop these investments.<br />
Conclusions<br />
12. The evaluation results indicate that there is a positive and significant<br />
impact on household level welfare due to the PAF program relative to<br />
any other poverty reducing efforts that may be on-going at the same<br />
time. The results further indicate that the program is an effective tool for<br />
targeting the population considered most vulnerable in terms of caste<br />
and ethnicity as well as most food insecure. There are many process<br />
related questions that this impact evaluation does not yet answer. For<br />
example, a review of the monitoring data suggests that women groups<br />
are far more diversified in livelihood activities that mixed groups. Impacts<br />
on women only groups would need to be analyzed further as should the<br />
previously related positive indication of nutritional impact on children<br />
under 5 <strong>year</strong>s of age.<br />
13. The household-level panel data provide an opportunity for further<br />
analysis over time which may help us understand changes in poverty<br />
dynamics and for further counterfactual analysis of the outcomes<br />
reported in this paper. As such, a continuation of the survey methodology<br />
and of the impact evaluation analysis would be an important tool for<br />
policy makers and for the implementation of the poverty alleviation fund<br />
at the national level.<br />
(Ref. Impact Evaluation of the <strong>Nepal</strong> <strong>Poverty</strong> <strong>Alleviation</strong> <strong>Fund</strong>, WB/TU)<br />
ANNUAL PROGRESS REPORT (<strong>2010</strong>/20<strong>11</strong>) 69