Fiscal year 2010/11 - Poverty Alleviation Fund, Nepal
Fiscal year 2010/11 - Poverty Alleviation Fund, Nepal
Fiscal year 2010/11 - Poverty Alleviation Fund, Nepal

Create successful ePaper yourself
Turn your PDF publications into a flip-book with our unique Google optimized e-Paper software.
2. Facilitation of Community Through POs<br />
Partner Organizations (POs) are selected by PAF to facilitate Community<br />
Organizations of the Poor (COPs). The facilitation work of POs includes<br />
organizing COs, enhancing COs capacity development on planning<br />
activities, carry out detailed feasibility studies, survey design &<br />
estimates, and proposal preparation during preparatory phase, and<br />
provide technical assistance and monitoring and supervision of various<br />
sub-projects during implementation phase.<br />
As such, 370 Partner Organizations (POs) are working with communities<br />
(57 for Mountain Districts, 174 in hilly Districts, 128 for Terai districts<br />
and <strong>11</strong> for Innovative Window Programme and 37 for NDM-World Bank<br />
Programme). In addition, 17 POs were terminated due to their under<br />
performance.<br />
Table 4: Details of POs Number<br />
Description<br />
No. of Pos working<br />
Mountain 57<br />
Hills 174<br />
Terai 128<br />
Innovative Programme <strong>11</strong><br />
TOTAL 370<br />
NDM-World Bank 2005 12<br />
NDM-World Bank 2008 25<br />
GRAND Total 407<br />
3. Reaching Out to the Poor<br />
and Social Inclusion<br />
PAF has taken the strategy to with the thought that poor community should be<br />
organized themselves to prepare, implement and manage their programme<br />
and they should be in the driving seat, with decision making authority.<br />
chart 5: CO Members-Beneficary Category<br />
8.60%<br />
0.20%<br />
poor, and thus included as CO members in PAF programme.<br />
3.1. CO Members<br />
During the reporting <strong>year</strong>, PAF was able to reach out 64,758 poor HHs<br />
and organize them as CO member households to carry out different<br />
activities aimed at improving their livelihood. A total of 470,021 CO<br />
members households were benefited from PAF assistance till the end<br />
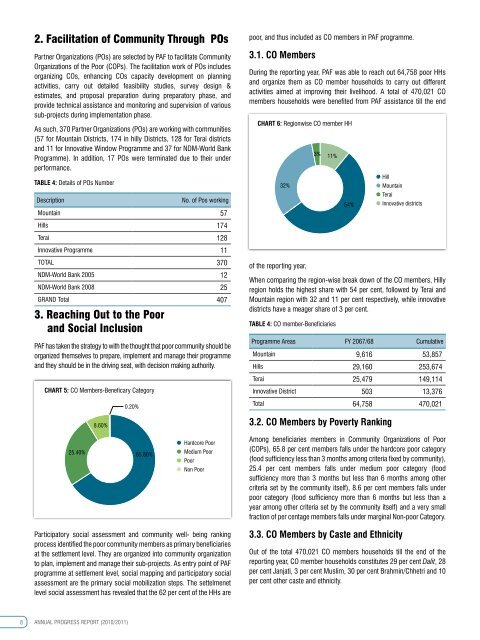
chart 6: Regionwise CO member HH<br />
32%<br />
of the reporting <strong>year</strong>,<br />
3%<br />
<strong>11</strong>%<br />
When comparing the region-wise break down of the CO members, Hilly<br />
region holds the highest share with 54 per cent, followed by Terai and<br />
Mountain region with 32 and <strong>11</strong> per cent respectively, while innovative<br />
districts have a meager share of 3 per cent.<br />
Table 4: CO member-Beneficiaries<br />
54%<br />
Programme Areas FY 2067/68 Cumulative<br />
Mountain 9,616 53,857<br />
Hills 29,160 253,674<br />
Terai 25,479 149,<strong>11</strong>4<br />
Innovative District 503 13,376<br />
Total 64,758 470,021<br />
3.2. CO Members by <strong>Poverty</strong> Ranking<br />
Hill<br />
Mountain<br />
Terai<br />
Innovative districts<br />
25.40%<br />
65.80%<br />
Hardcore Poor<br />
Medium Poor<br />
Poor<br />
Non Poor<br />
Among beneficiaries members in Community Organizations of Poor<br />
(COPs), 65.8 per cent members falls under the hardcore poor category<br />
(food sufficiency less than 3 months among criteria fixed by community),<br />
25.4 per cent members falls under medium poor category (food<br />
sufficiency more than 3 months but less than 6 months among other<br />
criteria set by the community itself), 8.6 per cent members falls under<br />
poor category (food sufficiency more than 6 months but less than a<br />
<strong>year</strong> among other criteria set by the community itself) and a very small<br />
fraction of per centage members falls under marginal Non-poor Category.<br />
Participatory social assessment and community well- being ranking<br />
process identified the poor community members as primary beneficiaries<br />
at the settlement level. They are organized into community organization<br />
to plan, implement and manage their sub-projects. As entry point of PAF<br />
programme at settlement level, social mapping and participatory social<br />
assessment are the primary social mobilization steps. The settelmenet<br />
level social assessment has revealed that the 62 per cent of the HHs are<br />
3.3. CO Members by Caste and Ethnicity<br />
Out of the total 470,021 CO members households till the end of the<br />
reporting <strong>year</strong>, CO member households constitutes 29 per cent Dalit, 28<br />
per cent Janjati, 3 per cent Muslim, 30 per cent Brahmin/Chhetri and 10<br />
per cent other caste and ethnicity.<br />
8 ANNUAL PROGRESS REPORT (<strong>2010</strong>/20<strong>11</strong>)