Load Duration and Seasoning Effects on Mortise & Tennon Joinery
Load Duration and Seasoning Effects on Mortise & Tennon Joinery
Load Duration and Seasoning Effects on Mortise & Tennon Joinery

You also want an ePaper? Increase the reach of your titles
YUMPU automatically turns print PDFs into web optimized ePapers that Google loves.
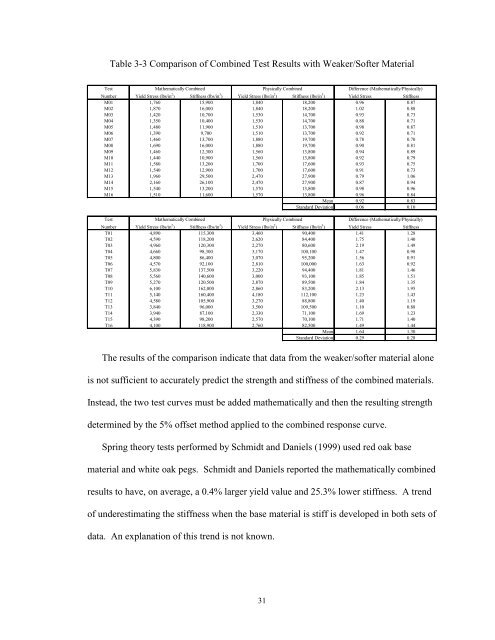
Table 3-3 Comparis<strong>on</strong> of Combined Test Results with Weaker/Softer Material<br />
Test<br />
Mathematically Combined<br />
Physically Combined<br />
Difference (Mathematically/Physically)<br />
Number Yield Stress (lbs/in 2 ) Stiffness (lbs/in 3 ) Yield Stress (lbs/in 2 ) Stiffness (lbs/in 3 ) Yield Stress Stiffness<br />
M01 1,760 15,900 1,840 18,200 0.96 0.87<br />
M02 1,870 16,000 1,840 18,200 1.02 0.88<br />
M03 1,420 10,700 1,530 14,700 0.93 0.73<br />
M04 1,350 10,400 1,530 14,700 0.88 0.71<br />
M05 1,480 11,900 1,510 13,700 0.98 0.87<br />
M06 1,390 9,700 1,510 13,700 0.92 0.71<br />
M07 1,460 13,700 1,880 19,700 0.78 0.70<br />
M08 1,690 16,000 1,880 19,700 0.90 0.81<br />
M09 1,460 12,300 1,560 13,800 0.94 0.89<br />
M10 1,440 10,900 1,560 13,800 0.92 0.79<br />
M11 1,580 13,200 1,700 17,600 0.93 0.75<br />
M12 1,540 12,900 1,700 17,600 0.91 0.73<br />
M13 1,960 29,500 2,470 27,900 0.79 1.06<br />
M14 2,160 26,100 2,470 27,900 0.87 0.94<br />
M15 1,540 13,200 1,570 13,800 0.98 0.96<br />
M16 1,510 11,600 1,570 13,800 0.96 0.84<br />
Mean 0.92 0.83<br />
St<str<strong>on</strong>g>and</str<strong>on</strong>g>ard Deviati<strong>on</strong> 0.06 0.10<br />
Test<br />
Mathematically Combined Physically Combined Difference (Mathematically/Physically)<br />
Number Yield Stress (lbs/in 2 ) Stiffness (lbs/in 3 ) Yield Stress (lbs/in 2 ) Stiffness (lbs/in 3 ) Yield Stress Stiffness<br />
T01 4,890 115,300 3,460 90,400 1.41 1.28<br />
T02 4,590 118,200 2,620 84,400 1.75 1.40<br />
T03 4,960 120,300 2,270 80,600 2.19 1.49<br />
T04 4,660 98,300 3,170 100,100 1.47 0.98<br />
T05 4,800 86,400 3,070 95,200 1.56 0.91<br />
T06 4,570 92,100 2,810 100,000 1.63 0.92<br />
T07 5,830 137,500 3,220 94,400 1.81 1.46<br />
T08 5,560 140,600 3,000 93,100 1.85 1.51<br />
T09 5,270 120,500 2,870 89,500 1.84 1.35<br />
T10 6,100 162,000 2,860 83,200 2.13 1.95<br />
T11 5,140 160,400 4,180 112,100 1.23 1.43<br />
T12 4,580 105,900 3,270 88,800 1.40 1.19<br />
T13 3,840 96,000 3,500 109,500 1.10 0.88<br />
T14 3,940 87,100 2,330 71,100 1.69 1.23<br />
T15 4,390 98,200 2,570 70,100 1.71 1.40<br />
T16 4,100 118,900 2,760 82,500 1.49 1.44<br />
Mean 1.64 1.30<br />
St<str<strong>on</strong>g>and</str<strong>on</strong>g>ard Deviati<strong>on</strong> 0.29 0.28<br />
The results of the comparis<strong>on</strong> indicate that data from the weaker/softer material al<strong>on</strong>e<br />
is not sufficient to accurately predict the strength <str<strong>on</strong>g>and</str<strong>on</strong>g> stiffness of the combined materials.<br />
Instead, the two test curves must be added mathematically <str<strong>on</strong>g>and</str<strong>on</strong>g> then the resulting strength<br />
determined by the 5% offset method applied to the combined resp<strong>on</strong>se curve.<br />
Spring theory tests performed by Schmidt <str<strong>on</strong>g>and</str<strong>on</strong>g> Daniels (1999) used red oak base<br />
material <str<strong>on</strong>g>and</str<strong>on</strong>g> white oak pegs. Schmidt <str<strong>on</strong>g>and</str<strong>on</strong>g> Daniels reported the mathematically combined<br />
results to have, <strong>on</strong> average, a 0.4% larger yield value <str<strong>on</strong>g>and</str<strong>on</strong>g> 25.3% lower stiffness. A trend<br />
of underestimating the stiffness when the base material is stiff is developed in both sets of<br />
data. An explanati<strong>on</strong> of this trend is not known.<br />
31