Timber Frame Tension Joinery - Timber Frame Engineering Council
Timber Frame Tension Joinery - Timber Frame Engineering Council
Timber Frame Tension Joinery - Timber Frame Engineering Council

Create successful ePaper yourself
Turn your PDF publications into a flip-book with our unique Google optimized e-Paper software.
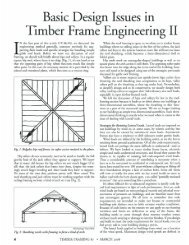
TIMBER FRAME<br />
TENSION JOINERY<br />
Richard J. Schmidt<br />
Robert B. MacKay<br />
A Report on Research Sponsored by the<br />
TIMBER FRAME BUSINESS COUNCIL<br />
WASHINGTON,D.C.<br />
Department of Civil and<br />
Architectural <strong>Engineering</strong><br />
University of Wyoming<br />
Laramie, WY 82071<br />
October 1997
50272-101<br />
REPORT DOCUMENTATION<br />
PAGE<br />
1. REPORT NO. 2. 3. Recipient's Accession No.<br />
4. Title and Subtitle 5. Report Date<br />
<strong>Timber</strong> <strong>Frame</strong> <strong>Tension</strong> <strong>Joinery</strong><br />
6.<br />
October 1997<br />
7. Author(s) 8. Performing Organization Report No.<br />
Richard J. Schmidt & Robert B. MacKay<br />
9. Performing Organization Name and Address<br />
Department of Civil and Architectural <strong>Engineering</strong><br />
University of Wyoming<br />
Laramie, Wyoming 82071<br />
10. Project/Task/Work Unit No.<br />
11. Contract(C) or Grant(G) No.<br />
(C)<br />
12. Sponsoring Organization Name and Address 13. Type of Report & Period Covered<br />
<strong>Timber</strong> <strong>Frame</strong> Business <strong>Council</strong><br />
1511 K Street NW, Suite 600<br />
Washington, D. C. 20005<br />
(G)<br />
14.<br />
final<br />
15. Supplementary Notes<br />
16. Abstract (Limit: 200 words)<br />
<strong>Timber</strong>-frame connections use hardwood pegs to hold the main member (tenon)<br />
within the mortise. Design of these connections is currently beyond the scope of<br />
building codes and the National Design Specification for Wood Construction (NDS).<br />
The objective of this research is to determine the feasibility of the yield model<br />
approach for the design of these connections. The research includes a study of the<br />
mechanical properties of the pegs used in mortise and tenon tension connections.<br />
Properties of interest include the peg' s flexural yield strength, the dowel bearing<br />
strength of a peg as it loads the frame material, and the peg' s shear strength.<br />
The results of this research show that the existing yield model equations from the<br />
NDS are applicable to hardwood pegs used as dowel fasteners in mortise and tenon<br />
connections. However, additional yield modes specific to these connections are<br />
needed.<br />
17. Document Analysis<br />
a. Descriptors<br />
traditional timber framing, heavy timber construction, structural analysis, wood peg fasteners,<br />
dowel connections, yield model<br />
b. Identifiers/Open-Ended Terms<br />
c. COSATI Field/Group<br />
18. Availability Statement 19. Security Class (This Report)<br />
21. No. of Pages<br />
Release Unlimited<br />
ii<br />
unclassified<br />
87<br />
20. Security Class (This Page)<br />
22. Price<br />
unclassified<br />
(See ANSI-Z39.18) OPTIONAL FORM 272 (4-<br />
Department of Commerce
Acknowledgments<br />
Acknowledgments go to the <strong>Timber</strong> <strong>Frame</strong> Business <strong>Council</strong> for their financial support<br />
of this project. For providing materials, thanks are extended to Scott Northcott; Christian<br />
& Son, Inc.; Resource Woodworks; Riverbend <strong>Timber</strong>framing, Inc.; Duluth <strong>Timber</strong>s;<br />
<strong>Timber</strong>peg; The Cascade <strong>Joinery</strong>; and <strong>Timber</strong>house Post and Beam.
Table of Contents<br />
Page<br />
1. Introduction................................................................................................................ 1<br />
1.1 General Overview .....................................................................................................................1<br />
1.2 Objective and Scope .................................................................................................................2<br />
2. <strong>Timber</strong> Framing Background....................................................................................4<br />
2.1 History of <strong>Timber</strong> Framing .....................................................................................................4<br />
2.2 Review of Relevant Research...................................................................................................6<br />
3. European Yield Model and Proposed Additions ..................................................... 10<br />
3.1 Introduction .............................................................................................................................10<br />
3.2 Development of European Yield Model .............................................................................10<br />
3.3 Alternate Derivation of the Mode IV Yield Model Equation ..........................................14<br />
3.4 Application of the European Yield Model to <strong>Timber</strong>-<strong>Frame</strong> Connections...................18<br />
3.5 Additional Yield Model Equations .......................................................................................22<br />
4. Peg Testing Procedures and Analysis......................................................................28<br />
4.1 General Testing Procedures for Hardwood Pegs...............................................................28<br />
4.2 Bending Test Procedure.........................................................................................................30<br />
4.3 Shear Test Procedure..............................................................................................................32<br />
4.4 Dowel Bearing Test Procedure .............................................................................................33<br />
4.5 Full-size Joint Test Procedures .............................................................................................37<br />
5. Test Results..............................................................................................................40<br />
5.1 Introduction .............................................................................................................................40<br />
5.2 Bending Test Results ..............................................................................................................41<br />
5.3 Shear Test Results ...................................................................................................................46<br />
ii
5.4 Dowel Bearing Test Results...................................................................................................52<br />
5.5 Full-size Test Results ..............................................................................................................53<br />
6. Overall Connection Strength and Design Recommendations ................................55<br />
6.1 Application of Factors of Safety ...........................................................................................55<br />
6.2 Current Design Procedures ...................................................................................................56<br />
6.3 Recommendations for <strong>Timber</strong>-<strong>Frame</strong> <strong>Joinery</strong>....................................................................56<br />
7. Conclusions and Recommendations for Future Work ............................................62<br />
7.1 Concluding Statements...........................................................................................................62<br />
7.2 Recommendations for Future Work ....................................................................................62<br />
iii
List of Tables<br />
Page<br />
Table 5-1 Bending Test Correlation Coefficients..........................................................................42<br />
Table 5-2 Additional Correlation Coefficients...............................................................................42<br />
Table 5-3 Correlation Between Peg Dia. and Bending Strength.................................................43<br />
Table 5-4 Bending Yield Strength Results......................................................................................44<br />
Table 5-5 Combined Bending Results.............................................................................................45<br />
Table 5-6 Correlation Data for Shear Tests ...................................................................................47<br />
Table 5-7 Correlation Between Peg Dia. and Yield Stress...........................................................48<br />
Table 5-8 Shear Results Summary ...................................................................................................49<br />
Table 5-9 Shear Test Results Summary...........................................................................................49<br />
Table 5-10 Average Values of Moisture Content and Specific Gravity .....................................51<br />
Table 5-11 Preliminary Dowel Bearing Strength Results (WO Pegs in Doug. Fir) .................52<br />
Table 5-12 Dowel Bearing Test Summary......................................................................................53<br />
Table 5-13 Dowel Bearing Test Correlation Data.........................................................................53<br />
Table 5-14 Full-size Test Results .....................................................................................................54<br />
Table 5-15 5% Shear Exclusion Value Summary ..........................................................................55<br />
Table 6-1 Kessel Results Summary..................................................................................................59<br />
iv
List of Figures<br />
Page<br />
Figure 1-1 Typical Mortise and Tenon Connection........................................................................1<br />
Figure 1-2 American <strong>Timber</strong> <strong>Frame</strong> (Redrawn from Sobon and Schroeder, 1984) ..................2<br />
Figure 3-1 Single Shear Failure Modes............................................................................................11<br />
Figure 3-2 Double Shear Failure Modes.........................................................................................11<br />
Figure 3-3 Assumed Dowel Rotation Load Diagram...................................................................12<br />
Figure 3-4 Assumed Dowel Yielding Load Diagram....................................................................12<br />
Figure 3-5 Assumed Load, Moment and Shear Diagrams...........................................................15<br />
Figure 3-6 Typical Load Deflection Curve (Bending Test, ¾” Dia. Red Oak Peg).................19<br />
Figure 3-7 Combined Shear - Bending Failure ..............................................................................20<br />
Figure 3-8 Relish Failure ...................................................................................................................20<br />
Figure 3-9 Tenon Splitting Failure...................................................................................................20<br />
Figure 3-10 Mortise Splitting Failure...............................................................................................20<br />
Figure 3-11 Standard Connection Geometry.................................................................................23<br />
Figure 3-12 Equivalent Bolt Diameter Example ...........................................................................26<br />
Figure 3-13 Proposed Mode III s '.....................................................................................................27<br />
Figure 3-14 Mode III s (Single Shear)...............................................................................................27<br />
Figure 4-1 Typical Load Deflection Curve (Bending Test, ¾” Dia. Red Oak Peg).................30<br />
Figure 4-2 Bending Test Setup.........................................................................................................31<br />
Figure 4-3 Shear Test Fixture...........................................................................................................33<br />
Figure 4-4 Standard Dowel Bearing Test .......................................................................................34<br />
Figure 4-5 Dowel Bearing Test Fixture ..........................................................................................35<br />
Figure 4-6 Orientation of Preliminary Test Blocks (RL, LR, LT, and TR) ...............................36<br />
v
Figure 4-7 RT Block Orientation.....................................................................................................36<br />
Figure 4-8 LT Block Orientation.....................................................................................................36<br />
Figure 4-9 Mortise and Tenon Grain Patterns...............................................................................37<br />
Figure 4-10 Full-size Joint Test Apparatus.....................................................................................38<br />
Figure 4-11 Full-size Test Specimen ...............................................................................................38<br />
Figure 5-1 Normal Distribution.......................................................................................................40<br />
Figure 5-2 Relationship Between Specific Gravity and Bending Yield Stress...........................45<br />
Figure 5-3 Red Oak Growth Rings vs. Specific Gravity ..............................................................48<br />
Figure 5-4 White Oak Growth Rings vs. Specific Gravity...........................................................48<br />
Figure 5-5 Average Shear Yield Stresses.........................................................................................50<br />
Figure 5-6 5% Exclusion Values From Shear Tests .....................................................................51<br />
Figure 6-1 Full-size Test Diagram ...................................................................................................58<br />
Figure 6-2 End, Edge Distances ......................................................................................................58<br />
Figure 6-3 Full-size Mortise and Tenon Connection....................................................................58<br />
Figure 6-4 Sample Connection Design Values ..............................................................................60<br />
Figure 6-5 Double Shear Yield Equations......................................................................................61<br />
vi
List of Appendices<br />
Page<br />
Appendix A Derivation of Dowel Rotation Load.........................................................................64<br />
Appendix B Derivation of Dowel Yielding Load .........................................................................65<br />
Appendix C NDS Yield Mode II, Alternate Derivation ..............................................................66<br />
Appendix D NDS Mode III s , Alternate Derivation .....................................................................68<br />
Appendix E Standard Test Setup for Instron Model 1332 Machine..........................................71<br />
Appendix F Peg Testing Form.........................................................................................................72<br />
Appendix G Bending Test Data ......................................................................................................73<br />
Appendix H Shear Test Data ...........................................................................................................77<br />
Appendix I Dowel Bearing Data .....................................................................................................83<br />
Bibliography ........................................................................................................................................85<br />
vii
Nomenclature and Glossary<br />
Special terms used in this report are defined below. Definitions are based on those given in<br />
(Macmillan, 1996), (Hewett, 1980), and (Hoadley, 1980), plus those offered by this<br />
researcher.<br />
5% exclusion value the value at which 95% of the values in the series of tests will<br />
exceed<br />
allowable stress design<br />
a method of design that uses allowable stresses to determine<br />
allowable loads on members, etc. Note that the allowable<br />
stresses have built in factors of safety.<br />
balloon framing<br />
a method of wood construction that uses dimensional lumber<br />
spaced at regular intervals to create walls, floors, etc.<br />
confidence level<br />
an indicator of the reliability of the results in a small sample<br />
and how closely they would match the entire population<br />
correlation<br />
data acquisition system<br />
having a mutual relationship<br />
an electronic system that retrieves data about the item or<br />
material being tested and records the information for later<br />
analysis<br />
double shear<br />
dowel bearing strength<br />
a condition in which two shear planes exist on a single object<br />
the strength of a material being loaded by a circular prismatic<br />
object that is oriented perpendicular to its long axis<br />
edge distance<br />
the distance measured perpendicular to the grain, from the<br />
center of the dowel to the edge of the member being loaded<br />
viii
elasto-plastic behavior<br />
an ideal yield behavior that exhibits a perfectly linear elastic<br />
region on the stress-strain curve up to the yield stress and<br />
stays at that stress level as further strain occurs<br />
end distance<br />
the distance measured parallel to the grain, from the center of<br />
the dowel to the end of the member being loaded<br />
European Yield Model<br />
a model developed by European scientists that describes how<br />
a timber connection might fail in terms of various modes of<br />
failure<br />
F e<br />
variable representing the dowel bearing strength of a material<br />
F em<br />
the dowel bearing strength of the main member<br />
F es<br />
flexural yield strength<br />
fork and tongue connection<br />
the dowel bearing strength of the side member<br />
the yield strength in bending of a certain object or material<br />
a connection that contains a single, centered tongue that fits<br />
in a slot at the end of another member, commonly used at a<br />
roof peak, where rafters join end-to-end<br />
F v ⊥<br />
the shear strength of the wood for loading perpendicular to<br />
the grain<br />
F v<br />
the shear strength of the wood for loading parallel to the<br />
grain<br />
F yb<br />
gravity loads<br />
the yield strength in bending of a dowel<br />
loads caused by gravity such as self weight and live loads<br />
ix
half-timber<br />
a traditional name for a common European framing system<br />
which used timbers that were split in half<br />
housing<br />
linear potentiometer<br />
a cavity large enough to hold the entire timber’s end<br />
an electronic device that measures displacements by returning<br />
a voltage signal that changes relative to the displacement<br />
longitudinal direction<br />
l v<br />
along the centerline of the tree (parallel to the grain)<br />
the distance from the center of the peg to the end of the<br />
tenon, end distance<br />
Mode II<br />
a single shear failure mode in which the peg rotates through<br />
both members<br />
Mode III<br />
a single or double shear failure mode in which the peg rotates<br />
through the main or side member(s) and a plastic hinge forms<br />
in the other member(s)<br />
Mode I<br />
a single or double shear failure mode in which dowel bearing<br />
failures occur in either the main or side member(s)<br />
Mode IV<br />
a single or double shear failure mode in which plastic hinges<br />
occur in the main and side member(s)<br />
Mode V<br />
Mode VI<br />
Mode VII<br />
mortise<br />
NDS<br />
a peg shear failure mode<br />
a failure mode in which the relish fails in shear<br />
a failure mode caused by mortise splitting<br />
a hole cut into a member in which the tenon is fit<br />
The National Design Specification for Wood Construction<br />
(see Bibliography)<br />
x
normal distribution<br />
orthotropic material<br />
a statistically ideal distribution of data about a mean value<br />
material that has significant strength differences along each<br />
axis of strength. These axes are 90° to each other.<br />
pith<br />
the small core of soft, spongy tissue located at the center of<br />
tree stems, branches and twigs<br />
plastic hinge<br />
a flexural hinge that develops in a dowel caused by material<br />
yielding plastically in tension and compression<br />
platform framing<br />
a method of timber construction similar to balloon framing<br />
that uses common elements and standard dimensions to<br />
create walls and floors that rest upon the platform below<br />
pressure transducer<br />
an electronic device that measures pressure in a system (such<br />
as a hydraulic system) by returning a voltage signal which<br />
changes relative to the changing pressure in a system<br />
radial direction<br />
the direction out from the center of the tree<br />
R e the ratio of dowel bearing strengths (F em /F es )<br />
Recycled <strong>Timber</strong><br />
timber that came from an older building to be used again in a<br />
newer one<br />
relish<br />
the material directly behind the peg at the end of the tenon<br />
R t the ratio of member thicknesses (t m /t s )<br />
shear span<br />
shear strength<br />
the distance between the loading block and the reaction block<br />
the average shear stress on a cross-section at failure under<br />
shear loading<br />
xi
shoulder<br />
a ledge cut into the joined member that carries the entire<br />
width of a joining member<br />
single shear<br />
specific gravity<br />
standard deviation<br />
a condition in which one shear plane exists on a single object<br />
the ratio of the density of a material to the density of water<br />
a numerical value representing how closely a series of data is<br />
grouped about the mean<br />
stress-skin panel<br />
an insulated panel composed of rigid foam insulation and<br />
covered by structural paneling on one or both sides<br />
stroke rate<br />
t<br />
tangential direction<br />
tenon<br />
tie beam<br />
the speed that the piston on a test apparatus moves<br />
variable representing the thickness of a member<br />
a direction tangent to the growth rings of a tree<br />
the stub on the end of a member that fits into a mortise<br />
a beam oriented transversely in a building to tie walls<br />
together; tie beams have end joints subjected to withdrawal<br />
loads<br />
timber frame<br />
traditional, stand-alone, heavy timber structure with all-wood<br />
joinery<br />
t m<br />
thickness of the tenon or main member<br />
t s<br />
ultimate load<br />
wattle and daub<br />
yield strength<br />
thickness of the mortise side<br />
the maximum load that can be obtained<br />
a method of infilling a wall that used woven sticks and mud<br />
the capacity of a material or member associated with yield<br />
behavior<br />
xii
xiii
1. Introduction<br />
1.1 General Overview<br />
The goal of this project was to quantify the strength of the timber mortise and tenon<br />
connection when loaded in tension. This connection is made entirely of wood and has been<br />
used for centuries; however, its behavior has never been described mathematically. A typical<br />
application of the mortise and tenon connection is to join a beam to a post (Figure 1-1) in a<br />
heavy timber structure. A mortise is notched out of the post and a tenon on the end of the<br />
beam is then fit into the mortise. The entire system is held together with hardwood pegs.<br />
An example of a situation in which this connection is loaded in tension in a timber frame is<br />
at the end of a tie beam (Figure 1-2) (Hewett, 1980).<br />
This method of connecting wood members became obsolete in the early 1800’s as<br />
inexpensive nails began to replace the all-timber connections (Elliot and Wallas, 1977). This<br />
traditional style of timber framing has only recently regained popularity in housing and other<br />
heavy timber construction. The modern timber frame is energy efficient (through use of<br />
stress-skin panel insulation), comfortable to live or work in, elegant in style, and efficient in<br />
its use of timbers.<br />
Mortise<br />
Tenon<br />
Wood<br />
Pegs<br />
Post<br />
Beam<br />
Figure 1-1 Typical Mortise and Tenon Connection<br />
1
Tie Beam<br />
Figure 1-2 American <strong>Timber</strong> <strong>Frame</strong> (Redrawn from Sobon and<br />
Schroeder, 1984)<br />
Structures made with the mortise and tenon joint have survived for hundreds of<br />
years. The mortise and tenon connection has been used in countless applications from<br />
furniture, to house construction, to ship building, and has proven itself time and again.<br />
An analytical model was needed to verify the strength of the mortise and tenon<br />
connection. This was not with the intent to change traditional construction practices but to<br />
quantify the strength of the joint.<br />
1.2 Objective and Scope<br />
The objective of this project was to develop an analytical model to predict the<br />
strength of the mortise and tenon connection when loaded in tension. The overall<br />
connection strength is dependent on many different factors. These factors include the<br />
bending and shear strengths of the peg, the dowel bearing strength of the peg in the frame<br />
2
materials, and the shear strength of the frame material. These factors must be combined<br />
into an appropriate analytical model. The model is an extension of the European Yield<br />
Model (EYM) (Larsen, 1973). The EYM was developed for connections using steel bolts<br />
and was extended by this research for use with wood peg connections. One important<br />
aspect of this project was the need to obtain material data for wood pegs. To this end, tests<br />
were conducted to obtain the material properties of species commonly used in mortise and<br />
tenon connections. Full-size connection tests were also conducted to validate the analytical<br />
model.<br />
The final objective of the project was to develop design procedures and<br />
recommendations for construction using connections of this type.<br />
3
2. <strong>Timber</strong> Framing Background<br />
2.1 History of <strong>Timber</strong> Framing<br />
The timber frame has been in existence for more than two thousand years. <strong>Timber</strong><br />
framing came about slowly, as the tools became available and the laborers grew to be<br />
talented enough to do the work. The mortise and tenon joint was created sometime between<br />
500 B.C. and 200 B.C. (Benson, 1997). This joint allowed a semi-rigid connection between<br />
the members of a frame. The first timber-frame buildings were constructed about the time<br />
of Christ (Benson, 1997). Early timber frames were made rigid by digging holes for the<br />
posts and compacting earth around the posts. This provided lateral support for the building,<br />
but the posts rotted quickly. The carpenters were forced to modify the structures to make<br />
them able to stand above the ground on stone foundations. To do this, the frames needed<br />
to be made stiffer. This was accomplished by means of diagonal bracing and stronger<br />
joinery.<br />
As architectural systems emerged in Europe, the most common style was the framed<br />
wall system. In this system, the exterior walls were capable of supporting the weight of the<br />
roof above, and they contained the secondary elements of door and window openings,<br />
interior panels, and a weather resistant exterior covering. These systems varied by region,<br />
but in all cases they used the mortise and tenon connection and used beams made from logs<br />
that were split in half. From this method came the more traditional name, half-timber<br />
(Charles, 1984).<br />
<strong>Timber</strong> frames became available to the common homeowner around 1450 (Charles,<br />
1984). In the 1600’s, the craft of timber framing reached its peak in Europe (Sobon and<br />
Schroeder, 1984). But as the supply of long, straight timbers dwindled, carpenters were<br />
4
equired to use shorter posts and beams, and crooked members wherever possible.<br />
Architectural styles began to show these modifications.<br />
When colonists settled in America they naturally built homes similar to those in their<br />
homeland. These homes were meant to be functional. Long, straight timbers from virgin<br />
forests were plentiful so craftsmen began to build homes like those in Europe. The homes<br />
were small and usually had one room, but were sturdy and kept out the harsh New England<br />
weather. Communities worked together to build the structures. The designs for the timber<br />
frames were modified and constructed so that they could be assembled on the ground as<br />
large units and raised into place, to fit precisely into other members. American architecture<br />
did not have the limits of short timbers, for it was common to have 9” x 12” x 50’ timbers in<br />
barns (Sobon and Schroeder, 1984). American timber framing gained a style all to its own.<br />
The first buildings in the colonies used a wattle and daub method of infilling. This<br />
method came from Europe and called for branches and twigs to be woven between the main<br />
timbers and packed with mud to seal the wall. This proved ineffective in New England since<br />
the extreme weather caused shrinkage and swelling in the wattle and daub and eventually<br />
cracking. The colonists shifted to a wooden clapboard siding with a plaster interior.<br />
In the 1600’s, craft guilds comprised of carpenters were common. In these guilds,<br />
masters would teach apprentices the skills of the trade. The guilds were very competitive<br />
with each other, so they had to survive on good reputation and quality work. <strong>Timber</strong> frames<br />
were commonly built until around the 1830’s when a machine was introduced that could<br />
produce nails quickly and inexpensively (Elliot and Wallas, 1977). Also, hand-hewn timbers<br />
were being replaced with standardized sawn lumber cut with steam-powered circular saws<br />
(Sobon and Schroeder, 1984). At this time, the demand for fast, inexpensive housing was<br />
growing in America due to the number of people moving and settling in the western<br />
5
territories. Using the new construction materials, new forms of framing, called balloon and<br />
platform framing, were introduced and homes could be built quickly to meet the demand.<br />
Another benefit at the time was that the labor force did not need to be as skilled. Thus,<br />
timber framing was replaced with alternative construction methods and the craft guilds,<br />
needed to pass along the traditions, were no more.<br />
2.2 Review of Relevant Research<br />
Research in timber framing in general, and traditional joinery in particular, is limited<br />
not only in the United States but also internationally. Since the mid-1970’s when the revival<br />
of the craft began, the research community has regarded timber framing as indistinct from<br />
conventional heavy-timber, post and beam construction. The first significant research work<br />
done in timber framing was that by Brungraber (1985). Dr. Brungraber’s research was broad<br />
in scope and examined full structure, as well as individual joint, behavior via both<br />
experimental and numerical studies.<br />
A more recent research project has just been completed at Michigan Technological<br />
University under the direction of Dr. William M. Bulleit (Sandberg et al., 1996; Bulleit et al.,<br />
1996). Bulleit’s research was guided in part by the path taken by Dr. Brungraber. However,<br />
Bulleit defined a more narrow objective and conducted a comprehensive investigation of<br />
timber frame subassemblies under gravity loads. A major objective of Bulleit’s work was the<br />
identification of joint behavior and its role in the overall structural response. He developed<br />
a special-purpose structural analysis computer program that includes semi-rigid joint<br />
behavior.<br />
One of the major findings from Bulleit’s research was that tightly fitting joints, in<br />
which little movement is allowed between the tenon and mortise, carry gravity loads with<br />
less peg damage than occurs in loose joints. Also, mortise and tenon connections with a<br />
6
shoulder that can carry the entire width of the beam perform better under gravity loads than<br />
unshouldered mortise and tenon connections or fork and tongue-type connections. An<br />
overall impression from these tests is that these joints have remarkable load capacity and<br />
resistance to catastrophic failure (Sandberg et al., 1996).<br />
Preliminary work done at the University of Wyoming on the design of tension<br />
joinery was discussed in (Schmidt et al., 1996). Emphasis was on the applicability of the<br />
NDS yield modes to all-wood connections and the presentation of material strength test<br />
data.<br />
Other research efforts in the U. S. have focused on peg characteristics and joint<br />
design. An investigation of dowel bearing strength for pegged joints was performed at the<br />
University of Idaho by J. R. Church (Church and Tew, 1997; Church, 1995). Church<br />
performed bearing tests on Red Oak and Douglas Fir specimens using White Oak pegs.<br />
One of his findings was that the bearing strength of both materials was higher when the peg<br />
was loaded in the radial orientation (perpendicular to growth rings) than when loaded in the<br />
tangential orientation, regardless of the orientation of the base material. Another finding<br />
was that the bearing strength of the Red Oak was independent of the base material<br />
orientation. That is, dowel bearing strength parallel to the grain is not significantly higher<br />
than that perpendicular to the grain when the dowel consists of a white oak peg. Also there<br />
seemed to be no significant effect from the variation in hole size for a given peg size.<br />
A program of joint specimen tests and analytical analysis for timber bridge<br />
construction was performed at the Massachusetts Institute of Technology (Brungraber and<br />
Morse-Fortier, 1996). Both of these studies have produced valuable data regarding the<br />
bending, shear and bearing characteristics of hardwood pegs.<br />
7
Although timber framing is still a popular building method in Europe (especially<br />
England and Germany) and in the Orient, little useful international research has been<br />
located. Oriental construction styles differ markedly from that used in the United States<br />
(Abe and Kawaguchi, 1995; King et al., 1996). <strong>Timber</strong>-frame structures in Japan and China<br />
generally involve complex joinery and ornate structural forms. In addition, Oriental practice<br />
commonly relies on stacked and interlocked members in order to assure structural integrity.<br />
In sharp contrast, United States practice involves longer members that are fewer in number<br />
with less intricate joinery. Hence, the results of the available research do not apply to U. S.<br />
practice.<br />
Traditional techniques in Europe closely resemble U. S. practice. However, little is<br />
published that pertains specifically to timber framing. Two valuable research articles in<br />
German have been translated (Peavy and Schmidt, 1995; 1996). While limited in scope, the<br />
recommendations contained in the second of these two reports form the basis of all timber<br />
frame reconstruction and restoration now performed in Germany (Kessel, 1996). Due to<br />
the high costs of good-quality, solid-sawn timber in Europe, new timber frames are not built<br />
in the traditional manner. Reconstructions are limited to structures of significant historical<br />
importance for which cost is (almost) no object (Kessel, 1988).<br />
M. H. Kessel performed 120 tests on full-size all-wood connections constructed of<br />
freshly-cut Oak and dry Spruce timber, of which 80 were traditional mortise and tenon<br />
joints. These connections were each held together with two Oak pegs. The cross sections of<br />
the members ranged in size from 5.5”x5.5” to 7.9”x7.9” (140mm x 140mm to 200mm x<br />
200mm). The Oak pegs ranged in diameter from 0.9” to 1.6” (24mm to 40mm). Results<br />
from the all-Oak connections (Peavy and Schmidt, 1996) are presented as design<br />
recommendations in this report (see Table 6-1).<br />
8
Studies in the U. S. that adapt and apply the European yield model to domestic<br />
practice for bolted connections are reported in (Thangjitham, 1981; McLain and<br />
Thangjitham, 1983; Soltis et al., 1986; Soltis et al., 1987; Soltis and Wilkinson, 1987;<br />
Wilkinson, 1993).<br />
Technical literature on timber frame joinery design is limited. Reviews of current<br />
practice, which is based on interpretations of past research and available design standards,<br />
are found in (Brungraber, 1992a; Brungraber, 1992b). Alternatives to all-wood joinery<br />
involving metallic fasteners are described in (Brungraber, 1992a) and (Duff et al., 1996).<br />
There are several craft-oriented books that present the history, architectural design,<br />
and construction techniques for timber frames. These include (Elliot and Wallas, 1977;<br />
Benson and Gruber, 1980; Sobon and Schroeder, 1984; Benson, 1997; Sobon 1994). In<br />
these books, details related to engineering design are usually limited to span tables for<br />
bending members (floor beams). Carpentry details of Oriental joinery are found in (Seike,<br />
1977).<br />
Even though the joinery used in timber-frame structures resembles that used by<br />
carpenters in the furniture industry, significant differences exist. The basic mortise and<br />
tenon joint used in furniture construction (Hill and Eckelman, 1973) includes a relatively<br />
short (stub) tenon and relies on adhesives to secure the joint. Doweled joints in furniture<br />
(Eckelman, 1970; 1979) use the wood dowel as a replacement for the tenon, rather than as<br />
an anchor to prevent tenon withdrawal from the mortise. These joints also rely on adhesives<br />
to secure the joint. Hence, the relatively large body of literature in furniture joinery is not<br />
applicable to the structural systems considered here.<br />
9
3. European Yield Model and Proposed Additions<br />
3.1 Introduction<br />
Today, the craft of timber framing is returning. Craftsmen are re-learning the skills<br />
of the trade by studying existing buildings and applying the techniques to modern<br />
construction. Building officials, however, are often not familiar with this construction<br />
method and will not rely on previous standards for today’s practices. The problem is not in<br />
the structural members, for the behavior of beams and columns is well understood, but in<br />
the timber-frame connections. A method to determine the strength of these connections is<br />
therefore required.<br />
This chapter will focus on the existing yield model and its derivation and will<br />
determine how it could be applied to timber-frame connections. An alternate analysis of one<br />
of the yield modes is shown and was used to determine its applicability to pegged mortise<br />
and tenon connections. As a result of this analysis, additional yield modes are introduced,<br />
specific to pegged mortise and tenon connections.<br />
3.2 Development of European Yield Model<br />
A mathematical model for determining connection strength was developed in 1941<br />
by K. W. Johansen, who applied the theory to connections with metal dowel fasteners (Aune<br />
and Patton-Mallory, 1986). This model was used to analyze single and double shear timber<br />
connections that used bolts as the primary fasteners. To analyze the connections, Johansen<br />
compared the dowel bearing strength of the bolt to its bending strength to obtain the overall<br />
strength of the connection (Johansen, 1949). H. J. Larsen extended Johansen’s development<br />
to include various failure modes for single and double shear connections (Larsen, 1973).<br />
Figures 3-1 and 3-2 illustrate the various failure modes for single and double shear<br />
connections. Labeling of the modes follows National Design Specification for Wood<br />
10
Figure 3-1 Single Shear Failure Modes<br />
Figure 3-2 Double Shear Failure<br />
Modes<br />
Construction (NDS) nomenclature (AFPA, 1991). The current code makes use of the work<br />
done by Johansen, Larsen and others.<br />
Modes I m and I s are bearing failure modes of the base material. The shaded region<br />
near the dowel represents base material that has yielded in bearing. Mode II is a single shear<br />
failure mode in which the dowel rotates in both the main and side members, causing the<br />
base material to yield. Mode III and IV failures can occur in both single and double shear<br />
modes and is characterized by both dowel and base yielding. Mode III occurs when the<br />
dowel rotates in the main or side members and develops a plastic hinge in bending, while<br />
simultaneously crushing the base material. Mode IV occurs when hinges form in both main<br />
and side members in combination with base material crushing. Note that some of the single<br />
shear yield modes are not possible in double shear, since it is not possible for the dowel to<br />
rotate in the main member.<br />
Larsen divided these failure modes into two possible scenarios of dowel rotation and<br />
dowel bending. If the dowel was very stiff, then it could rotate in the wood, crushing the<br />
fibers on either side. If the dowel was flexible and the surrounding wood had a high<br />
11
strength, then the dowel could bend, causing a plastic hinge to form in the dowel. He<br />
assumed that both materials behaved elasto-plastically, meaning that when the stress in the<br />
material reached yielding, then no more stress could be applied. The scenarios are illustrated<br />
in Figure 3-3 and Figure 3-4.<br />
For each scenario, the load can be found in terms of its eccentricity.<br />
For the first scenario of the dowel rotating in the material (see Figure 3-3):<br />
2 2<br />
[ ( 2 ) ( 2 )]<br />
P= e+ t + t − e+<br />
t DF e<br />
(3-1)<br />
For the second scenario of the dowel yielding in the material (see Figure 3-4):<br />
⎡<br />
2<br />
DF ⎤<br />
2<br />
yb<br />
P= ⎢ e + −eDF<br />
⎥<br />
Fe<br />
⎣<br />
⎢ 3<br />
⎦<br />
⎥<br />
e<br />
(3-2)<br />
The figures come from the work of S. Thangjitham (Thangjitham, 1981). The key<br />
parameters for the above equations and figures are as follows: P represents the load applied<br />
Figure 3-3 Assumed Dowel<br />
Rotation Load Diagram<br />
Figure 3-4 Assumed Dowel<br />
Yielding Load Diagram<br />
12
to the dowel and e is the eccentricity of the load; the material thickness and dowel diameter<br />
are t and D, respectively; the positions of the dowel pivot point and plastic hinge point are x<br />
and Z, respectively; the dowel bearing strength of the base material is F e and the bending<br />
yield strength of the dowel is F yb . Equations 3-1 and 3-2 are derived in Appendices A and B,<br />
respectively.<br />
These equations are applied to each yield mode to determine joint capacity. For<br />
instance, the single shear Mode IV has the same type of failure in both the main and side<br />
member. Therefore, Eq. 3-2 can be used for each member. From equilibrium, the yield load<br />
in each member must be equal, and is the following (Thangjitham, 1981):<br />
P=<br />
D<br />
2<br />
2F F<br />
em<br />
⎛ F<br />
31 ⎜ +<br />
⎝ F<br />
yb<br />
em<br />
es<br />
⎞<br />
⎟<br />
⎠<br />
(3-3)<br />
The above equation uses F em and F es for the dowel bearing strength in the main<br />
(thicker) and side (thinner) members, respectively.<br />
The derivation of these equations is based on the assumption that a single, unique<br />
position for the eccentricity can be found and that the resultant of the load for the entire<br />
connection is at this location. Section 3.3 contains an alternative method for calculating the<br />
yield load for Mode IV.<br />
The yield loads for the single shear modes are as follows:<br />
P D t F<br />
I m em<br />
m = ⋅ ⋅ (3-4)<br />
P D t F<br />
I s es<br />
s<br />
= ⋅ ⋅ (3-5)<br />
PII = k1 ⋅D⋅ts ⋅Fes<br />
(3-6)<br />
P<br />
III<br />
= k2<br />
⋅D⋅tm⋅F<br />
m<br />
( 1+ 2⋅R<br />
)<br />
e<br />
em<br />
(3-7)<br />
13
P<br />
III<br />
s<br />
=<br />
k3<br />
⋅D⋅ts<br />
⋅F<br />
( 2 + R )<br />
e<br />
em<br />
(3-8)<br />
P<br />
IV<br />
= D<br />
2<br />
2<br />
⋅F<br />
em<br />
⋅F<br />
yb<br />
3⋅ ( 1+<br />
R )<br />
e<br />
(3-9)<br />
where:<br />
k<br />
1<br />
=<br />
2 2 2 3<br />
R + 2⋅R ⋅ ( 1+ R + R ) + R ⋅R − R ⋅ ( 1+<br />
R )<br />
e e t t t e e t<br />
( 1+<br />
R )<br />
e<br />
(3-10)<br />
k<br />
2<br />
=− Fyb<br />
Re<br />
D<br />
1 + 2 ⋅ 1 + 2 1 2<br />
R + ⋅ ⋅ ( + ⋅ )<br />
(<br />
e<br />
)<br />
⋅<br />
2<br />
3⋅F<br />
⋅t<br />
em<br />
m<br />
2<br />
(3-11)<br />
k<br />
3<br />
=− 1+<br />
2⋅ ( 1+<br />
R F R D<br />
e<br />
) 2<br />
yb<br />
2<br />
e<br />
+ ⋅ ⋅ ( + ) ⋅<br />
2<br />
R 3⋅F<br />
⋅t<br />
e<br />
em<br />
s<br />
2<br />
(3-12)<br />
The other key parameters for these equations are R e which is the ratio of main and<br />
side bearing strengths (F em /F es ), and R t which is the ratio of main to side thicknesses (t m /t s ).<br />
For the double shear yield modes, simply multiply the single shear yield mode that<br />
applies, by two.<br />
3.3 Alternate Derivation of the Mode IV Yield Model Equation<br />
As a check on the derivation of the yield model equations, another approach was<br />
taken in this research. Instead of looking at the equilibrium of the entire connection, the<br />
equilibrium of the dowel was the main concern. An assumed load distribution was to be<br />
applied to the dowel for the failure mode in question as a means to obtain a more intuitive<br />
derivation (see Figure 3-5). The single shear Mode IV is one that contains two plastic hinges<br />
in the dowel. This scenario could occur if the side and main members had high dowel<br />
bearing strengths while the peg was flexible.<br />
In Figure 3-5, the loading outside of each plastic hinge was unknown so the dowel<br />
bearing strength was used arbitrarily. This assumption allowed calculations to be performed<br />
14
and the results obtained match those of others.<br />
In Figure 3-5, the deformed shape and the stress distribution on the peg are<br />
assumed. Joint capacities from the model generally agree well with experimental<br />
observations. Nevertheless, there are inconsistencies in the theory. For instance, the<br />
location of maximum bending moment in the peg does not coincide with the location of the<br />
hinge in the assumed deformed shape (Figure 3-5).<br />
Figure 3-5 Assumed Load, Moment and Shear Diagrams<br />
15
The areas under the shear diagram can be represented as follows:<br />
FemDa( 2a)<br />
2<br />
A1<br />
= = FemDa<br />
2<br />
A<br />
2<br />
( 2a)( FemD 2a)<br />
= = FemDa<br />
2<br />
2<br />
(3-13)<br />
(3-14)<br />
A<br />
A<br />
3<br />
4<br />
2<br />
= F Dd<br />
(3-15)<br />
es<br />
2<br />
= F Dd<br />
(3-16)<br />
es<br />
From mechanics of materials, the plastic moment capacity for a circular cross-section in<br />
bending is:<br />
M<br />
F D 3<br />
yb<br />
p<br />
=<br />
(3-17)<br />
6<br />
From the moment diagram, we have<br />
2<br />
M = F Da<br />
p<br />
em<br />
(3-18)<br />
2 ⋅ M = A2 + A3<br />
p<br />
(3-19)<br />
Substituting for M p , A 2 and A 3 , and solving for a, we obtain:<br />
a =<br />
F D<br />
yb<br />
2<br />
⎛ F<br />
3Fem⎜1+<br />
⎝ F<br />
em<br />
es<br />
⎞<br />
⎟<br />
⎠<br />
(3-20)<br />
P= FemD 2 a<br />
(3-21)<br />
For single shear, the Mode IV capacity is:<br />
2F F<br />
2 em yb<br />
P=<br />
D<br />
⎛ F ⎞<br />
em<br />
31 ⎜ + ⎟<br />
⎝ F ⎠<br />
es<br />
(3-22)<br />
In actual mortise and tenon connections, hinges similar to the Mode IV hinges have<br />
been observed but at a very close spacing. The purpose of the following analysis is to<br />
predict the spacing between the Mode IV hinges from a strength of materials approach and<br />
compare it to actual distances to learn if this mode occurs or if something else is happening.<br />
16
Plastic hinges occur in the peg due to bending and are located at points of maximum<br />
moment (see Figure 3-5). This derivation is as follows:<br />
From equilibrium:<br />
x<br />
A<br />
P<br />
= (3-23)<br />
DF<br />
em<br />
For failure to occur, two plastic hinges must occur in the peg. Areas under the shear<br />
diagram give<br />
DF ( a − b) x DF ( d − c)<br />
x<br />
+<br />
2 2<br />
em A es D<br />
= 2 M<br />
(3-24)<br />
p<br />
DFem( a − b)<br />
= P<br />
(3-25)<br />
DF ( d − es<br />
c ) = P<br />
(3-26)<br />
Simplifying Equation 3-24, we obtain<br />
Px<br />
A<br />
+ PxD = 4 M<br />
p<br />
(3-27)<br />
x<br />
D<br />
4M<br />
p<br />
= −x<br />
P<br />
A<br />
(3-28)<br />
Total distance between hinges is<br />
x = x + x<br />
(3-29)<br />
A<br />
D<br />
4M<br />
p<br />
4FybD<br />
x = =<br />
P 6P<br />
3<br />
(3-30)<br />
Substituting Eq. 3-22 into Eq. 3-30 we obtain<br />
x = D<br />
⎛ F<br />
2Fyb⎜1+<br />
⎝ F<br />
3F<br />
em<br />
em<br />
es<br />
⎞<br />
⎟<br />
⎠<br />
(3-31)<br />
As a numerical example, typical values for 1” Red Oak Pegs in Douglas Fir give a<br />
total distance between plastic hinges of 3.0 inches (using F yb = 12,601 psi, F em = 2070 psi,<br />
17
and F es = 1728 psi) (see Sections 5.2 and 5.4). As will be discussed later, typical test results<br />
show hinges that are much closer together than is predicted with this yield mode.<br />
3.4 Application of the European Yield Model to <strong>Timber</strong>-<strong>Frame</strong> Connections<br />
The yield model failure modes may be applied to timber frame connections since<br />
they are based on equilibrium and compatibility of materials and the only difference in the<br />
equations is the material used for the dowel. The wood pegs are assumed to yield in bending<br />
similarly to the steel dowels in the original derivation. Steel dowels yield plastically in<br />
bending with the entire cross-section deforming plastically after yielding is reached. It is<br />
important to note that the cross-section continues to gain resistance to load after the<br />
extreme fibers yield in tension or compression, up to the point where all of the material in<br />
the cross-section has yielded. After the entire section is yielded, the dowel can resist little<br />
additional load. Similar behavior occurs in wood as can be seen in Figure 3-6. Wood pegs<br />
are therefore assumed to yield plastically in bending.<br />
In the typical mortise and tenon joint (Figure 1-1), a state of double shear exists. For<br />
this reason, the following discussion will focus on the double shear yield model failure<br />
modes (Figure 3-2).<br />
The four modes of double shear failure can be assumed to apply. However,<br />
additional modes of failure have been observed in timber-frame connections. After<br />
comparing the theoretical hinge spacing of Mode IV to actual failed connections, where the<br />
hinge spacing is much closer than predicted, one must conclude that other factors exist to<br />
cause failure. The Mode IV equations are based on a simple bending failure in the dowel.<br />
Wood pegs, quite possibly, fail due to the combined effect of bending and shear on the<br />
cross-section. Since wood is so highly orthotropic, its strength is dependent on the loading<br />
orientation. Also, wood is typically weak in shear. This combined effect would tend to<br />
18
cause the hinges to form closer together than as predicted by pure bending, since the shear<br />
strength would influence the overall strength of the system and the resulting shape would be<br />
similar to that seen in Figure 3-7.<br />
Another failure possible in timber-frame connections is known as a relish failure and<br />
is related to the end distance (l v ) of the peg in the tenon. When the tenon is loaded in<br />
tension, the material behind the peg (or relish) can be broken away from the tenon (see<br />
Figure 3-8). This type of failure is different than the splitting failure seen in steel bolted<br />
connections. In a splitting failure, the wood directly behind the bolt splits and the bolt slides<br />
through the gap created (see Figure 3-9). Also, the splitting-type failure of the tenon is not<br />
typical in mortise and tenon connections since the tenon is usually restrained tightly in the<br />
mortise.<br />
700<br />
653 lb<br />
600<br />
500<br />
511 lb<br />
Load (lb)<br />
400<br />
300<br />
200<br />
0.05 D<br />
100<br />
0<br />
0.00 0.20 0.40 0.60 0.80<br />
Deflection (in)<br />
Figure 3-6 Typical Load Deflection Curve (Bending Test, ¾” Dia. Red Oak Peg)<br />
19
Figure 3-7 Combined<br />
Shear - Bending Failure<br />
Figure 3-8 Relish Failure<br />
The last failure mode observed in mortise and tenon connections pertains to the<br />
splitting of the material around the mortise. As the connection is loaded in tension, two<br />
things occur. First, the mortise material is loaded in direct tension, perpendicular to the<br />
grain, and secondly, the bending in the peg causes the sides of the mortise to spread out and<br />
finally split apart (see Figure 3-10). A method to quantify the strength of the material<br />
surrounding the mortise is left for future research. This will be a difficult matter since the<br />
material on all sides of the mortise provides constraint to the joint. This additional material<br />
helps to keep the sides of the mortise from spreading outward and provides additional<br />
Figure 3-9 Tenon Splitting Failure<br />
Figure 3-10 Mortise<br />
Splitting Failure<br />
20
material needed in direct tension.<br />
21
3.5 Additional Yield Model Equations<br />
A comprehensive mortise and tenon yield model will need to include the existing<br />
four NDS yield modes for double shear and the three additional yield modes, specific to<br />
mortise and tenon connections. The existing NDS modes are based on peg bearing and<br />
bending, and the proposed yield modes will account for combined shear and bending, relish<br />
failure, and mortise splitting.<br />
The first proposed yield mode will be known as Mode V, for purposes of discussion,<br />
and takes into account the effect of the combined bending and shear behavior of the<br />
connection (Fig. 3-7). The double shear strength for n pegs is the following:<br />
P =2nF ⊥<br />
A<br />
(3-32)<br />
V<br />
v<br />
Where F v ⊥ is the vertical shear strength of the wood peg and A is the cross-sectional<br />
area of the peg. This equation takes into account the combined bending and shear effects by<br />
using an allowable shear strength that is determined by testing as shall be described in the<br />
next section.<br />
The relish failure mode shall be known as Mode VI (Fig. 3-8) and is related to the<br />
distance from the center of the peg to the end of the tenon (l v ), the tenon thickness (t m ), peg<br />
diameter (D), and the horizontal shear strength of the tenon (F vm ).<br />
P =2 ⎛ D<br />
VI<br />
nFvmtm l - ⎞<br />
⎜ v ⎟ (3-33)<br />
⎝ 2 ⎠<br />
In the case of the mortise material splitting, known as Mode VII (Fig. 3-10), no<br />
specific test or numerical model has been devised to quantify the strength of the material<br />
around the mortise. Therefore, minimum edge distances, such as those required by the<br />
NDS, shall be developed to ensure that this failure mode does not control.<br />
22
For softwood members the NDS requires that a distance of 7D be provided from<br />
the center of the bolt to the end of the tension member (l v ) and that a distance of 4D be<br />
provided from the edge of the mortise to the center of the bolt (l e ) (where D is the diameter<br />
of the steel bolt).<br />
Since these requirements are based on connections tests with steel bolts, a wood peg<br />
used in the same application would have a much larger diameter than a steel bolt. It does<br />
not seem reasonable to assume that for a given load, a much larger end distance is required<br />
for a wood peg than a steel bolt, just because the diameter needs to be greater. Therefore,<br />
relationships must be drawn between the required wood peg diameter and an equivalent steel<br />
bolt diameter. End distances and perhaps edge distances would then be determined by using<br />
the equivalent steel bolt diameter.<br />
To determine the size of a wood peg or pegs needed in a connection, one would<br />
Figure 3-11 Standard Connection Geometry<br />
23
need to know the required load and available materials and then use the yield mode<br />
equations to size the connection (see Figure 3-11). Assuming that a state of double shear<br />
exists, the yield modes are as follows: (Note: The factors of safety have been removed to<br />
obtain yield loads.)<br />
P<br />
P<br />
= nDt F<br />
(3-34)<br />
Im m em<br />
= 2 nDt F<br />
(3-35)<br />
Is s es<br />
P<br />
IIIs<br />
2nk 3Dt sF<br />
=<br />
( 2 + R )<br />
e<br />
em<br />
(3-36)<br />
P<br />
IV<br />
= 2nD<br />
2<br />
2F<br />
em<br />
F<br />
yb<br />
( + R )<br />
31<br />
e<br />
(3-37)<br />
P<br />
V<br />
= 2nF<br />
v⊥<br />
2<br />
⎛ D ⎞<br />
⎜π ⎟<br />
(3-38)<br />
⎝ 4 ⎠<br />
⎛<br />
PVI = 2nFvmtm ⎜lv<br />
−<br />
⎝<br />
D⎞<br />
⎟<br />
2 ⎠<br />
(3-39)<br />
where:<br />
k<br />
3<br />
=− 1 +<br />
21 ( + R F R D<br />
e<br />
) 2<br />
yb<br />
( 2+<br />
e<br />
)<br />
+<br />
2<br />
R 3F t<br />
e<br />
em s<br />
2<br />
(3-40)<br />
Note that R e is the ratio of the wood peg dowel bearing stresses (F em /F es ) in the main<br />
and side member, respectively, and F yb is the bending yield stress for the wood peg. F v ⊥ and<br />
F vm are the shear yield stresses in the wood peg and main member, respectively.<br />
Once the loads are determined for each mode, the lowest load (P) is used as the yield<br />
load for the entire connection. This yield load is then used to solve for equivalent bolt<br />
diameters for each mode. Solving for D in each mode equation:<br />
24
D<br />
D<br />
Im<br />
Is<br />
P<br />
= (3-41)<br />
t F<br />
m<br />
em<br />
P<br />
= (3-42)<br />
2 tF<br />
s<br />
es<br />
2<br />
3<br />
D IIIs<br />
= positive root of following equation: (3-43)<br />
( + R )<br />
⎛ 21<br />
Fyb ( 2 + Re ) FemD<br />
+<br />
⎜<br />
⎝ R<br />
⎞<br />
2<br />
P<br />
1 P<br />
2<br />
− 1 ⎟ ts Fem D + ( 2+ Re) tsFemD− ⎛ ( 2 Re)<br />
0<br />
⎠<br />
n<br />
4 ⎝ ⎜ ⎞<br />
⎟ + =<br />
n ⎠<br />
4 e<br />
2 2 2<br />
e<br />
D<br />
IV<br />
=<br />
P<br />
2n<br />
( + R )<br />
31<br />
2F F<br />
em<br />
e<br />
yb<br />
(3-44)<br />
D<br />
V<br />
=<br />
2P<br />
nπF t<br />
v⊥<br />
m<br />
(3-45)<br />
Where R e is now the ratio of the dowel bearing stresses (F em /F es ), for the bolted<br />
connection and F yb and F v are the bolt bending and yield stresses, respectively. Mode VI has<br />
been excluded from this analysis for bolt diameter because the shear yield stress in the main<br />
member will not change between a wood peg and a steel bolt, and the bolt diameter will only<br />
increase due to the end distance. For instance, if a connection is sized based on the shear in<br />
the peg, then the end distance is not a concern. When an equivalent steel bolt is determined<br />
using this mode, it will be much larger than the wood peg, due to the fact that less end<br />
distance is needed to balance out the load.<br />
From these equations, the largest diameter (D) is used as the equivalent bolt<br />
diameter. The following example (Figure 3-12) shows how a wood connection, with a yield<br />
load of 5,184 lb using two 1” Red Oak pegs, can carry an equivalent load using a 0.53”<br />
diameter steel bolt.<br />
25
Using the equivalent bolt diameter, the end distance can be determined from the<br />
NDS requirements. The end distance requirement of 7D, suggests that for a bolt that is<br />
0.53” in diameter, an end distance of 3.71” is needed. For the equivalent 1” Red Oak peg,<br />
the same end distance of 3.71” should be adequate to develop the full load of the<br />
connection.<br />
There is also the possibility that another yield mode, similar to Mode III s is needed.<br />
In failed mortise and tenon connections, a common failure mode is one that contains a<br />
Connection Geometry<br />
D = 1.00 in (25 mm) t m = 2.00 in (51 mm)<br />
n = 2 t s = 1.75 in (44 mm)<br />
l v = 3.00 in (76 mm)<br />
Wood Peg Properties<br />
Steel Bolt Properties<br />
F yb = 12,600 psi (86.9 MPa) F yb = 45,000 psi (310.3 MPa)<br />
F v ⊥ = 1,650 psi (11.4 MPa) F v ⊥ = 27,000 psi (186.2 MPa)<br />
F em = 1,547 psi (10.7 MPa) F em = 4,050 psi (27.9 MPa)<br />
F es = 930 psi (6.4 MPa) F es = 1,950 psi (13.4 MPa)<br />
F vm = 280 psi (1.9 MPa) F vm = 280 psi (1.9 MPa)<br />
Based on Red Oak Pegs and<br />
Eastern White Pine Mortise and Tenon<br />
Load Analysis<br />
Equivalent Steel Bolt Analysis<br />
P Im = 6,188 lb (27.53 kN) D Im = 0.32 in (8 mm)<br />
P Is = 6,510 lb (28.96 kN) D Is = 0.38 in (10 mm)<br />
P IIIs = 6,249 lb (27.80 kN) D IIIs = 0.53 in (14 mm)<br />
P IV = 8,835 lb (39.30 kN) D IV = 0.45 in (12 mm)<br />
P V = 5,184 lb (23.06 kN) D V = 0.17 in (4 mm)<br />
P VI = 6,720 lb (29.89 kN)<br />
P = 5,184 lb (23.06 kN) D = 0.53 in (14 mm)<br />
Figure 3-12 Equivalent Bolt Diameter Example<br />
26
single hinge in the peg, at the center of the tenon. In Mode III s the ends of the peg rotate<br />
through the side material and two hinges form, but this mode does not allow those two<br />
hinges to form at the same location (thus actually being one hinge) (see Figure 3-13).<br />
Mode III s is based on a single shear condition, where one end of the peg is held<br />
securely in the material of the main member. As the connection is loaded, the peg rotates<br />
through the side material and a hinge forms in the peg (see Figure 3-14).<br />
A mathematical model that properly reflects the strength of the peg and the<br />
surrounding material is necessary for Mode III s ’.<br />
Figure 3-13 Proposed Mode III s '<br />
Figure 3-14 Mode III s (Single<br />
Shear)<br />
27
4. Peg Testing Procedures and Analysis<br />
4.1 General Testing Procedures for Hardwood Pegs<br />
This section introduces the tests performed by this researcher and the procedures<br />
followed for all tests. Testing procedures that are unique to the specific type of test are<br />
discussed in the section for that individual test. The tests performed were dowel bending<br />
tests, dowel bearing tests, dowel shear tests, and full-sized tests.<br />
The yield models require material properties specific to hardwood pegs. These<br />
properties include the bending strength of the pegs, the dowel bearing strength of the pegs<br />
in the main and side members, and the combined shear and bending strength of the pegs.<br />
Whenever possible, ASTM test procedures were followed.<br />
The primary species selected for peg testing were Red Oak and White Oak, with<br />
some additional testing of Locust, Birch, Maple, and Ash. The pegs were in diameters of<br />
¾”, 1” and 1¼” and ranged in length from 8” to 12”. For the dowel bearing tests, the base<br />
materials were Douglas Fir, Red Oak, and Eastern White Pine. The samples were cut from<br />
8x8 timbers roughly 4 feet in length.<br />
The pegs and base materials arrived approximately one year before this writing from<br />
various locations around the United States. They were placed in an environmental chamber,<br />
as per the ASTM standard D4933-91 for Moisture Conditioning of Wood and Wood-Base<br />
Materials, and kept at or near a temperature of 70° F and 65% relative humidity until they<br />
were needed for testing (ASTM, 1995a). The purpose for this was to condition the wood at<br />
a constant moisture content of 12%. Even though constancy would have been ideal, some<br />
fluctuations did occur due to seasonal effects and some mechanical breakdowns. The<br />
moisture content was determined for each test sample as required by ASTM D4442-92<br />
(ASTM, 1995a).<br />
28
The pegs for each test were selected randomly from the limited supply. Occasionally<br />
it was necessary to discard pegs from the supply due to serious defects such as severe splits<br />
or extreme wane. It was judged that these would not have been used in stress-critical<br />
applications during construction.<br />
For the dowel bearing tests, the samples which had severe splits or knots were<br />
discarded since they would affect the yield strength of such small samples.<br />
The samples used for the dowel bearing tests came from a limited number of large<br />
timbers. Therefore, the population variety is not what would be desired, but the confidence<br />
levels help to adjust for this in the 5% exclusion values.<br />
For all tests, it was important to note the orientation of the grain, to determine if the<br />
strength was dependent on this orientation. For example, the pegs were loaded in the radial<br />
and tangential directions, where radial means coming out from the center of the tree or<br />
perpendicular to the growth rings, and tangential being parallel to the growth rings.<br />
Test data included the diameter of the pegs for two orientations (e.g. radial and<br />
tangential) at the middle and both ends of the peg, the specific gravity of the material, the<br />
slope of the grain, and the number of rings per inch. For the dowel bearing tests, the<br />
specific gravity, the moisture content, and the number of rings per inch for the base material<br />
were also determined. Any defects in the materials such as knots or splits were noted.<br />
For all precise measurements such as peg diameters or specific gravity sample<br />
measurements, calipers that were capable of measurements accurate to 1/128 th of an inch<br />
were used.<br />
In all tests, the yield point was determined by a 5% offset method per ASTM D5652<br />
(ASTM, 1995a). In this method, a plot is made of the load versus deflection for the test.<br />
Then, using the slope of the initial portion of the curve, a parallel line is offset by 5% of the<br />
29
dowel diameter and the intercept of that offset line with the load-deflection curve is defined<br />
as the yield value for the test. A typical load-deflection curve for a peg in bending is shown<br />
in Figure 4-1. The two points chosen to define the initial slope are highlighted and the yield<br />
load is indicated as 511 lb.<br />
Note that if the ultimate load for the test occurs before the intercept point, the<br />
ultimate load is used as the yield point.<br />
700<br />
653 lb<br />
600<br />
500<br />
511 lb<br />
Load (lb)<br />
400<br />
300<br />
200<br />
0.05 D<br />
100<br />
0<br />
0.00 0.20 0.40 0.60 0.80<br />
Deflection (in)<br />
Figure 4-1 Typical Load Deflection Curve (Bending Test, ¾” Dia. Red Oak Peg)<br />
4.2 Bending Test Procedure<br />
The test procedure used to determine the bending strength of the peg was based on<br />
ASTM D198-94 (ASTM, 1995a). Due to the limited length of the pegs, the shear span to<br />
diameter ratio (a/D) ranged from 4.2 to 3.1, though ASTM D198-94 recommends a<br />
30
minimum value of 5 to ensure a flexural failure (see Figure 4-2). Nevertheless, all pegs broke<br />
with typical flexural failures within the constant-moment portion of the span.<br />
Red Oak and White Oak pegs in ¾”, 1” and 1¼” diameters were tested. Also tested<br />
were Locust, Ash, Maple, and Birch pegs of various diameters.<br />
The majority of the bending tests were done in previous research (Schmidt et al.,<br />
1996). Although similar methods were used by both persons, it was decided later that<br />
additional information should be gathered about the pegs, including the number of growth<br />
rings per inch and the slope of the grain.<br />
The testing was accomplished with an Instron model 1332 testing machine and a<br />
Strawberry Tree data acquisition system. The pegs were supported on saddles that provided<br />
a span of 9” and loaded through additional saddles spaced 2.75” apart (see Figure 4-2).<br />
The pegs were loaded at a stroke rate of 0.05” per minute. This loading rate caused<br />
the pegs to reach their ultimate load in about ten minutes as suggested by ASTM D143-94<br />
(ASTM, 1995a).<br />
A typical bending test was conducted in the following manner: A peg was removed<br />
from the environmental chamber and labeled for identification. Diameter measurements<br />
Figure 4-2 Bending Test Setup<br />
31
were taken for two orientations (e.g. tangential and radial) at both ends and in the middle of<br />
the peg. The slope of the grain in the peg was measured with a protractor. Any defects in<br />
the peg were noted. The number of rings per inch was counted at one end of the peg. The<br />
peg was placed on the test machine in the support saddles and at the proper orientation<br />
(tangential or radial). Then a machined alignment guide was placed next to the peg and the<br />
upper load saddles were set in place. The alignment guide was removed and the loading<br />
head, with load spreader was then lowered into place so that it would barely touch the load<br />
saddles. The data acquisition program was started and the loading began.<br />
After the load reached a maximum value, the data acquisition program and test<br />
machine were stopped and the characteristics of flexural failure were noted. The peg was<br />
then removed and a sample, three inches in length, was cut out of the peg, measured,<br />
weighed, and placed in an oven at 212° F for more than 24 hours. The oven-dry peg was<br />
removed and weighed again.<br />
The data file obtained from the test was used to create a load versus deflection chart.<br />
The 5% offset method was used to determine the yield load, and the average diameter was<br />
used to calculate the bending yield stress F yb .<br />
4.3 Shear Test Procedure<br />
For the shear tests, geometric data was measured on the pegs in the same way as was<br />
done for the bending tests. The testing apparatus and procedure were different.<br />
A test fixture was devised to study the combined bending and shear behavior of the<br />
pegs. This fixture was used to hold the peg securely and test the peg in shear using varying<br />
spans (see Figure 4-3). The shear span is the distance between the faces of the outside<br />
reaction block and the middle load block. The purpose of this test fixture is to model the<br />
32
Figure 4-3 Shear Test Fixture<br />
restraint within the mortise and tenon connection and to determine relationships between<br />
the shear span and the shear capacity of the peg.<br />
When actual mortise and tenon connections are loaded to failure, the observed shear<br />
spans have been in the range of 1D or less (where D is the peg diameter). These shear spans<br />
were observed by removing the peg from the failed connection and measuring the length of<br />
the region with fibers disturbed by bending. Hence, it is necessary to understand how the<br />
shear spans affect the strength of the peg.<br />
The pegs were tested using shear spans of 1/4D, 1/2D and 1D. The load rate for<br />
the shear tests was 0.024 inches per minute in order to conform to ASTM D143-94 (ASTM,<br />
1995a). This load produced a test duration between six and ten minutes in all but a few<br />
cases. In these cases, the ultimate load was reached in just under six minutes and was<br />
probably due to abnormally weak pegs.<br />
4.4 Dowel Bearing Test Procedure<br />
The dowel bearing tests determine the compressive strength of the material<br />
surrounding the dowel. For a wood peg the dowel bearing yield strength of the material is<br />
33
affected by the deformation in the peg as well as in the base material. It is important to test<br />
the dowel bearing strengths with pegs of different materials and at different orientations<br />
relative to the base material.<br />
This test was based on ASTM D5652-95 (ASTM, 1995b) which stated that the<br />
maximum load should be achieved in approximately ten minutes, but in no less time than<br />
five minutes.<br />
The base material testing blocks were cut from the 8x8 timbers using a chainsaw and<br />
an industrial bandsaw. The minimum dimensions for each block were 4D x 4D x 2D. Two<br />
of the blocks were then clamped together (end-to-end) and a hand-powered brace and auger<br />
bit were used to drill a hole to create a half-round hole or trough in the edge of each sample<br />
(see Figure 4-4). Note, in this figure the peg is loaded in the tangential orientation.<br />
Similar data were taken for the dowel bearing tests as for previously described tests.<br />
Pegs were measured in the same way that they were measured for bending and shear tests.<br />
The base material was measured for its trough length and the number of rings per inch.<br />
When each test was completed, a 3” sample was removed from the peg and a 2”x2”x1”<br />
Figure 4-4 Standard Dowel<br />
Bearing Test<br />
34
sample was removed from the base material. These were measured using calipers, weighed,<br />
and placed in an oven. After more than 24 hours, the samples were removed and weighed<br />
again to obtain the moisture content and the specific gravity.<br />
The test fixture held an oak peg securely to a steel base plate so that the base material<br />
could be placed on the peg, under the loading head (see Figure 4-5). The load rate for the<br />
dowel bearing tests was 0.02” per minute.<br />
Preliminary tests were performed in previous research (Schmidt et al., 1996) using<br />
White Oak pegs and Douglas Fir base material. The peg diameters were ¾”, 1” and 1¼”,<br />
with 18 1” pegs tested and six each of the ¾” and 1¼” pegs. The pegs were tested in the<br />
radial and tangential orientations. The blocks were tested in a variety of orientations. These<br />
orientations are labeled RL, LR, LT, and TR (see Figure 4-6). The two characters refer to<br />
the direction the load is applied and the orientation of the peg. For instance, the LT block<br />
orientation has the load applied in the longitudinal direction of the block with the axis of the<br />
peg parallel to the tangential axis of the block (see Figure 4-5 and Figure 4-6).<br />
Figure 4-5 Dowel Bearing Test Fixture<br />
35
Figure 4-6 Orientation of Preliminary Test Blocks (RL, LR, LT, and TR)<br />
Additional tests were conducted as part of this research using Red Oak pegs in base<br />
materials of Eastern White Pine, and Recycled Douglas Fir. To simplify the testing<br />
procedures, only 1” pegs were tested and only two orientations of base material were used.<br />
The selection of these orientations was based on the orientation of the wood in large mortise<br />
and tenon connections. The two orientations for the base materials are RT and LT (see<br />
Figure 4-7 and Figure 4-8). Note that for both diagrams the peg is shown loaded in the<br />
radial direction.<br />
When the connection is loaded in tension, the fibers around the mortise are loaded<br />
perpendicular to the grain and the tenon fibers are loaded parallel to the grain. The RT<br />
orientation represents bearing of the peg in the mortise material where the load is applied<br />
perpendicular to the grain in the mortise. The LT orientation represents peg bearing in the<br />
Figure 4-7 RT Block Orientation<br />
Figure 4-8 LT Block Orientation<br />
36
tenon material where the load is applied parallel to the grain in the tenon. <strong>Tension</strong> loading<br />
of the mortise and tenon joint is assumed. These orientations were chosen based on the<br />
typical grain patterns in the mortise and tenon (see Figure 4-9).<br />
The results of the tests give dowel bearing strengths for a variety of base materials in<br />
the perpendicular and parallel directions. These dowel bearing strengths can then be used<br />
directly in the yield model equations.<br />
Figure 4-9 Mortise and Tenon Grain Patterns<br />
4.5 Full-size Joint Test Procedures<br />
Full-size joints were tested using a steel test frame (see Figure 4-10), an Enerpac<br />
RCH 123 hydraulic ram, hand-operated hydraulic pump, and Labview data acquisition<br />
software. A pressure transducer was used to acquire hydraulic pressure data and two linear<br />
potentiometers were used to average the deflection between the mortise and tenon members<br />
at the joint.<br />
37
The main purpose of the full-size tests was to determine a shear yield criteria. To do<br />
this, the connection needed to fail in the peg. The resulting yield stress in the pegs was<br />
compared to the yield stresses obtained from the shear tests to obtain an approximate shear<br />
span in the full-size connections. A secondary purpose of the full-size tests was to establish<br />
minimum end and edge distances in the tenon and mortise material, respectively.<br />
The construction of the joints was simplified by using 2x6 Douglas Fir dimension<br />
lumber (see Figure 4-11 and Figure 4-11). One 2x6 was used for the tenon, and two 2x6’s<br />
were used to represent the mortised member, with all pieces coming from the same 12’-2x6<br />
member. Six full-size joints were tested and a variety of peg configurations were used.<br />
Members that contained the pith were avoided.<br />
Figure 4-10 Full-size Joint Test Apparatus<br />
Figure 4-11 Full-size Test<br />
Specimen<br />
38
To keep the stroke rate constant during testing, a chart was displayed on the<br />
computer which compared the actual rate of deflection to an ideal rate. It was then up to the<br />
operator to keep the rate of deflection the same as the ideal rate. The stroke rate of the<br />
piston was approximately 0.02” per minute. This caused the connection to yield in under ten<br />
minutes.<br />
After each test was complete, the joint was taken apart by carefully pulling the<br />
members apart or by splitting the wood of the tenon and mortise. The peg and holes were<br />
then inspected to determine the cause of failure.<br />
To induce shear failures to occur in the pegs, ¾” Red Oak pegs were used and the<br />
end and edge distances were adjusted until other failures no longer occurred.<br />
39
5. Test Results<br />
5.1 Introduction<br />
The following sections contain the results of the experimental tests. The factors that<br />
affect the material properties are also explained. For almost every load type tested, the<br />
specific gravity or density of the material affected the yield strength. As the specific gravity<br />
increased, the material’s yield strength increased.<br />
The mean yield strength for each series of tests is presented along with other<br />
statistical data, such as the standard deviation and the 5% exclusion value. The 5% exclusion<br />
value is the strength that 95% of the tests can exceed. Therefore, only 5% of the tests will<br />
have strength values lower than this number. This assumes a normal distribution and a 75%<br />
confidence level (see Figure 5-1). The 5% exclusion values were calculated using ASTM<br />
D2915-94 (ASTM, 1995b) and were determined as F .05 = F - Kσ, where F is the mean<br />
value, σ is the standard deviation, and K is a factor that accounts for the confidence level, the<br />
number of tests, and the percent exclusion.<br />
0.20<br />
Mean<br />
0.15<br />
0.10<br />
5% Exclusion<br />
Value<br />
K σ<br />
0.05<br />
0.00<br />
500 1000 1500 2000 2500<br />
Yield Stress (psi.)<br />
Figure 5-1 Normal Distribution<br />
40
The mean and 5% exclusion values are important to the designer. The mean values<br />
can be used to understand at what load the average connection should actually fail, however,<br />
the 5% exclusion values are used as a safe limit of yield stress for limit states design. The 5%<br />
exclusion values are later modified with factors of safety to result in values useful for<br />
allowable stress design.<br />
5.2 Bending Test Results<br />
The major factor affecting the bending strength of hardwood pegs is the specific<br />
gravity of the material. As the peg increases in density, the bending strength tends to<br />
increase.<br />
A correlation function was used to analyze the data to determine how the specific<br />
gravity and the moisture content in the pegs affected the yield strength (see Table 5-1). This<br />
correlation function shows when a relationship exists between two sets of data. For<br />
instance, a positive correlation coefficient shows that as one set of data increases, the other<br />
set of data tends to increase. A negative correlation coefficient would mean that as one set<br />
of data increases, the other set decreases. This correlation function is linear and it ranges<br />
from 1.0 to -1.0, with 1.0 being a perfect linear correlation of the data.<br />
The results shown in Table 5-1 summarize all of the bending tests that had specific<br />
gravity and moisture content data. A total of 136 bending tests were accomplished by two<br />
researchers, of which 75 had specific gravity and moisture content information. This<br />
information is missing from the other tests because they were from an earlier series of tests,<br />
used for preliminary strength information. As in the case of the 1” Red and White Oak<br />
bending tests, only two tests in each set had specific gravity and moisture content data. That<br />
is why a perfect linear correlation coefficient exists for these tests. For the clear majority of<br />
the tests, a significant positive correlation coefficient exists between the yield stress and the<br />
41
Table 5-1 Bending Test Correlation Coefficients<br />
specific gravity. This shows that as the specific gravity increases, the yield strength tends to<br />
increase. Due to the variability of the correlation coefficients for the moisture content, no<br />
clear relationship can be determined for how the moisture content affects the yield strength<br />
of the pegs.<br />
Material Dia. Yield Stress vs. Yield Stress vs.<br />
Specific Gravity Moisture Content<br />
Red Oak 3/4" 0.912 -0.755<br />
Red Oak 1" 1.000 1.000<br />
Red Oak 1-1/4" 0.549 -0.113<br />
White Oak 3/4" -0.158 0.538<br />
White Oak 1" 1.000 1.000<br />
White Oak 1-1/4" 0.439 -0.625<br />
Locust 3/4" 0.811 0.475<br />
Locust 1" 0.983 -0.998<br />
Ash 3/4" 0.374 0.049<br />
Ash 1" 0.725 0.939<br />
Maple 3/4" -0.107 -0.731<br />
Birch 1" 0.013 -0.220<br />
Twenty bending tests were conducted by this researcher on ¾” diameter pegs from<br />
four different materials. The materials were Red Oak, White Oak, Maple and Ash. For<br />
these pegs, the number of rings per inch and the slope of the grain were noted. As can be<br />
seen from the correlation data in Table 5-2 a correlation does exist between the moisture<br />
content and the bending yield strength. As the moisture content decreases, the yield strength<br />
increases. No clear correlation can be determined between the slope of the grain and the<br />
yield strength from the correlation data, however, sloping grain will cause early yielding when<br />
Table 5-2 Additional Correlation Coefficients<br />
Material Yield Stress vs. Yield Stress vs.<br />
Rings per Inch Slope of Grain<br />
Red Oak -0.370 -0.750<br />
White Oak -0.939 0.038<br />
Maple -0.697 -0.296<br />
Ash -0.466 -0.165<br />
42
the peg is loaded in the radial direction. In this orientation, the peg is allowed to split along<br />
the growth rings.<br />
A negative correlation did exist between the peg diameter and the average yield<br />
strength of the Red Oak and White Oak pegs as can be seen in Table 5-3. This shows that<br />
as the peg diameter increased, the bending strength tended to decrease.<br />
The bending yield strength results in Table 5-4 are separated into groups based on<br />
the material, the peg diameter and the peg orientation. These results show that for Red Oak<br />
and White Oak, the bending strength is typically higher in the radial direction. The data also<br />
shows that in order of decreasing strength, the materials are as follows: Maple, Locust, Birch,<br />
Ash, Red Oak, and White Oak.<br />
In Table 5-5, the bending yield strengths are summarized for each material and peg<br />
diameter, and the 5% exclusion values are shown for the material and diameter.<br />
The data shows, in many cases, a wide discrepancy between the average yield stress<br />
and the 5% exclusion value. This is usually because the standard deviation is high and/or<br />
the number of tests conducted is low. Data for individual pegs can be found in the<br />
appendix.<br />
A possible way to ensure quality pegs would be to create a standard to limit the<br />
specific gravity of the wood used in pegs (see Figure 5-2). This figure shows how the<br />
specific gravity for the ¾” Red Oak pegs affects the bending yield strength. Such a standard<br />
was developed by M.H. Kessel (Peavy and Schmidt, 1996). Kessel recommends a minimum<br />
Table 5-3 Correlation Between Peg Dia. and Bending Strength<br />
Correlation<br />
Red Oak -0.748<br />
White Oak -0.117<br />
43
Table 5-4 Bending Yield Strength Results<br />
Material Peg Orient- No. of Avg. Yield Standard COV<br />
Dia. ation Tests Stress Deviation<br />
(psi.) (psi.)<br />
Red Oak 3/4" R 10 18,921 2,941 0.16<br />
T 8 15,193 4,872 0.32<br />
Red Oak 1" R 5 12,127 1,347 0.11<br />
T 5 13,074 2,362 0.18<br />
Red Oak 1-1/4" R 5 15,062 2,184 0.14<br />
T 4 11,750 1,538 0.13<br />
Red Oak Combined 37 15,110 3,928 0.26<br />
White Oak 3/4" R 8 14,130 4,379 0.31<br />
T 9 13,639 3,932 0.29<br />
White Oak 1" R 5 12,929 3,614 0.28<br />
T 5 12,295 1,360 0.11<br />
White Oak 1-1/4" R 5 14,585 2,319 0.16<br />
T 6 12,981 1,696 0.13<br />
Wht. Oak Combined 38 13,493 3,176 0.24<br />
Locust 3/4" R 1 16,997 N/A N/A<br />
T 2 21,247 733 0.03<br />
Locust 1" R 2 21,079 774 0.04<br />
T 2 27,098 503 0.02<br />
Locust Combined 7 22,263 3,668 0.16<br />
Ash 3/4" R 5 16,668 2,978 0.18<br />
T 4 18,455 1,605 0.09<br />
Ash 1" R 2 20,804 5,173 0.25<br />
T 2 17,241 159 0.01<br />
Ash Combined 13 17,942 2,836 0.16<br />
Maple 3/4" R 4 25,157 6,845 0.27<br />
T 5 27,097 9,586 0.35<br />
Maple Combined 9 26,235 8,035 0.31<br />
Birch 1" R 2 18,170 960 0.05<br />
T 2 18,221 392 0.02<br />
Birch Combined 4 18,196 600 0.03<br />
WO Octag 3/4" R 5 12,698 1,923 0.15<br />
T 5 13,966 2,986 0.21<br />
WO Octag 1" R 5 19,608 1,664 0.08<br />
T 5 19,607 605 0.03<br />
WO Octag Combined 20 16,470 3,727 0.23<br />
specific gravity of G=0.57 for pegs in critical connections. (A specific gravity of 0.57<br />
corresponds to a unit weight of about 36 pcf).<br />
44
Table 5-5 Combined Bending Results<br />
Material Peg Avg. Yield Standard 5% Exclusion<br />
Dia. Stress Deviation Value<br />
(psi.) (psi.) (psi.)<br />
Red Oak 3/4" 17,264 4,241 8,986<br />
Red Oak 1" 12,601 1,881 8,644<br />
Red Oak 1-1/4" 13,590 2,514 8,205<br />
Red Oak Combined 15,110 3,928 7,871<br />
White Oak 3/4" 13,870 4,023 5,969<br />
White Oak 1" 12,612 2,596 7,151<br />
White Oak 1-1/4" 13,710 2,071 9,414<br />
Wht. Oak Combined 13,493 3,176 7,649<br />
Locust 3/4" 19,830 2,507 11,927<br />
Locust 1" 24,088 3,515 14,663<br />
Locust Combined 22,263 3,668 14,006<br />
Ash 3/4" 17,463 2,507 12,092<br />
Ash 1" 19,022 3,628 9,296<br />
Ash Combined 17,942 2,836 12,716<br />
Maple 3/4" 26,235 8,035 9,025<br />
Birch 1" 18,196 600 16,588<br />
WO Octag 3/4" 13,332 2,460 8,156<br />
WO Octag 1" 19,608 1,181 17,124<br />
WO Octag Combined 16,470 3,727 9,269<br />
26,000<br />
24,000<br />
Yield Stress (psi.)<br />
22,000<br />
20,000<br />
18,000<br />
16,000<br />
14,000<br />
12,000<br />
10,000<br />
0.50 0.55 0.60 0.65 0.70<br />
Specific Gravity<br />
Figure 5-2 Relationship Between Specific Gravity and Bending<br />
Yield Stress<br />
45
5.3 Shear Test Results<br />
181 shear tests were conducted for this project, using Red Oak and White Oak pegs<br />
of ¾”, 1”, and 1¼” diameters at shear spans of 1/4D, 1/2D, and 1D. For each of the pegs,<br />
data was gathered for specific gravity, moisture content, the number of rings per inch, and<br />
the slope of the grain.<br />
The major factor affecting the shear yield stress at a given shear span is the specific<br />
gravity of the peg. This can be seen in the correlation data from all of the series of tests (see<br />
Table 5-6). Also, there is a minor relationship between the moisture content in the pegs and<br />
the shear yield strengths as can be seen by the typically negative correlation coefficients.<br />
This means that as the moisture content decreases, the yield strength tends to increase.<br />
Primarily for Red Oak, and to a lesser extent for White Oak, the number of rings per<br />
inch also seemed to be correlated to the shear yield strength of the pegs. This could be<br />
caused by a change in specific gravity as the number of growth rings per inch changed. To<br />
verify this assumption, plots were made to compare the specific gravity and the number of<br />
rings per inch, using data from all tests (bending, bearing, and shear). The plots included data<br />
from the Red Oak pegs tested (129) and all the White Oak pegs tested (89) that had data for<br />
specific gravity and growth rings per inch (see Figure 5-3 and Figure 5-4). As the growth<br />
rings got closer together, the specific gravity tended to decrease.<br />
46
Table 5-6 Correlation Data for Shear Tests<br />
3/4" Red Oak Pegs Correlation<br />
1/4D 1/2D 1D<br />
Yield Stress vs. Specific Gravity 0.903 0.864 0.866<br />
Yield Stress vs. Moisture Content 0.153 0.014 0.545<br />
Yield Stress vs. Rings per Inch -0.623 -0.255 -0.448<br />
Yield Stress vs. Grain Slope -0.273 0.206 -0.388<br />
1" Red Oak Pegs Correlation<br />
1/4D 1/2D 1D<br />
Yield Stress vs. Specific Gravity 0.706 0.685 0.964<br />
Yield Stress vs. Moisture Content 0.102 0.449 -0.449<br />
Yield Stress vs. Rings per Inch -0.760 -0.106 -0.505<br />
Yield Stress vs. Grain Slope -0.373 0.146 0.111<br />
1 1/4" Red Oak Pegs Correlation<br />
1/4D 1/2D 1D<br />
Yield Stress vs. Specific Gravity 0.878 0.482 0.589<br />
Yield Stress vs. Moisture Content 0.044 -0.399 -0.109<br />
Yield Stress vs. Rings per Inch -0.585 -0.384 -0.633<br />
Yield Stress vs. Grain Slope -0.235 0.179 -0.163<br />
3/4" White Oak Pegs Correlation<br />
1/4D 1/2D 1D<br />
Yield Stress vs. Specific Gravity 0.516 0.672 0.722<br />
Yield Stress vs. Moisture Content 0.346 -0.324 -0.455<br />
Yield Stress vs. Rings per Inch -0.278 -0.349 0.124<br />
Yield Stress vs. Grain Slope 0.065 0.526 -0.399<br />
1" White Oak Pegs Correlation<br />
1/4D 1/2D 1D<br />
Yield Stress vs. Specific Gravity 0.797 0.208 0.856<br />
Yield Stress vs. Moisture Content 0.630 -0.303 0.458<br />
Yield Stress vs. Rings per Inch -0.115 -0.132 -0.487<br />
Yield Stress vs. Grain Slope 0.070 0.296 -0.181<br />
1 1/4" White Oak Pegs Correlation<br />
1/4D 1/2D 1D<br />
Yield Stress vs. Specific Gravity 0.784 0.919 0.626<br />
Yield Stress vs. Moisture Content -0.306 -0.370 -0.012<br />
Yield Stress vs. Rings per Inch 0.010 -0.352 -0.071<br />
Yield Stress vs. Grain Slope -0.118 0.242 -0.083<br />
47
0.90<br />
0.90<br />
Specific Gravity<br />
0.80<br />
0.70<br />
0.60<br />
0.50<br />
Specific Gravity<br />
0.80<br />
0.70<br />
0.60<br />
0.50<br />
0.40<br />
0.0 10.0 20.0 30.0<br />
Growth Rings per Inch<br />
0.40<br />
0.0 10.0 20.0 30.0<br />
Growth Rings per Inch<br />
Figure 5-3 Red Oak Growth Rings vs.<br />
Specific Gravity<br />
Figure 5-4 White Oak Growth Rings vs.<br />
Specific Gravity<br />
A negative correlation did exist between the peg diameter and the yield strength as<br />
can be seen in Table 5-7. This shows that as the peg diameter increased, the average yield<br />
strengths tended to decrease.<br />
The average shear capacity of the peg decreased as the shear spans increased. This<br />
can be seen in the average values of Table 5-8 for each of the peg diameters and materials<br />
tested. For the White Oak pegs, the yield strengths tended to be higher when the peg was<br />
loaded in the radial direction, however, the loading orientation made little difference for the<br />
Red Oak pegs. On average, the shear yield strengths for White Oak were 13% higher than<br />
for Red Oak.<br />
From the data in Table 5-8, it can not be concluded that a strong relationship exists<br />
between the peg orientation and the yield strength.<br />
Table 5-7 Correlation Between Peg Dia. and Yield Stress<br />
Correlation<br />
1/4D 1/2D 1D<br />
RO - Diameter vs. Yield Stress -0.423 -0.518 -0.870<br />
WO - Diameter vs. Yield Stress -0.602 -0.608 -0.526<br />
48
Table 5-8 Shear Results Summary<br />
Material Dia. Orient- 1/4 D Shear Spans 1/2 D Shear Spans 1 D Shear Spans<br />
ation No. Avg. Yield Std. No. Avg. Yield Std. No. Avg. Yield Std.<br />
of Stress Dev. of Stress Dev. of Stress Dev.<br />
Tests (psi.) (psi.) Tests (psi.) (psi.) Tests (psi.) (psi.)<br />
Red Oak 3/4" R 5 1,950 284 5 1,706 209 5 1,614 261<br />
T 5 1,964 228 5 1,776 191 5 1,502 140<br />
Red Oak 1" R 5 1,956 186 5 1,783 126 5 1,465 222<br />
T 5 2,168 330 5 2,078 159 5 1,644 109<br />
Red Oak 1-1/4" R 5 1,928 159 5 1,688 340 5 1,205 159<br />
T 5 1,832 310 5 1,387 82 5 1,156 157<br />
Red Oak Combined 30 1,966 255 30 1,736 276 30 1,431 253<br />
Wht. Oak 3/4" R 5 2,299 275 5 2,045 167 5 1,708 299<br />
T 5 2,233 176 5 1,906 191 5 1,525 197<br />
Wht. Oak 1" R 5 2,433 348 5 2,033 83 5 1,743 275<br />
T 6 2,337 225 5 2,028 221 5 1,593 187<br />
Wht. Oak 1-1/4" R 5 2,146 99 5 2,015 158 5 1,688 45<br />
T 5 2,033 168 5 1,762 189 5 1,431 132<br />
Wht. Oak Combined 31 2,250 247 30 1,965 189 30 1,615 220<br />
9.<br />
The summaries for each diameter and the 5% exclusion values are shown in Table 5-<br />
The average and 5% exclusion values for each shear span are important because<br />
plots can be made that show how the values change with the shear span (a) (see Figure 5-5).<br />
After using full-sized tests to cause peg shear failures, the resulting shear stresses can be<br />
inserted into the trend function for the proper material and diameter and a corresponding<br />
shear span-to-depth ratio (a/D) can be obtained. From this non-dimensional value the<br />
actual shear span can be calculated. The shear span-to-depth ratio obtained can then be used<br />
Table 5-9 Shear Test Results Summary<br />
Material Diameter 1/4 D Shear Spans 1/2 D Shear Spans 1 D Shear Spans<br />
Avg. Yield Std. 5% Avg. Yield Std. 5% Avg. Yield Std. 5%<br />
Stress Dev. Exclusion Stress Dev. Exclusion Stress Dev. Exclusion<br />
Value Value Value<br />
(psi.) (psi.) (psi.) (psi.) (psi.) (psi.) (psi.) (psi.) (psi.)<br />
Red Oak 3/4" 1,957 243 1,446 1,741 192 1,336 1,558 206 1,124<br />
Red Oak 1" 2,062 276 1,482 1,930 206 1,497 1,555 190 1,155<br />
Red Oak 1-1/4" 1,880 238 1,379 1,537 282 944 1,180 151 862<br />
Red Oak Combined 1,966 255 1,489 1,736 276 1,221 1,431 253 958<br />
Wht. Oak 3/4" 2,266 221 1,802 1,976 185 1,587 1,617 258 1,075<br />
Wht. Oak 1" 2,380 276 1,808 2,031 157 1,700 1,668 236 1,173<br />
Wht. Oak 1-1/4" 2,090 143 1,789 1,888 211 1,443 1,559 164 1,214<br />
Wht. Oak Combined 2,250 247 1,789 1,965 189 1,612 1,615 220 1,204<br />
49
Yield Stress τ<br />
(psi.)<br />
3/4" Red Oak<br />
2,200<br />
2,000<br />
1,800<br />
1,600<br />
1,400 τ = -508.78(a /D ) + 2048.9<br />
1,200<br />
0.00 0.25 0.50 0.75 1.00 1.25<br />
Shear Span Ratio (a /D )<br />
Yield Stress τ<br />
(psi.)<br />
3/4" White Oak<br />
2,400<br />
2,200<br />
2,000<br />
1,800<br />
1,600 τ = -844.69(a /D ) + 2445.4<br />
1,400<br />
0.00 0.25 0.50 0.75 1.00 1.25<br />
Shear Span Ratio (a /D )<br />
Yield Stress τ<br />
(psi.)<br />
1" Red Oak<br />
2,200<br />
2,000<br />
1,800<br />
1,600<br />
1,400 τ = -687.42(a /D ) + 2250.1<br />
1,200<br />
0.00 0.25 0.50 0.75 1.00 1.25<br />
Shear Span Ratio (a /D )<br />
Yield Stress τ<br />
(psi.)<br />
1" White Oak<br />
2,400<br />
2,200<br />
2,000<br />
1,800<br />
1,600 τ = -917.58(a /D ) + 2561.7<br />
1,400<br />
0.00 0.25 0.50 0.75 1.00 1.25<br />
Shear Span Ratio (a /D )<br />
Yield Stress τ<br />
(psi.)<br />
2,000<br />
1,800<br />
1,600<br />
1,400<br />
1,200<br />
1-1/4" Red Oak<br />
τ = -901.32(a /D ) + 2058.3<br />
1,000<br />
0.00 0.25 0.50 0.75 1.00 1.25<br />
Shear Span Ratio (a /D )<br />
Yield Stress τ<br />
(psi.)<br />
2,400<br />
2,200<br />
2,000<br />
1,800<br />
1,600<br />
1-1/4" White Oak<br />
τ = -700(a /D ) + 2254<br />
1,400<br />
0.00 0.25 0.50 0.75 1.00 1.25<br />
Shear Span Ratio (a /D )<br />
Figure 5-5 Average Shear Yield Stresses<br />
in the trend function for the proper material combination and diameter of the 5% exclusion<br />
values, and a corresponding 5% exclusion value will be obtained.<br />
The combined average moisture content and specific gravity information for the<br />
shear tests is listed in Table 5-10.<br />
50
Yield Stress τ<br />
(psi.)<br />
1,800<br />
1,600<br />
1,400<br />
1,200<br />
1,000<br />
3/4" Red Oak<br />
τ = -428.49(a /D ) + 1552.1<br />
800<br />
0.00 0.25 0.50 0.75 1.00 1.25<br />
Shear Span Ratio (a /D )<br />
Yield Stress τ<br />
(psi.)<br />
2,000<br />
1,800<br />
1,600<br />
1,400<br />
1,200<br />
3/4" White Oak<br />
τ = -976.93(a /D ) + 2057.7<br />
1,000<br />
0.00 0.25 0.50 0.75 1.00 1.25<br />
Shear Span Ratio (a /D )<br />
Yield Stress τ<br />
(psi.)<br />
1" Red Oak<br />
1,800<br />
1,600<br />
1,400<br />
1,200<br />
1,000 τ = -470.59(a /D ) + 1652.4<br />
800<br />
0.00 0.25 0.50 0.75 1.00 1.25<br />
Shear Span Ratio (a /D )<br />
Yield Stress τ<br />
(psi.)<br />
2,000<br />
1,800<br />
1,600<br />
1,400<br />
1,200<br />
1" White Oak<br />
τ = -876.8(a /D ) + 2071.7<br />
1,000<br />
0.00 0.25 0.50 0.75 1.00 1.25<br />
Shear Span Ratio (a /D )<br />
Yield Stress τ<br />
(psi.)<br />
1,600<br />
1,400<br />
1,200<br />
1,000<br />
800<br />
1-1/4" Red Oak<br />
τ = -614.83(a /D ) + 1420.3<br />
600<br />
0.00 0.25 0.50 0.75 1.00 1.25<br />
Shear Span Ratio (a /D )<br />
Yield Stress τ<br />
(psi.)<br />
2,000<br />
1,800<br />
1,600<br />
1,400<br />
1,200<br />
1-1/4" White Oak<br />
τ = -722.79(a /D ) + 1903.6<br />
1,000<br />
0.00 0.25 0.50 0.75 1.00 1.25<br />
Shear Span Ratio (a /D )<br />
Figure 5-6 5% Exclusion Values From Shear Tests<br />
Table 5-10 Average Values of Moisture Content and Specific Gravity<br />
Average<br />
Moisture<br />
Content<br />
Average<br />
Specific<br />
Gravity<br />
Red Oak 3/4" 10.3% 0.60<br />
Red Oak 1" 8.7% 0.61<br />
Red Oak 1-1/4" 14.9% 0.65<br />
White Oak 3/4" 11.8% 0.68<br />
White Oak 1" 10.2% 0.67<br />
White Oak 1-1/4" 13.5% 0.69<br />
51
5.4 Dowel Bearing Test Results<br />
The dowel bearing strengths are shown in Table 5-12 for Eastern White Pine and<br />
Recycled Douglas Fir, using 1” Red Oak pegs. Logically, the LT orientation (parallel to<br />
grain) has higher bearing strengths than the RT orientation (perpendicular to grain) for both<br />
Eastern White Pine and Recycled Douglas Fir. It was interesting to note that, when either<br />
the Eastern White Pine or the Recycled Douglas Fir were loaded in the RT orientation<br />
crushing was visible in the base material; whereas, when the base material was loaded in the<br />
LT orientation, crushing was visible in the peg.<br />
The results of preliminary tests done by another researcher can be seen in Table 5-<br />
11.<br />
Table 5-11 Preliminary Dowel Bearing Strength Results (WO Pegs in Doug. Fir)<br />
Peg Orientation RL Block Orientation LR Block Orientation<br />
Number Average 5% Number Average 5%<br />
of Tests Value Exclusion of Tests Value Exclusion<br />
Value<br />
Value<br />
Radial 9 734 psi. 508 psi. 5 2,494 psi. 1,832 psi.<br />
Tangential 3 924 psi. 717 psi. 1 2,000 psi. N/A<br />
Peg Orientation LT Block Orientation TR Block Orientation<br />
Number Average 5% Number Average 5%<br />
of Tests Value Exclusion of Tests Value Exclusion<br />
Value<br />
Value<br />
Radial 4 2,784 psi. 1,970 psi. 3 1,578 psi. 971 psi.<br />
Tangential 2 1763 psi. N/A 3 1,411 psi. 1,199 psi.<br />
52
Table 5-12 Dowel Bearing Test Summary<br />
Base Base Peg Peg No. of Average Avg. Yield Std. COV 5% Exclusion<br />
Material Orient. Material Orient. Tests Stiffness Stress Dev. Value<br />
(lb/in) (psi.) (psi.) (psi.)<br />
RDF LT RO R 5 68,426 2,021 344 0.17<br />
RDF LT RO T 5 59,538 2,118 206 0.10<br />
RDF LT RO 10 63,982 2,070 272 0.13 1,497<br />
RDF RT RO R 5 35,102 1,728 174 0.10 1,300<br />
EWP LT RO R 5 63,200 2,285 115 0.05<br />
EWP LT RO T 5 61,039 2,268 199 0.09<br />
EWP LT RO 10 62,120 2,277 153 0.07 1,954<br />
EWP RT RO R 5 24,776 1,438 166 0.12<br />
EWP RT RO T 5 25,916 1,501 57 0.04<br />
EWP RT RO 10 24,977 1,469 122 0.08 1,213<br />
No conclusion can be made from the data available regarding the relationship<br />
between the peg orientation and the bearing strength of the material. Also, no clear<br />
correlations can be seen between the yield stresses and the material properties (see Table 5-<br />
Table 5-13 Dowel Bearing Test Correlation Data<br />
RDF-LT RDF-RT EWP-LT EWP-RT<br />
Yield Stress vs. Peg Specific Gravity 0.777 -0.413 0.233 -0.189<br />
Yield Stress vs. Peg Moisture Content -0.197 0.078 0.078 0.126<br />
Yield Stress vs. Peg Rings per Inch -0.666 0.099 -0.522 -0.078<br />
Yield Stress vs. Peg Grain Slope (deg) -0.483 0.191 -0.659 -0.001<br />
Yield Stress vs. Base Specific Gravity -0.179 -0.716 0.199 -0.048<br />
Yield Stress vs. Base Moisture Content -0.171 0.221 0.607 0.028<br />
Yield Stress vs. Base Rings per Inch -0.527 -0.742 -0.185 -0.586<br />
13).<br />
5.5 Full-size Test Results<br />
The major purpose of the full-size tests was to determine a relationship between the<br />
shear strength of the pegs in the full-size connections and the average shear strengths<br />
53
obtained from shear tests at various spans. Secondly, initial estimates of minimum end and<br />
edge distances were developed to assure peg shear failure.<br />
Table 5-14 shows the initial geometry and results from each individual test. The<br />
failure mode is noted. All tests used 2x6 Douglas Fir and two Red Oak pegs. The first test<br />
used 1” pegs with end and edge distances of 3D. The yield load is not recorded for this test<br />
because of setup problems, but the load obtained was much less than desired because of the<br />
mortise splitting failure. For this reason the edge distance was increased to 4D. The next<br />
two tests also used 1” pegs, but the desired shear failure in the pegs was not observed. The<br />
second of these failed in a mode similar to Mode III s , but only contained a single hinge.<br />
After reviewing the derivation of the Mode III s equation, it was determined that Mode III s<br />
would not permit this type of failure. Therefore another failure mode is needed pertaining<br />
to this scenario (thus the nomenclature Mode III s ’).<br />
The last three tests used ¾” pegs and end and edge distances of 3D and 4D<br />
respectively, to assure shear failures in the pegs. Only two of these tests were considered<br />
valid since the side 2x6’s representing the mortised member on the last test spread apart<br />
approximately ¼” on each side, thus increasing the shear spans in the pegs and causing an<br />
early shear failure. This much spreading of the mortise was considered unlikely in a full-size<br />
Table 5-14 Full-size Test Results<br />
Peg End Edge Yield Failure Shear Equiv.<br />
Diameter Dist. Dist. Load Type Stress Shear<br />
(in.) (l v ) (l e ) (lb.) (psi.) Span<br />
1.00 3D 3D N/A Mortise Split N/A N/A<br />
1.00 3D 4D 4843 Tenon Split 1,542 N/A<br />
1.00 3D 4D 5563 Mode III s ' 1,771 N/A<br />
0.75 3D 4D 3285 Peg Shear 1,859 0.37<br />
0.75 3D 4D 3490 Peg Shear 1,975 0.15<br />
0.75 3D 4D 2756 2x6 Spread 1,560 N/A<br />
54
connection. Therefore, the shear stresses from the two valid tests were inserted into the<br />
trend line from the average shear stresses of the ¾” Red Oak pegs and the approximate<br />
shear span was calculated for each. The average of these two shear spans (0.26 D) can then<br />
be used in the trend line for the 5% exclusion values to calculate the 5% exclusion values.<br />
Assuming that all Oak pegs fail in full-size connections in a similar manner, the<br />
resulting 5% exclusion values for Red Oak and White Oak pegs can be seen in Table 5-15.<br />
Needless to say, many additional full-size tests are needed to verify this assumption.<br />
Table 5-15 5% Shear Exclusion Value Summary<br />
Material Peg Shear Average 5%<br />
Dia. Span of Yield Exclusion<br />
Interest Stress Value<br />
(in.) (psi.) (psi.)<br />
Red Oak 3/4" Dia. 0.26 1,917 1,441<br />
Red Oak 1" Dia. 0.26 2,071 1,530<br />
Red Oak 1-1/4" Dia. 0.26 1,824 1,260<br />
Red Oak Combined 0.26 1,937 1,410<br />
White Oak 3/4" Dia. 0.26 2,226 1,804<br />
White Oak 1" Dia. 0.26 2,323 1,844<br />
White Oak 1-1/4" Dia. 0.26 2,072 1,703<br />
White Oak Combined 0.26 2,207 1,783<br />
6. Overall Connection Strength and Design Recommendations<br />
6.1 Application of Factors of Safety<br />
The 5% exclusion values obtained from testing are useful to a designer wanting to do<br />
allowable stress design when factors of safety have been applied to them. These allowable<br />
stresses should be applied to a comprehensive analytical model that includes the NDS<br />
double shear yield modes and the other modes applicable to mortise and tenon connections<br />
(see Equations 3-34 through 3-39). These modes include the combined bending and shear<br />
mode, the relish failure mode, and the mortise splitting mode.<br />
55
To obtain allowable stress design values for these equations, factors of safety must<br />
be applied to the 5% exclusion values for each material property. These factors of safety<br />
must account for the variability of loads, load duration, differences in construction practices,<br />
and the accuracy of the analysis model. Typical factors of safety from ASTM 5457-93<br />
(ASTM, 1995a) for members subjected to bending, shear, and bearing are 2.54, 2.88, and<br />
2.40, respectively. However, for connections, there is a standard factor of safety of 3.32.<br />
From the results of his full-size connection tests, Kessel suggests that a factor of<br />
safety of 3.00 should be applied to the average ultimate load from a series of tests (in which<br />
the geometry and materials are kept the same for each series), and a factor of safety of 2.25<br />
should be applied to the minimum ultimate load from the same series of tests. He also<br />
suggests that the allowable load for a connection should be the average load achieved for a<br />
series of tests at a joint displacement of 0.06” (1.5 mm) (Peavy and Schmidt, 1996). Further<br />
work needs to be done in this area to determine appropriate factors of safety.<br />
6.2 Current Design Procedures<br />
The designers in the timber-framing industry employ clearly understood principles in<br />
the design of beams and columns, but connections in these structures are designed based on<br />
traditional practices and the limited applicability of the NDS yield modes.<br />
This method of design is appropriate and acceptable in parts of the country where<br />
building officials are familiar with this system of joinery; however, this practice is often<br />
regarded as unacceptable in other parts of the country.<br />
6.3 Recommendations for <strong>Timber</strong>-<strong>Frame</strong> <strong>Joinery</strong><br />
The design community should adopt an analytical approach to timber-frame tension<br />
joinery design. In this way, a standard method can be used by all designers, thus validating<br />
the design practice and expanding it to all parts of the nation.<br />
56
Such a standard design method is far from complete. Once the failure modes are<br />
completely understood, there should be much thought given to a desired or preferred failure<br />
mode. For instance, would it be better if the connection failed in the mortise material rather<br />
than in the tenon? Or would a peg shear failure be better than a bearing failure? Why would<br />
a designer choose one over another? Perhaps a bearing failure would dissipate more energy<br />
in an earthquake than a peg shear failure would. Perhaps a peg shear failure would allow a<br />
simple repair to the connection if it was ever overloaded. As another option entirely,<br />
perhaps the connections should be balanced so that all failure modes are equally possible,<br />
thus conserving material used in the connection. Whatever the case may be, these and many<br />
other questions need to be answered before thorough design recommendations can be made.<br />
However, some design recommendations can be established based on this work and on the<br />
work of others.<br />
The following design recommendations stem from the work of this research project<br />
and the tests performed by M. H. Kessel (Peavy and Schmidt, 1996). Based on the full-size<br />
tests of this project, in which 2x6 Douglas Fir lumber was used to represent the tenon and<br />
mortise material of a connection, some conclusions about the end and edge distances can be<br />
obtained (see Figure 6-1). To prevent the tenon from splitting or the relish from pulling out,<br />
an end distance (l v ) from the center of the peg to the end of the tenon, should be greater<br />
than or equal to three times the peg diameter (see Figure 6-2). To prevent the sides of the<br />
mortise from splitting, an edge distance (l e ) from the center of the peg to the edge of the<br />
mortise material, should be greater than or equal to four times the peg diameter.<br />
57
l e<br />
l v<br />
Figure 6-1 Full-size Test<br />
Diagram<br />
Figure 6-2 End,<br />
Edge Distances<br />
These recommendations are appropriate when Oak pegs are used to connect<br />
individual softwood members in this fashion. They are likely conservative recommendations<br />
for full-size mortise and tenon connections (see Figure 6-3). The sides of the mortise are<br />
significantly strengthened by the additional material that surrounds the tenon. The effect<br />
this has on the strength of the mortise in tension is unknown. This additional mortise<br />
material would also prevent the sides of the mortise from splitting outward, whereas the<br />
2x6’s are free to rotate and spread outward. If the tenon is sufficiently surrounded by<br />
Mortise<br />
Tenon<br />
Wood<br />
Pegs<br />
Post<br />
Beam<br />
Figure 6-3 Full-size Mortise and Tenon<br />
Connection<br />
58
material, the possibility of tenon splitting is most likely removed. The effect of this<br />
surrounding material is unknown.<br />
Of the 120 full-size all-wood connections tested by M. H. Kessel, 60 mortise and<br />
tenon failures were summarized and some conclusions can be drawn. These connections<br />
were very similar to that in Figure 6-3 and used Oak members that ranged in size from<br />
5.5”x5.5” to 7.9”x7.9” (140mm x 140mm to 200mm x 200mm). The pegs were also made<br />
of oak and ranged in diameter from 0.9” to 1.6” (24mm to 40mm). Table 6-1 shows how<br />
the types of failure modes are based on the connection geometry (Peavy and Schmidt, 1996).<br />
In many cases the connection failed in more than one mode. Some simple conclusions can<br />
be drawn from these test results. It is important to note that these conclusions are based on<br />
tests using oak timbers and oak pegs. Conclusions based on these tests may not directly<br />
correspond to other materials because of differing shear and other strengths.<br />
To prevent mortise failures, a mortise edge distance (l e ) of 3.0D or greater is required.<br />
To prevent tenon failures, the end distance (l v ) must be larger than 2.0D, since tenon failures<br />
still occurred with the peg failures in Series D. An end distance of 3.0D is a more<br />
appropriate value. To balance out the design and create an equal possibility for tenon,<br />
mortise, and peg failures, the geometry in Series B should be used.<br />
Figure 6-4 shows initial material parameters, connection geometry, and the results of<br />
Table 6-1 Kessel Results Summary<br />
Series End Edge Tot. No. No. of Breaks In:<br />
Dist. Dist. of Tests Tenon Mortise Peg<br />
l v l e<br />
A 2.0D 2.0D 15 3 10 9<br />
B 1.5D 2.0D 15 7 7 9<br />
C 1.5D 1.5D 15 8 11 9<br />
D 2.0D 3.0D 15 11 1 15<br />
59
each mode in the general yield model. These calculations are based on a mortise and tenon<br />
connection using Eastern White Pine 6x6’s (full sawn) and two 1” Red Oak pegs. The<br />
calculations show that the peg shear condition will govern, but with the relish failure mode<br />
closely behind. They also show that the allowable load in tension on the connection should<br />
be 1334 pounds. The equations used in this general yield model are summarized in Figure 6-<br />
5.<br />
Given Information<br />
Notes<br />
Peg Diameter D = 1.00 in.<br />
No. of Pegs n = 2<br />
Tenon Thickness t m = 2.00 in.<br />
Mortise Side Thickness t s = 2.00 in.<br />
Length from Peg Center<br />
To End of Tenon l v = 3.00 in.<br />
Peg Bending Stress F yb = 7,871 psi. RO<br />
Peg Shear Stress F v ⊥ = 1,410 psi. RO<br />
Tenon Dowel<br />
Bearing Stress F em = 1,954 psi. EWP<br />
Mortise Side Dowel<br />
Bearing Stress F es = 1,213 psi. EWP Constants<br />
Tenon Shear EWP R e = 1.611<br />
Stress F vm = 70 psi. NDS Allow. k 3 = 1.380<br />
Calculations<br />
Mode I m F.S. 3.32 P = 2,354 lb. Main Bearing<br />
Mode I s F.S. 3.32 P = 2,923 lb. Side Bearing<br />
Mode III s F.S. 3.32 P = 1,800 lb.<br />
Mode IV F.S. 3.32 P = 2,388 lb.<br />
Mode V F.S. 3.32 P = 1,334 lb. Peg Shear<br />
Mode VI F.S. 1.00 P = 1,680 lb. Relish Failure<br />
Max. Ultimate Load 1,334 lb.<br />
Figure 6-4 Sample Connection Design Values<br />
60
P<br />
P<br />
P<br />
P<br />
P<br />
= nDt F<br />
Im m em<br />
= 2nDt F<br />
Is s es<br />
IIIs<br />
IV<br />
V<br />
2nk 3Dt sF<br />
=<br />
= 2nD<br />
= 2nF<br />
( 2 + R )<br />
2<br />
v⊥<br />
e<br />
em<br />
2F<br />
em<br />
( + R )<br />
31<br />
2<br />
⎛ D ⎞<br />
⎜π<br />
⎟<br />
⎝ 4 ⎠<br />
⎛ D⎞<br />
PVI = 2nFvmtm ⎜lv<br />
− ⎟<br />
⎝ 2 ⎠ k<br />
F<br />
yb<br />
e<br />
Where:<br />
n = Number of pegs<br />
D = Peg diameter<br />
t<br />
t<br />
F<br />
F<br />
F<br />
F<br />
F<br />
R<br />
m<br />
s<br />
3<br />
em<br />
es<br />
e<br />
yb<br />
v⊥<br />
vm<br />
= Thickness of tenon (main) member<br />
= Thickness of sides of mortised member<br />
= Dowel bearing strength of main member<br />
= Dowel bearing strength of mortise sides<br />
= Bending yield strength of peg<br />
= Peg shear yield strength<br />
= Shear yield strength of tenon (main) member<br />
=− 1 +<br />
F<br />
=<br />
F<br />
em<br />
es<br />
21 ( + R F R D<br />
e<br />
) 2<br />
yb<br />
( 2+<br />
e<br />
)<br />
+<br />
2<br />
R 3F t<br />
Figure 6-5 Double Shear Yield Equations<br />
e<br />
em s<br />
2<br />
61
7. Conclusions and Recommendations for Future Work<br />
7.1 Concluding Statements<br />
The existing yield model equations from the NDS are applicable to hardwood pegs<br />
used as dowel fasteners in mortise and tenon connections, however additional modes<br />
specific to these connections were necessary. One of these additional modes is regarding a<br />
peg shear condition. Hardwood pegs can fail in full-size connections under the combined<br />
stresses of shear and bending. Therefore this shear mode must take into account these<br />
combined effects. Another failure mode describes the shear failure of the material directly<br />
behind the peg in the tenon, also known as relish failure. Another type of failure specific to<br />
mortise and tenon connections is the mortise splitting failure.<br />
The major findings of this research project are limited by the types of tests and<br />
materials used in this project. The material strengths were influenced by the specific gravity<br />
of the material. As the specific gravity increased, the yield strengths also increased. The<br />
orientation of the peg had a slight effect on the bending yield strengths, but it had little or no<br />
effect on the shear or dowel bearing yield strengths. No clear conclusions could be drawn<br />
regarding the effect of the moisture content on the material yield strengths.<br />
The drastic failure modes of full-size joints, where the loads suddenly dropped off as<br />
deflection was occurring, were the mortise splitting and the peg bending modes. Although<br />
no tenon relish failures were witnessed, it is assumed that they would also fall into this<br />
category. The peg shear and dowel bearing failures were relatively ductile in that they<br />
allowed a significant amount of inelastic deformation before the loads dropped off.<br />
7.2 Recommendations for Future Work<br />
Much additional work is necessary. Additional wood species combinations need to<br />
be tested for their bending, shear, and dowel bearing strengths to account for other common<br />
62
materials used in design. Specific tests to determine relish shear strengths must be devised to<br />
verify end distances and the possible effect of tenon thickness and peg diameter. The<br />
mortise splitting failure must be examined in great detail to determine the effects of the<br />
mortise side thicknesses, peg diameter, and the strength of the surrounding mortise material.<br />
Many more full-size static tests of mortise and tenon connections of various<br />
materials and geometries are needed to validate the general yield model. These are also<br />
necessary to understand how specific yield modes occur and therefore to be able to predict<br />
their occurrences. Full-size tests should also be accomplished so that joint stiffnesses can be<br />
understood and predicted to a degree of accuracy.<br />
Dynamic tests of full-size connections would result in an understanding of their<br />
energy absorption capabilities and their ability to withstand earthquake loads.<br />
The NDS Mode III s does not seem to apply directly to a specific type of failure in<br />
mortise and tenon connections. The failure witnessed is similar to this mode, but contains<br />
only one plastic hinge, occurring in the middle of the tenon. By reviewing the derivation of<br />
Mode III s , it seems that this type of failure is impossible due to the inability of the<br />
surrounding material to firmly hold the peg. Therefore, an additional failure mode, termed<br />
Mode III s ’ herein, should be devised to account for this failure type.<br />
Appropriate factors of safety should also be determined for use with these<br />
connections. They should account for the variability in loading, construction practices, and<br />
the accuracy of the general yield model.<br />
Also, a full analysis should be made of the acceptable failure modes. It is unclear at<br />
this point if one failure mode is more desirable than another. Another possibility is for the<br />
connection to be balanced to allow all failure modes to be equally probable.<br />
63
Appendix A Derivation of Dowel Rotation Load<br />
Sum forces in the Y-direction:<br />
Figure A-1 Dowel<br />
Rotation Diagram<br />
( )<br />
P= F D 2 x−t<br />
(A-1)<br />
e<br />
Sum moments about load P:<br />
⎛ t x<br />
x<br />
FDt<br />
e<br />
( − x) e+ x+ − ⎞<br />
⎜<br />
FDx<br />
e<br />
( ) e<br />
⎝ ⎠<br />
⎟ − ⎛<br />
⎜<br />
⎝<br />
+ ⎞<br />
⎟ = 0 (A-2)<br />
2 2⎠<br />
2<br />
2<br />
t<br />
x + 2ex−te− = 0<br />
(A-3)<br />
2<br />
Solve Eq. A-3 for x:<br />
( )<br />
2 2<br />
e e t t<br />
x = − 2 ± 2 + +<br />
2<br />
(A-4)<br />
Substitute into equation A-1 for x:<br />
2 2<br />
[ ( 2 ) ( 2 )]<br />
P= e+ t + t − e+<br />
t DF e<br />
(A-5)<br />
64
Appendix B Derivation of Dowel Yielding Load<br />
From shear and moment diagrams:<br />
P<br />
= ZF e<br />
D<br />
(B-1)<br />
Determine moment at plastic hinge location:<br />
⎛<br />
M = P( e+ Z) −F D( Z)<br />
Z<br />
y<br />
e<br />
⎞<br />
⎜ ⎟<br />
⎝ 2⎠<br />
(B-2)<br />
Substitute for P Eq. B-1 into Eq. B-2:<br />
M Pe PZ P Z<br />
y<br />
= + − ⎛ ⎝ ⎜ ⎞<br />
⎟<br />
2⎠<br />
(B-3)<br />
⎛ M<br />
y ⎞<br />
Z = 2 ⎜ −e⎟<br />
⎝ P ⎠<br />
(B-4)<br />
⎛ M<br />
y ⎞<br />
P = 2 ⎜ −eFD<br />
⎟ e<br />
⎝ P ⎠<br />
(B-5)<br />
Figure B-1 Dowel Bending<br />
Diagrams<br />
2<br />
P + 2eF DP− 2M F D= 0 (B-6)<br />
e y e<br />
⎡<br />
2<br />
DF ⎤<br />
2<br />
yb<br />
P= ⎢ e + −eDF<br />
⎥<br />
Fe<br />
⎣<br />
⎢ 3<br />
⎦<br />
⎥<br />
e<br />
(B-7)<br />
65
Appendix C NDS Yield Mode II, Alternate Derivation<br />
Figure C-1 Mode II - Load, Shear, and Moment Diagrams<br />
66
From shear diagram equality:<br />
Solving for d:<br />
( 2 ) ( 2 )<br />
F D a − t = F D d − t<br />
(C-1)<br />
em m es s<br />
d =<br />
2F a − F t + F t<br />
em em m es s<br />
2F<br />
es<br />
(C-2)<br />
From the moment diagram:<br />
M<br />
a<br />
+ M =<br />
d<br />
( − 2 ) ( − 2 )<br />
2 2<br />
Fem D tm a Fem D ts<br />
d<br />
+<br />
2<br />
2<br />
= F Da + F Dd<br />
em<br />
2 2<br />
es<br />
(C-3)<br />
Substitute for d and solve for a:<br />
a =<br />
F t<br />
em<br />
s<br />
2<br />
3 2<br />
Fem<br />
tm<br />
F t<br />
2 2 2<br />
em m<br />
+ + 2Femtm − 2Fem ts + 2Fem tmts<br />
+ + 2F t + F F t<br />
F<br />
F<br />
es<br />
⎛ F<br />
2Fem<br />
⎜1+<br />
⎝ F<br />
em<br />
es<br />
⎞<br />
⎟<br />
⎠<br />
es<br />
2 2 2<br />
em m em es s<br />
(C-4)<br />
P= 2 F Da−<br />
F Dt<br />
(C-5)<br />
em em m<br />
Substitute R e = F em /F es and R t = t m /t s :<br />
2 ( 1 )<br />
( 1 + R )<br />
⎛<br />
⎜<br />
P Dt F R + R R − R + R +<br />
=<br />
R + R + R R<br />
s es⎜<br />
⎝<br />
e<br />
2 2 3 2<br />
e e t e e t t e t<br />
⎞<br />
⎟<br />
⎟<br />
⎠<br />
(C-6)<br />
67
Appendix D NDS Mode III s , Alternate Derivation<br />
Figure D-1 Mode III s - Load, Shear, and Moment Diagrams<br />
68
From shear diagram equality:<br />
( − ) = ( − )<br />
DF a b DF 2 d t<br />
(D-1)<br />
Substitute for b and solve for d:<br />
em es s<br />
d =<br />
F t<br />
− F a 2<br />
es s em<br />
2F<br />
es<br />
(D-2)<br />
From the moment diagram:<br />
M<br />
f<br />
2<br />
= F Dd =<br />
es<br />
DF t − 2DF F t a 2 + 2DF a<br />
2 2 2 2<br />
es s em es s em<br />
4F<br />
es<br />
(D-3)<br />
M<br />
p<br />
3<br />
FybD<br />
2 2<br />
+ M<br />
f<br />
= + FesDd<br />
= −FemDa<br />
−<br />
6<br />
( 2 − )<br />
F d t D<br />
es<br />
2<br />
s<br />
2<br />
(D-4)<br />
Substitute for d:<br />
2 2 2 2<br />
F a F t a F t F D<br />
2 em<br />
em s es s yb<br />
− Fema<br />
− − + + = 0 (D-5)<br />
2F<br />
2 4 6<br />
es<br />
Solve for a:<br />
a =<br />
2 2 2 2 2<br />
F t F t ⎛ F ⎞⎛<br />
F t F D<br />
em s em s<br />
em es s yb<br />
⎞<br />
− + 4⎜<br />
Fem<br />
+ ⎟ +<br />
⎝ Fes<br />
⎠<br />
⎜<br />
2 2<br />
2 ⎟<br />
⎝ 4 6 ⎠<br />
(D-6)<br />
2<br />
⎛ F ⎞<br />
em<br />
2⎜−<br />
Fem<br />
− ⎟<br />
⎝ 2F<br />
⎠<br />
es<br />
Substituting:<br />
P<br />
= Fema<br />
2 (D-7)<br />
Substitute R e = F em /F es and R t = t m /t s :<br />
P =<br />
Dt F s<br />
2 + R<br />
em<br />
e<br />
⎛<br />
⎜<br />
⎜<br />
− 1+<br />
⎝<br />
( + R ) yb ( +<br />
e )<br />
2<br />
21<br />
e<br />
2F 2 R D ⎞<br />
+<br />
⎟<br />
2<br />
Re<br />
3Femt<br />
⎟<br />
(D-8)<br />
s<br />
⎠<br />
69
Appendix E Standard Test Setup for Instron Model 1332 Machine<br />
Start the Strawberry Tree data acquisition system.<br />
Turn on hydraulic pressure from Instron control panel.<br />
Set load and stroke range<br />
Example: 20% load range is 20% of 55 kips or 11 kips. While the output reads from<br />
0 to -10 volts, the load will be changing from 0 to 11 kips (compression).<br />
50% stroke range is 50% of 2 inches or 1 inch. While the output reads from 10 to 0<br />
volts, the stroke will be changing from -1 to 0 inches.<br />
Note: To adjust the stroke range, it is best to set the stroke position to 0, or the<br />
midpoint. This can be done by changing the readout to stroke and manually<br />
changing the position of the piston with the stroke dial. If the stroke position were<br />
not changed to zero, the current position of the stroke might be outside of the<br />
desired range.<br />
Further note: To manually adjust the position of the stroke, the actuator must be<br />
turned on and set in the high position.<br />
Insert object to be tested and secure it.<br />
Lower top crossbar by turning the valve to unclamp the sides and opening the valve to lower<br />
the crossbar. Lower the head until it presses on the object to be tested. Then zero<br />
the load and stroke controllers (using the error lights and knobs) and make sure that<br />
the machine is set to stroke control (green light should be on at top of stroke<br />
controller).<br />
Make sure the switch is in the interlock position at the bottom of the load controller.<br />
Turn on the actuator and set it to the high position.<br />
Move the piston to the bottom of the stroke (+100% of stroke range).<br />
Open the Strawberry Tree file named loadefl.wbb (by using right mouse button) to allow<br />
reading of the load and stroke channels.<br />
Double-click on log output file icon.<br />
Type general description of test. (e.g. 1” White Oak Shear Test, 1/2” Spans, Radial, 20%<br />
Load Range, 20% Stroke Range)<br />
Click on Save As button to save the output file under its own name (e.g. wo10200s.txt)<br />
Make sure that the readings are continuous with an interval of 3 seconds.<br />
Click OK to return to the main screen.<br />
Set up function generator - Ramp mode, inverted (compression), sine waveform, gate.<br />
Specify period of function. (e.g. 50% x 2” / 0.05”/min = 20 min. period)<br />
In the Strawberry Tree main screen click with right mouse button and Enable, then Start All<br />
Logs.<br />
Press Start on function generator.<br />
Watch data output for load peak voltage and compute approximate peak load. Let run for<br />
about a minute after peak load. Compute approx. max. displacement.<br />
Click with right mouse button and Enable, then Stop All Logs.<br />
Press Hold on function generator, then Reset.<br />
Turn off actuator.<br />
Raise top crossbar by opening clamp valve and opening raise valve. Then close raise valve<br />
and clamp again.<br />
71
Appendix F Peg Testing Form<br />
Test Data<br />
Peg Information<br />
Species<br />
Peg No.<br />
Diameter<br />
Filename<br />
Date<br />
Time<br />
Slope of Grain<br />
No. Rings / Inch<br />
Orientation<br />
Defects<br />
Small Sample Exact Length<br />
Initial Weight<br />
Final Weight<br />
Base Material<br />
Species<br />
Trough Length<br />
Orientation<br />
No. Rings / Inch<br />
Defects<br />
Small Sample Exact Size<br />
Initial Weight<br />
Final Weight<br />
Type of Test<br />
Load Rate<br />
Load Range<br />
Stroke Range<br />
Approx. Ultimate Load<br />
Failure Type<br />
Approx. Stroke Distance<br />
Oven Temp.<br />
Total Time<br />
72
Appendix G Bending Test Data<br />
Summary of Bending Tests: Last Revision: 8/11/97 Note: Formatting Changes<br />
ACTUAL LOAD BREAK YIELD F yb SG STIFFNESS<br />
SPECIES DIA (IN.) ORIENT. TYPE LOAD (lb) (psi) M.C. % (LB/IN)<br />
RO 0.742 R Cross-grain Tens. 331 12,886 10.6% 0.53 1343<br />
RO 0.745 R Splintering Tens. 436 16,796 10.8% 0.60 1778<br />
RO 0.775 R Splintering Tens. 495 16,908<br />
RO 0.766 R Splintering Tens. 513 18,147<br />
RO 0.774 R Cross-grain Tens. 536 18,388<br />
RO 0.767 R Simple Tens. 568 20,024 7.71 0.64<br />
RO 0.738 R Splintering Tens. 511 20,210 10.6% 0.64 2663<br />
RO 0.774 R Cross-grain Tens. 623 21,388<br />
RO 0.757 R X-grain Tens. & Shear 586 21,502 8.68 0.65<br />
RO 0.763 R Splintering Tens. 641 22,963 7.88 0.64<br />
RO 0.773 T Cross-grain Tens. 234 8,052<br />
RO 0.751 T Cross-grain Tens. 341 12,798 10.8% 0.54 1668<br />
RO 0.781 T Simple Tens. 403 13,470<br />
RO 0.765 T Simple Tens. 394 14,008<br />
RO 0.772 T Simple Tens. 412 14,264<br />
RO 0.737 T Splintering Tens. 394 15,666 11.0% 0.62 1577<br />
RO 0.750 T Splintering Tens. 458 18,425 8.03 0.62<br />
RO 0.757 T Splintering Tens. 678 24,862 7.99 0.66<br />
18 17,264 Mean<br />
K Factor 1.952 4,241 Std. Dev.<br />
8,986 5% Exclusion<br />
RO 1.004 R Brash Tens. 632 9,937<br />
RO 1.005 R Cross-grain Tens. 751 11,791<br />
RO 1.005 R Splintering Tens. 806 12,629<br />
RO 1.007 R Splintering Tens. 833 12,982<br />
RO 1.010 R Cross-grain tens. 861 13,297 5.01 0.52<br />
RO 1.005 T Cross-grain Tens. 641 10,041<br />
RO 1.009 T Cross-grain Tens. 765 11,841<br />
RO 1.008 T Cross-grain Tens. 824 12,795<br />
RO 1.007 T Cross-grain Tens. 934 14,573<br />
RO 1.016 T Splinter tens./Simple tens. 1062 16,120 5.87 0.61<br />
10 12,601 Mean<br />
K Factor 2.104 1,881 Std. Dev.<br />
8,644 5% Exclusion<br />
RO 1.2500 R Cross-grain Tens. 1575 12,835 10.72 0.61<br />
RO 1.2463 R Cross-grain Tens. 1667 13,701 11.41 0.62<br />
RO 1.2493 R Splinter Tens./Brash 1809 14,761 12.19 0.64<br />
RO 1.2468 R Splintering Tens. 1886 15,490 12.40 0.63<br />
RO 1.236 R Splintering tens. 2198 18,525 9.49 0.58<br />
RO 1.2458 T Cross-grain Tens. 1245 10,251 11.55 0.56<br />
RO 1.2502 T Cross-grain Tens. 1392 11,338 10.17 0.55<br />
RO 1.2493 T Splintering Tens. 1410 11,510 10.46 0.51<br />
RO 1.2427 T Cross-grain Tens. 1676 13,899 10.43 0.59<br />
9 13,590 Mean<br />
K Factor 2.142 2,514 Std. Dev.<br />
8,205 5% Exclusion<br />
73
Summary of Bending Tests: Last Revision: 8/11/97 Note: Formatting Changes<br />
ACTUAL LOAD BREAK YIELD F yb SG STIFFNESS<br />
SPECIES DIA (IN.) ORIENT. TYPE LOAD (lb) (psi) M.C. % (LB/IN)<br />
WO 0.756 R Splintering Tens. 252 9,276<br />
WO 0.741 R Cross-grain Tens. 238 9,301<br />
WO 0.756 R Splintering Tens. 293 10,808<br />
WO 0.759 R Splintering Tens. 353 12,833<br />
WO 0.740 R Simple tens./X-grain tens. 348 13,667 6.02 0.64<br />
WO 0.751 R Cross-grain Tens. 492 18,465 10.2% 0.71 2126<br />
WO 0.730 R Cross-grain Tens. 454 18,538 10.1% 0.69 2283<br />
WO 0.731 R Splintering tens. 495 20,148 6.83 0.74<br />
WO 0.751 T Cross-grain Tens. 256 9,647<br />
WO 0.735 T Minimal Splint. tens. 266 10,645 6.38 0.71<br />
WO 0.762 T Splintering Tens. 321 11,514<br />
WO 0.755 T Cross-grain Tens. 321 11,861<br />
WO 0.753 T Splintering Tens. 325 12,118<br />
WO 0.716 T Minimal Splint. tens. 288 12,507 7.92 0.75<br />
WO 0.749 T Cross-grain Tens. 368 13,956 9.9% 0.74 1872<br />
WO 0.738 T Compression 511 20,210 9.8% 0.68 2972<br />
WO 0.738 T Splintering Tens. 513 20,290 9.9% 0.69 3439<br />
17 13,870 Mean<br />
K Factor 1.964 4,023 Std. Dev.<br />
5,969 5% Exclusion<br />
WO 0.996 R Simple Tens. 540 8,699<br />
WO 1.006 R Splintering Tens. 733 11,469<br />
WO 0.999 R Simple Tens. 733 11,683<br />
WO 1.003 R Cross-grain Tens. 925 14,581<br />
WO 0.992 R Simple Tens. 1117 18,215 11.66 0.74<br />
WO 1.003 T Splintering Tens. 678 10,689<br />
WO 0.999 T Splintering Tens. 705 11,256<br />
WO 0.994 T Cross-grain tens. 769 12,466 10.98 0.58<br />
WO 1.000 T Splintering Tens. 815 12,965<br />
WO 0.999 T Splintering Tens. 884 14,100<br />
10 12,612 Mean<br />
K Factor 2.104 2,596 Std. Dev.<br />
7,151 5% Exclusion<br />
WO 1.250 R Cross-grain Tens. 1429 11,641 13.21 0.70<br />
WO 1.268 R Cross-grain Tens. 1722 13,440 13.50 0.63<br />
WO 1.258 R Cross-grain Tens. 1841 14,715 14.22 0.69<br />
WO 1.237 R Splintering tens. 1809 15,207 8.92 0.64<br />
WO 1.241 R Splintering tens. 2152 17,920 9.66 0.68<br />
WO 1.249 T Cross-grain Tens. 1355 11,084 13.54 0.57<br />
WO 1.245 T Cross-grain Tens. 1346 11,102 13.91 0.63<br />
WO 1.244 T Cross-grain Tens. 1502 12,421 13.52 0.68<br />
WO 1.240 T Splintering tens. 1648 13,760 10.27 0.66<br />
WO 1.241 T Cross-grain Tens. 1767 14,730 9.37 0.69<br />
WO 1.259 T Cross-grain Tens. 1854 14,789 13.57 0.69<br />
11 13,710 Mean<br />
K Factor 2.074 2,071 Std. Dev.<br />
9,414 5% Exclusion<br />
Locust 0.758 R Cross-grain Tens. 451 16,997 9.00 0.68<br />
Locust 0.760 T Splintering Tens. 549 20,728 10.34 0.68<br />
Locust 0.759 T Splintering Tens. 577 21,765 9.26 0.70<br />
3 19,830 Mean<br />
K Factor 3.152 2,507 Std. Dev.<br />
11,927 5% Exclusion<br />
74
Summary of Bending Tests: Last Revision: 8/11/97 Note: Formatting Changes<br />
ACTUAL LOAD BREAK YIELD F yb SG STIFFNESS<br />
SPECIES DIA (IN.) ORIENT. TYPE LOAD (lb) (psi) M.C. % (LB/IN)<br />
Locust 1.010 R Cross-grain Tens. 1328 20,532<br />
Locust 1.009 R Splintering Tens. 1397 21,626 8.65 0.67<br />
Locust 1.021 T Splintering Tens. 1786 26,742 7.78 0.76<br />
Locust 1.013 T Cross-grain Tens. 1795 27,453 7.58 0.75<br />
4 24,088 Mean<br />
K Factor 2.681 3,515 Std. Dev.<br />
14,663 5% Exclusion<br />
Birch 1.014 R Cross-grain Tens. 1145 17,491 10.35 0.58<br />
Birch 1.007 R Splintering Tens. 1209 18,849 9.81 0.58<br />
Birch 1.024 T Cross-grain Tens. 1209 17,944 10.92 0.64<br />
Birch 1.013 T Cross-grain Tens. 1209 18,498 11.19 0.65<br />
4 18,196 Mean<br />
K Factor 2.681 600 Std. Dev.<br />
16,588 5% Exclusion<br />
Maple 0.742 R Cross-grain Tens. 503 19,582 8.0% 0.60 3162<br />
Maple 0.741 R Splintering Tens. 542 21,211 8.0% 0.67 4183<br />
Maple 0.749 R Simple Tens. 659 24,990 7.13 0.62<br />
Maple 0.743 R Simple Tens. 897 34,846 3.64 0.69<br />
Maple 0.743 T Cross-grain Tens. 472 18,278 8.6% 0.68 2604<br />
Maple 0.742 T Cross-grain Tens. 534 20,788 8.0% 0.67 3524<br />
Maple 0.738 T Cross-grain Tens. 542 21,437 7.8% 0.70 3432<br />
Maple 0.741 T Cross-grain Tens. 934 36,538 5.52 0.66<br />
Maple 0.745 T Cross-grain Tens. 998 38,446 7.37 0.63<br />
9 26,235 Mean<br />
K Factor 2.142 8,035 Std. Dev.<br />
9,025 5% Exclusion<br />
Ash 0.745 R Cross-grain Tens. 316 12,173 8.9% 0.58 1692<br />
Ash 0.751 R Simple Tens. 412 15,464 7.64 0.72<br />
Ash 0.754 R Splintering tens. 462 17,160 8.5% 0.62 1726<br />
Ash 0.747 R Cross-grain Tens. 504 19,213 8.0% 0.69 2313<br />
Ash 0.757 R Splintering Tens. 527 19,331 11.85 0.64<br />
Ash 0.746 T Splintering Tens. 440 16,840 10.05 0.60<br />
Ash 0.749 T Simple Tens. 459 17,407 8.7% 0.58 2440<br />
Ash 0.755 T Splintering Tens. 522 19,303 7.41 0.68<br />
Ash 0.746 T Cross-grain Tens. 529 20,272 8.3% 0.65 2445<br />
9 17,463 Mean<br />
K Factor 2.142 2,507 Std. Dev.<br />
12,092 5% Exclusion<br />
Ash 0.995 R Simple Tens. 1062 17,145 6.43 0.67<br />
Ash 0.994 R Simple Tens. 1511 24,462 13.63 0.75<br />
Ash 0.996 T Cross-grain Tens. 1062 17,128 6.17 0.58<br />
Ash 0.997 T Cross-grain Tens. 1081 17,354 3.37 0.70<br />
4 19,022 Mean<br />
K Factor 2.681 3,628 Std. Dev.<br />
LOAD ON: 9,296 5% Exclusion<br />
75
Summary of Bending Tests: Last Revision: 8/11/97 Note: Formatting Changes<br />
ACTUAL LOAD BREAK YIELD F yb SG STIFFNESS<br />
SPECIES DIA (IN.) ORIENT. TYPE LOAD (lb) (psi) M.C. % (LB/IN)<br />
WO Face R Cross-grain Tens. 217 10,116<br />
WO Face R Cross-grain Tens. 250 11,654<br />
WO Face R Cross-grain Tens. 270 12,586<br />
WO Corner R Splintering Tens. 310 14,451<br />
WO Corner R Brash Tens. 315 14,684<br />
WO Face T Cross-grain Tens. 208 9,696<br />
WO Face T Cross-grain Tens. 275 12,819<br />
WO Corner T Cross-grain Tens. 305 14,218<br />
WO Face T Cross-grain Tens. 330 15,383<br />
WO Corner T Cross-grain Tens. 380 17,714<br />
10 13,332 Mean<br />
K Factor 2.104 2,460 Std. Dev.<br />
8,156 5% Exclusion<br />
WO Corner R Cross-grain Tens. 880 18,337<br />
WO Face R Cross-grain Tens. 900 18,753<br />
WO Corner R Cross-grain Tens. 915 19,066<br />
WO Corner R Cross-grain Tens. 930 19,378<br />
WO Corner R Cross-grain Tens. 1080 22,504<br />
WO Face T Cross-grain Tens. 900 18,753<br />
WO Face T Cross-grain Tens. 925 19,274<br />
WO Face T Splintering Tens. 950 19,795<br />
WO Corner T Cross-grain Tens. 955 19,899<br />
WO Face T Cross-grain Tens. 975 20,316<br />
10 19,608 Mean<br />
K Factor 2.104 1,181 Std. Dev.<br />
17,124 5% Exclusion<br />
Tests with no strength results:<br />
RO 1.014 T Splintering tens. 6.07 0.64<br />
RO 1.012 R Cross-grain tens. 5.36 0.68<br />
RO 1.236 T Cross-grain tens. 9.90 0.56<br />
RO 1.236 T Cross-grain tens. 9.61 0.53<br />
RO 1.231 R Cross-grain tens. 10.64 0.61<br />
WO 0.990 R Cross-grain tens. 10.54 0.66<br />
WO 0.991 T Cross-grain tens. 9.85 0.62<br />
WO 1.248 T Splintering tens. 9.98 0.65<br />
76
Appendix H Shear Test Data<br />
Summary of 3/4" Red Oak Shear Tests<br />
Sorted by Yield Stress<br />
Avg. Dia. Slope of No. Rings Span Load Yield Moisture Dry Defects<br />
Grain Per Inch Lengths Orientation Stress Content Specific<br />
(in.) (psi) Gravity<br />
0.749 1/12 12.0 1/4 D Radial 1,685 10.0% 0.55<br />
0.743 1/12 13.3 1/4 D Radial 1,806 10.0% 0.57<br />
0.742 1/12 8.0 1/4 D Radial 1,879 10.0% 0.63<br />
0.742 0/12 12.0 1/4 D Radial 1,954 10.4% 0.63<br />
0.747 1/12 9.3 1/4 D Radial 2,426 9.9% 0.72<br />
0.749 1/12 16.0 1/4 D Tangential 1,575 10.0% 0.46<br />
0.737 1/12 12.0 1/4 D Tangential 1,989 11.2% 0.62<br />
0.743 0/12 6.7 1/4 D Tangential 2,000 10.8% 0.59<br />
0.747 1/12 10.7 1/4 D Tangential 2,112 10.2% 0.61<br />
0.738 1/12 6.7 1/4 D Tangential 2,146 10.5% 0.66<br />
Mean 1,957<br />
Std. Dev. 243 K Factor 2.104<br />
5% Exclusion 1,446 1<br />
0.745 0/12 28.0 1/2 D Radial 1,422 10.4% 0.49<br />
0.750 1/12 12.0 1/2 D Radial 1,581 10.3% 0.54<br />
0.742 1/12 5.3 1/2 D Radial 1,730 10.7% 0.61 Growth rings chipped<br />
out near edges<br />
0.745 1/12 12.0 1/2 D Radial 1,850 10.4% 0.68<br />
0.745 0/12 24.0 1/2 D Radial 1,945 10.7% 0.60<br />
0.747 0/12 10.7 1/2 D Tangential 1,594 10.6% 0.54<br />
0.743 0/12 12.0 1/2 D Tangential 1,660 10.6% 0.59<br />
0.743 0/12 6.7 1/2 D Tangential 1,752 10.3% 0.59<br />
0.749 1/12 16.0 1/2 D Tangential 1,785 9.6% 0.61<br />
0.747 0/12 9.3 1/2 D Tangential 2,090 10.4% 0.66<br />
Mean 1,741<br />
Std. Dev. 192 K Factor 2.104<br />
5% Exclusion 1,336 1<br />
0.747 1/12 8.0 1 D Radial 1,270 10.3% 0.59<br />
0.741 1/12 9.3 1 D Radial 1,440 10.2% 0.60<br />
0.749 1/12 10.7 1 D Radial 1,650 10.1% 0.61<br />
0.742 0/12 5.3 1 D Radial 1,803 10.2% 0.68 Wood light color, but<br />
same grain type<br />
0.747 1/12 5.3 1 D Radial 1,908 10.5% 0.71<br />
0.745 1/12 14.0 1 D Tangential 1,318 9.6% 0.53<br />
0.747 1/12 10.0 1 D Tangential 1,388 10.0% 0.58<br />
0.749 0/12 13.3 1 D Tangential 1,563 10.1% 0.60<br />
0.743 1/12 15.0 1 D Tangential 1,611 10.2% 0.61<br />
0.745 1/12 9.3 1 D Tangential 1,629 10.4% 0.68<br />
Mean 1,558<br />
Std. Dev. 206 K Factor 2.104<br />
5% Exclusion 1,124 1<br />
1 From ASTM D 2915<br />
77
Summary of 1" Red Oak Shear Tests<br />
Sorted by Yield Stress<br />
Avg. Dia. Slope of No. Rings Span Load Yield Moisture Dry Dbl. Shear Defects<br />
Grain Per Inch Lengths Orientation Stress Content Specific Stiffness<br />
(in.) (in.) (psi) Gravity (lb/in)<br />
1.004 2/12 19.0 0.25 Radial 1,726 7.8% 0.55 92,247 Grain slope curves<br />
& steepens<br />
0.996 0/12 10.0 0.25 Radial 1,812 8.9% 0.63 87,276<br />
1.001 1/12 11.0 0.25 Radial 2,004 9.0% 0.60 102,899<br />
0.999 0/12 8.0 0.25 Radial 2,055 8.3% 0.65 83,869<br />
0.997 0/12 10.0 0.25 Radial 2,184 8.8% 0.65 129,443<br />
1.003 1/12 18.0 0.25 Tangential 1,618 9.1% 0.49 87,785<br />
1.003 1/12 12.0 0.25 Tangential 2,102 9.3% 0.61 90,256<br />
1.003 1/12 10.0 0.25 Tangential 2,363 8.9% 0.68 130,657 Chips missing out<br />
of sides<br />
1.003 1/12 9.0 0.25 Tangential 2,374 8.4% 0.61 71,411<br />
1.003 1/12 9.0 0.25 Tangential 2,385 8.8% 0.62 90,937<br />
Mean 2,062<br />
Std. Dev. 276 K Factor 2.104<br />
5% Exclusion 1,482 1<br />
1.003 1/12 12.0 0.50 Radial 1,596 8.3% 0.57 67,425<br />
0.995 0/12 9.0 0.50 Radial 1,761 8.7% 0.60 80,383<br />
1.001 1/12 13.0 0.50 Radial 1,796 8.5% 0.62 85,577<br />
1.008 1/12 13.3 0.50 Radial 1,813 8.7% 0.60 91,438<br />
0.999 1/12 6.0 0.50 Radial 1,949 8.7% 0.61 108,375<br />
1.010 1/12 29.3 0.50 Tangential 1,937 8.5% 0.54 73,974<br />
1.001 1/12 13.0 0.50 Tangential 1,947 8.3% 0.57 87,520<br />
0.999 1/12 13.0 0.50 Tangential 2,005 8.6% 0.60 82,318<br />
1.003 1/12 9.0 0.50 Tangential 2,223 8.4% 0.66 99,755<br />
1.004 1/12 10.0 0.50 Tangential 2,275 9.0% 0.71 106,427<br />
Mean 1,930<br />
Std. Dev. 206 K Factor 2.104<br />
5% Exclusion 1,497 1<br />
1.009 1/12 12.0 1.00 Radial 1,115 10.0% 0.50 56,124<br />
1.001 0/12 17.0 1.00 Radial 1,424 8.1% 0.57 58,719<br />
0.999 1/12 13.0 1.00 Radial 1,508 8.3% 0.62 49,176 Chips missing out<br />
of sides<br />
0.999 1/12 12.0 1.00 Radial 1,570 9.7% 0.63 58,113<br />
1.004 0/12 7.0 1.00 Radial 1,709 67,436<br />
0.996 0/12 18.0 1.00 Tangential 1,482 8.7% 0.58 53,847<br />
0.993 0/12 11.0 1.00 Tangential 1,582 8.1% 0.63 51,639<br />
0.996 1/12 9.0 1.00 Tangential 1,710 8.3% 0.66 45,301<br />
0.996 1/12 10.0 1.00 Tangential 1,723 9.0% 0.70 49,274<br />
1.000 1/12 11.0 1.00 Tangential 1,725 8.7% 0.66 42,859<br />
Mean 1,555<br />
Std. Dev. 190 K Factor 2.104<br />
5% Exclusion 1,155 1<br />
1 From ASTM D 2915<br />
78
Summary of 1-1/4" Red Oak Shear Tests<br />
Sorted by Yield Stress<br />
Avg. Dia. Slope of No. Rings Span Load Yield Moisture Dry Defects<br />
Grain Per Inch Lengths Orientation Stress Content Specific<br />
(in.) (psi) Gravity<br />
1.275 1/12 19.2 1/4 D Radial 1,734 15.9% 0.61 Wane - 1/2" max.<br />
1.270 1/12 14.4 1/4 D Radial 1,830 16.3% 0.63 Wane - 1/2" flat face<br />
1.271 1/12 14.4 1/4 D Radial 1,894 16.0% 0.75 Wane - 1/2" max. and 1/2" flat<br />
1.273 1/12 13.6 1/4 D Radial 2,070 16.6% 0.78 Wane - 5/8" max.<br />
1.257 1/12 14.4 1/4 D Radial 2,110 15.2% 0.75 Wane - 1/2" flat face<br />
1.275 1/12 28.0 1/4 D Tangential 1,359 14.5% 0.52<br />
1.266 0/12 6.4 1/4 D Tangential 1,682 15.0% 0.72<br />
1.254 1/12 13.6 1/4 D Tangential 1,967 14.3% 0.71 Wane - 1/2" max.<br />
1.255 0/12 8.0 1/4 D Tangential 2,057 14.8% 0.77 Wane - 1/2" flat face<br />
1.253 1/12 15.2 1/4 D Tangential 2,095 13.8% 0.76<br />
Mean 1,880<br />
Std. Dev. 238 K Factor 2.104<br />
5% Exclusion 1,379 1<br />
1.272 1/12 28.8 1/2 D Radial 1,195 15.9% 0.49<br />
1.255 1/12 18.4 1/2 D Radial 1,547 14.8% 0.60<br />
1.281 1/12 10.4 1/2 D Radial 1,725 16.2% 0.61<br />
1.255 1/12 14.4 1/2 D Radial 1,889 14.4% 0.68 Wane - 1/2" flat face<br />
1.254 1/12 8.8 1/2 D Radial 2,085 14.2% 0.67 Wane - 1/2" max. and 1/2" flat<br />
1.280 2/12 10.4 1/2 D Tangential 1,288 16.9% 0.67 Wane - 1/2" flat face<br />
1.255 1/12 12.0 1/2 D Tangential 1,340 14.8% 0.60<br />
1.251 0/12 11.2 1/2 D Tangential 1,363 14.3% 0.59 Wane - 1/2" flat face<br />
1.251 1/12 19.2 1/2 D Tangential 1,465 13.8% 0.51<br />
1.258 2/12 5.6 1/2 D Tangential 1,478 15.7% 0.72 Wane - 1/2" flat face<br />
Mean 1,537<br />
Std. Dev. 282 K Factor 2.104<br />
5% Exclusion 944 1<br />
1.281 1/12 15.2 1 D Radial 1,029 13.6% 0.54 Wane - 1/2" max. and 1/2" flat<br />
1.277 1/12 20.0 1 D Radial 1,063 13.5% 0.59 Wane - 1/2" flat face<br />
1.251 1/12 18.4 1 D Radial 1,236 13.6% 0.55<br />
1.275 1/12 18.4 1 D Radial 1,284 15.1% 0.70 Wane - 1/2" flat face<br />
1.258 1/12 11.2 1 D Radial 1,413 14.4% 0.64 Wane - 1/2" max.<br />
1.277 1/12 28.0 1 D Tangential 909 15.0% 0.53 Wane - 1/2" max.<br />
1.264 1/12 11.2 1 D Tangential 1,159 15.0% 0.68 Wane - 1/2" flat face<br />
1.255 1/12 15.2 1 D Tangential 1,171 14.0% 0.68 Wane - 1/2" flat face<br />
1.273 1/12 4.8 1 D Tangential 1,193 15.7% 0.74 Sm. 1/8" knot through upper third<br />
1.254 1/12 7.2 1 D Tangential 1,346 13.1% 0.68 Wane - 1/2" flat face<br />
Mean 1,180<br />
Std. Dev. 151 K Factor 2.104<br />
5% Exclusion 862 1<br />
1 From ASTM D 2915<br />
79
Summary of 3/4" White Oak Shear Tests<br />
Sorted By Yield Stress<br />
Avg. Dia. Slope of No. Rings Span Load Yield Moisture Dry Defects<br />
Grain Per Inch Lengths Orientation Stress Content Specific<br />
(in.) (in.) (psi) Gravity<br />
0.750 0/12 17.0 1/4D Radial 2,005 12.0% 0.63<br />
0.746 1/12 8.0 1/4D Radial 2,132 11.6% 0.61 2 pin dia. bore holes<br />
through section<br />
0.745 1/12 20.0 1/4D Radial 2,173 12.0% 0.68<br />
0.740 1/12 6.7 1/4D Radial 2,592 12.1% 0.73<br />
0.747 1/12 16.0 1/4D Radial 2,594 12.0% 0.71<br />
0.737 1/12 12.0 1/4D Tangential 1,925 11.8% 0.71<br />
0.750 1/12 13.3 1/4D Tangential 2,267 12.2% 0.71<br />
0.736 0/12 9.3 1/4D Tangential 2,283 12.7% 0.74<br />
0.749 1/12 8.0 1/4D Tangential 2,323 12.4% 0.75<br />
0.746 1/12 9.3 1/4D Tangential 2,366 12.3% 0.71<br />
Mean 2,266<br />
Std. Dev. 221 K Factor 2.104<br />
5% Exclusion 1,802 1<br />
0.743 1/12 10.7 1/2D Radial 2,003 11.8% 0.72<br />
0.736 1/12 8.0 1/2D Radial 1,860 12.1% 0.69<br />
0.749 0/12 12.0 1/2D Radial 1,951 11.9% 0.58<br />
0.746 1/12 8.0 1/2D Radial 2,120 9.7% 0.73<br />
0.737 1/12 1/2D Radial 2,293 12.2% 0.76<br />
0.729 0/12 12.0 1/2D Tangential 1,622 12.5% 0.64<br />
0.746 1/12 12.0 1/2D Tangential 1,863 12.5% 0.66<br />
0.717 1/12 20.0 1/2D Tangential 1,913 12.1% 0.63<br />
0.725 1/12 6.7 1/2D Tangential 1,985 11.6% 0.70<br />
0.730 1/12 8.0 1/2D Tangential 2,146 12.5% 0.71<br />
Mean 1,976<br />
Std. Dev. 185 K Factor 2.104<br />
5% Exclusion 1,587 1<br />
0.736 1/12 8.0 1D Radial 1,275 12.0% 0.68<br />
0.750 1/12 24.0 1D Radial 1,572 11.8% 0.61<br />
0.747 1/12 26.0 1D Radial 1,729 11.6% 0.67<br />
0.747 1/12 12.0 1D Radial 1,966 10.0% 0.76<br />
0.742 1/12 8.0 1D Radial 1,999 11.8% 0.74<br />
0.746 1/12 9.0 1D Tangential 1,186 11.9% 0.61<br />
0.749 1/12 13.3 1D Tangential 1,550 10.7% 0.61<br />
0.746 1/12 12.0 1D Tangential 1,581 11.5% 0.67<br />
0.747 1/12 13.0 1D Tangential 1,615 12.1% 0.66<br />
0.745 0/12 9.0 1D Tangential 1,693 11.4% 0.72<br />
Mean 1,617<br />
Std. Dev. 258 K Factor 2.104<br />
5% Exclusion 1,075 1<br />
1 From ASTM D 2915<br />
80
Summary of 1" White Oak Shear Tests<br />
Sorted by Yield Stress<br />
Avg. Dia. Slope of No. Rings Span Load Yield Moisture Dry Defects<br />
Grain Per Inch Lengths Orientation Stress Content Specific<br />
(in.) (in.) (psi) Gravity<br />
0.991 1/12 10.0 0.25 Radial 1,932 10.2% 0.59<br />
0.988 0/12 10.7 0.25 Radial 2,278 10.3% 0.62<br />
0.993 1/12 0.25 Radial 2,443 10.4% 0.68<br />
0.975 0/12 0.25 Radial 2,746 10.7% 0.77<br />
0.990 1/12 0.25 Radial 2,765 10.5% 0.74<br />
0.988 0/12 11.0 0.25 Tangential 1,915 9.6% 0.62<br />
0.991 1/12 9.0 0.25 Tangential 2,326 10.1% 0.73<br />
0.990 0/12 10.0 0.25 Tangential 2,365 10.1% 0.72<br />
0.984 0/12 10.7 0.25 Tangential 2,376 10.1% 0.72<br />
0.992 1/12 15.0 0.25 Tangential 2,459 9.6% 0.63<br />
0.979 1/12 6.7 0.25 Tangential 2,578 10.5% 0.78<br />
Mean 2,380<br />
Std. Dev. 276 K Factor 2.074<br />
5% Exclusion 1,808 1<br />
0.993 1/12 9.0 0.50 Radial 1,950 10.3% 0.68<br />
0.991 1/12 20.0 0.50 Radial 1,994 10.4% 0.59<br />
0.988 1/12 16.0 0.50 Radial 1,995 9.6% 0.62<br />
0.990 1/12 16.0 0.50 Radial 2,066 9.5% 0.64<br />
0.990 1/12 12.0 0.50 Radial 2,161 9.7% 0.62<br />
0.988 0/12 10.7 0.50 Tangential 1,805 10.0% 0.65<br />
0.991 0/12 9.3 0.50 Tangential 1,829 9.9% 0.64<br />
0.992 2/12 12.0 0.50 Tangential 2,014 9.4% 0.66 Chips missing out of<br />
sides<br />
0.980 1/12 6.7 0.50 Tangential 2,179 10.0% 0.77<br />
0.990 1/12 9.3 0.50 Tangential 2,315 9.6% 0.64<br />
Mean 2,031<br />
Std. Dev. 157 K Factor 2.104<br />
5% Exclusion 1,700 1<br />
1.000 1/12 19.0 1.00 Radial 1,310 10.0% 0.52<br />
0.984 1/12 9.3 1.00 Radial 1,635 10.7% 0.63<br />
0.990 1/12 8.0 1.00 Radial 1,863 10.7% 0.68<br />
0.992 0/12 12.0 1.00 Radial 1,934 10.8% 0.70<br />
0.992 1/12 10.7 1.00 Radial 1,974 10.8% 0.74<br />
0.987 0/12 11.0 1.00 Tangential 1,408 10.4% 0.59<br />
0.979 1/12 10.0 1.00 Tangential 1,429 10.7% 0.66<br />
0.987 1/12 11.0 1.00 Tangential 1,629 10.5% 0.67<br />
0.986 1/12 10.0 1.00 Tangential 1,630 10.3% 0.69<br />
0.993 0/12 1.00 Tangential 1,869 10.1% 0.72<br />
Mean 1,668<br />
Std. Dev. 236 K Factor 2.104<br />
5% Exclusion 1,173 1<br />
1 From ASTM D 2915<br />
81
Summary of 1 1/4" White Oak Shear Tests<br />
Sorted By Yield Stress<br />
Avg. Dia. Slope of No. Rings Span Load Yield Moisture Dry Defects<br />
Grain Per Inch Lengths Orientation Stress Content Specific<br />
(in.) (in.) (psi) Gravity<br />
1.245 1/12 8.0 1/4D Radial 2,017 13.7% 0.68 Wane - 1/2" flat face<br />
1.242 0/12 11.2 1/4D Radial 2,088 13.4% 0.65 Wane - 1/2" flat face<br />
1.242 0/12 21.6 1/4D Radial 2,159 13.2% 0.67 Wane - 1/2" max.<br />
1.242 0/12 20.8 1/4D Radial 2,192 13.3% 0.74 Wane - 1/2" max. 1/8"<br />
knot through shear plane<br />
1.243 1/12 8.8 1/4D Radial 2,275 13.5% 0.75 Wane - 1/2" flat face<br />
1.250 0/12 16.8 1/4D Tangential 1,877 13.9% 0.64 Wane - 1/2" max.<br />
1.242 0/12 13.6 1/4D Tangential 1,900 13.9% 0.68 Wane - 1/2" flat face<br />
1.246 0/12 28.0 1/4D Tangential 2,007 13.4% 0.66 Wane - 1/2" flat face<br />
1.243 1/12 5.6 1/4D Tangential 2,088 13.5% 0.73 Wane - 1/2" max.<br />
1.242 0/12 19.2 1/4D Tangential 2,291 14.0% 0.79 Wane - 1/2" max.<br />
Mean 2,090<br />
Std. Dev. 143 K Factor 2.104<br />
5% Exclusion 1,789 1<br />
1.241 1/12 6.4 1/2D Radial 1,863 14.0% 0.71 Wane - 1/2" flat face<br />
1.238 1/12 10.4 1/2D Radial 1,883 14.2% 0.72 Wane - 1/2" flat face<br />
1.242 1/12 1/2D Radial 1,973 13.7% 0.68 Wane - 1/2" flat face<br />
1.233 1/12 13.6 1/2D Radial 2,124 13.8% 0.74 Wane - 1/2" flat face<br />
1.237 1/12 11.2 1/2D Radial 2,228 13.7% 0.81 Wane - 1/2" flat face<br />
1.241 1/12 18.4 1/2D Tangential 1,514 14.2% 0.60 Wane - 1/2" flat face<br />
1.233 0/12 20.0 1/2D Tangential 1,620 13.7% 0.63 Wane - 3/8" flat face<br />
1.243 1/12 22.4 1/2D Tangential 1,819 13.5% 0.66 Wane - 1/2" flat face<br />
1.240 1/12 25.6 1/2D Tangential 1,893 13.6% 0.69 Wane - 1/2" flat face<br />
1.241 1/12 20.0 1/2D Tangential 1,965 13.7% 0.75 Wane - 1/2" flat face<br />
Mean 1,888<br />
Std. Dev. 211 K Factor 2.104<br />
5% Exclusion 1,443 1<br />
1.243 1/12 23.2 1D Radial 1,635 13.1% 0.67 Wane - 1/2" flat (2 sides)<br />
1.243 1/12 12.0 1D Radial 1,667 13.3% 0.71<br />
1.243 0/12 16.8 1D Radial 1,686 13.2% 0.67 Wane - 1/2" max.<br />
1.243 1/12 7.2 1D Radial 1,695 11.9% 0.66 Wane - 1/2" max. (2<br />
sides)<br />
1.247 1/12 12.8 1D Radial 1,756 13.8% 0.73 Wane - 1/2" flat face<br />
1.237 1/12 24.0 1D Tangential 1,487 13.2% 0.67 Wane - 1/2" flat face<br />
1.238 1/12 1D Tangential 1,213 13.1% 0.55<br />
1.242 2/12 7.2 1D Tangential 1,402 12.9% 0.70 Wane - 1/2" max. Burl<br />
wood at big end<br />
1.240 1/12 7.2 1D Tangential 1,525 13.6% 0.67 Wane - 1/2" flat face<br />
1.240 0/12 25.6 1D Tangential 1,528 13.9% 0.75 Wane - 1/2" flat face<br />
Mean 1,559<br />
Std. Dev. 164 K Factor 2.104<br />
5% Exclusion 1,214 1<br />
1 From ASTM D 2915<br />
82
Appendix I Dowel Bearing Data<br />
Summary of Dowel Bearing Tests<br />
RO Pegs, RDF-LT Base<br />
Sorted By Yield Stress<br />
Peg Avg. Peg Grain Peg Base Yield Peg Peg Base Base Stiffness Peg / Base Defects<br />
Orient. Dia. Slope Rings Rings Stress Moisture Dry Moisture Dry<br />
(in.) / Inch / Inch (psi) Content SG Content SG (lb/in)<br />
R 1.010 1/12 17.0 25.0 1,714 11.9% 0.54 12.9% 0.47 62,386<br />
R 1.014 1/12 12.0 23.0 1,856 11.3% 0.61 12.5% 0.51 50,599<br />
R 1.025 0/12 18.0 16.0 1,927 11.3% 0.55 12.9% 0.47 57,576<br />
R 1.009 1/12 10.0 11.0 2,001 11.3% 0.62 13.2% 0.48 63,738<br />
R 1.007 0/12 9.0 13.0 2,607 11.7% 0.68 13.2% 0.47 107,832<br />
T 1.010 0/12 13.0 17.0 1,874 11.7% 0.56 13.3% 0.47 60,118<br />
T 1.010 0/12 12.0 16.0 1,930 11.4% 0.55 13.0% 0.47 49,439<br />
T 1.012 1/12 11.0 13.0 2,189 11.7% 0.64 12.4% 0.47 73,504<br />
T 1.017 0/12 12.0 22.0 2,251 11.6% 0.67 12.5% 0.47 54,083<br />
T 1.017 0/12 11.0 13.0 2,347 10.7% 0.59 12.5% 0.48 60,545<br />
Mean 2,070<br />
Std. Dev. 272 K Factor 2.104<br />
5% Exclusion 1,497 1<br />
1 From ASTM D 2915<br />
Summary of Embedment Tests<br />
RO Pegs, RDF-RT Base<br />
Sorted By Yield Stress<br />
Peg Avg. Peg Grain Peg Base Yield Peg Peg Base Base Stiffness Peg / Base Defects<br />
Orient. Dia. Slope Rings Rings Stress Moisture Dry Moisture Dry<br />
(in.) / Inch / Inch (psi) Content SG Content SG<br />
R 1.010 0/12 8.0 11.0 1,604 12.2% 0.65 11.9% 0.50 32,855<br />
R 1.012 0/12 19.0 10.0 1,899 11.6% 0.53 11.6% 0.47 44,055<br />
R 1.014 2/12 9.0 9.0 1,937 11.6% 0.63 11.4% 0.47 46,152<br />
R 1.009 1/12 22.4 21.0 1,617 11.1% 0.56 11.1% 0.47 22,833<br />
R 1.013 1/12 8.0 22.0 1,585 11.3% 0.67 11.0% 0.48 29,617<br />
Mean 1,728<br />
Std. Dev. 174 K Factor 2.464<br />
5% Exclusion 1,300 1<br />
1 From ASTM D 2915<br />
83
Summary of Embedment Tests<br />
RO Pegs, EWP-LT Base<br />
Sorted By Yield Stress<br />
Peg Avg. Peg Grain Peg Base Yield Peg Peg Base Base Stiffness Peg / Base Defects<br />
Orient. Dia. Slope Rings Rings Stress Moisture Dry Moisture Dry<br />
(in.) / Inch / Inch (psi) Content SG Content SG (lb/in)<br />
R 1.022 0/12 11.0 6.0 2,152 11.1% 0.61 11.9% 0.40 65,809<br />
R 1.004 0/12 12.0 9.0 2,228 11.7% 0.58 12.3% 0.35 62,972<br />
R 1.004 0/12 7.0 9.0 2,235 11.5% 0.67 11.8% 0.35 48,147<br />
R 1.007 0/12 14.0 6.0 2,398 11.7% 0.54 12.2% 0.34 71,865<br />
R 1.014 0/12 7.0 5.0 2,414 12.0% 0.62 12.6% 0.40 67,209<br />
T 1.013 1/12 16.0 6.0 1,944 11.7% 0.57 11.6% 0.34 62,873<br />
T 1.014 0/12 11.0 7.0 2,262 15.4% 0.68 13.0% 0.39 49,307<br />
T 1.013 1/12 13.0 8.0 2,309 11.8% 0.59 12.0% 0.37 73,168<br />
T 1.005 0/12 11.0 6.0 2,342 11.8% 0.60 12.3% 0.37 54,844<br />
T 1.009 0/12 9.0 6.0 2,483 12.0% 0.67 12.5% 0.36 65,005<br />
Mean 2,277<br />
Std. Dev. 153 K Factor 2.104<br />
5% Exclusion 1,954 1<br />
1 From ASTM D 2915<br />
Summary of Embedment Tests<br />
RO Pegs, EWP-RT Base<br />
Sorted By Yield Stress<br />
Peg Avg. Peg Grain Peg Base Yield Peg Peg Base Base Stiffness Peg / Base Defects<br />
Orient. Dia. Slope Rings Rings Stress Moisture Dry Moisture Dry<br />
(in.) / Inch / Inch (psi) Content SG Content SG (lb/in)<br />
R 1.021 1/12 15.0 10.0 1,289 11.7% 0.55 12.7% 0.38 20,530<br />
R 1.000 0/12 8.0 10.0 1,309 12.0% 0.68 12.4% 0.32 24,077<br />
R 1.008 0/12 16.0 5.0 1,434 12.0% 0.61 12.8% 0.35 23,757<br />
R 1.007 0/12 11.0 7.0 1,453 11.7% 0.61 13.2% 0.35 19,708<br />
R 1.016 0/12 11.0 7.0 1,705 12.3% 0.59 13.5% 0.32 35,807<br />
T 1.014 1/12 8.0 7.0 1,447 11.5% 0.62 11.5% 0.40 18,830<br />
T 1.008 1/12 13.0 7.0 1,453 11.4% 0.65 12.2% 0.35 28,350<br />
T 1.005 0/12 10.0 6.0 1,485 10.7% 0.56 10.7% 0.33 24,393 Tree center below<br />
bearing area<br />
T 1.021 1/12 17.0 6.0 1,542 11.9% 0.59 11.9% 0.37 25,598<br />
T 1.009 1/12 8.0 7.0 1,578 11.3% 0.62 11.2% 0.39 28,724<br />
Mean 1,469<br />
Std. Dev. 122 K Factor 2.104<br />
5% Exclusion 1,213 1<br />
1 From ASTM D 2915<br />
84
Bibliography<br />
Abe M., and Kawaguchi, M., (1995). “Structural Development of the Japanese <strong>Timber</strong><br />
Pagoda,” Structural <strong>Engineering</strong> International 5(4), 241-243.<br />
American Forest & Paper Association (1991). “National Design Specification for Wood<br />
Construction,” American Forest & Paper Association (AFPA), Washington, DC.<br />
ASTM, (1995a). 1995 Annual Book of ASTM Standards, 04.10 Wood, Philadelphia, PA.<br />
ASTM, (1995b). “Standard Method for Evaluating Dowel Bearing Strength of Wood and<br />
Wood-Base Products,” Draft 10, January 1995.<br />
Aune P., and Patton-Mallory, M., (1986). “Lateral Load-Bearing Capacity of Nailed Joints<br />
Based on the Yield Theory.” No. FPL-469, Forest Products Laboratory, U.S. Dept. of<br />
Agriculture, Washington, DC.<br />
Benson, T. and Gruber, J., (1980). “Building the <strong>Timber</strong> <strong>Frame</strong> House, The Revival of a<br />
Forgotten Craft,” Charles Schribner’s Sons, New York.<br />
Benson, T. (1997). “The <strong>Timber</strong>-<strong>Frame</strong> Home - Design, Construction, Finishing,” Second<br />
Edition, Taunton Press, Inc., 4-22.<br />
Bulleit, W. M., Sandberg, L. B., O’Bryant, T. L., Weaver, D. A., and Pattison, W. E., (1996).<br />
“Analysis of <strong>Frame</strong>s with Traditional <strong>Timber</strong> Connections,” Proceedings, International<br />
Wood <strong>Engineering</strong> Conference, New Orleans, LA. 4, 232-239.<br />
Brungraber, R. L. (1992a). “Engineered <strong>Tension</strong> <strong>Joinery</strong>,” <strong>Timber</strong> Framing. 23, 10-12.<br />
Brungraber, R. L. (1992b). “Assessing Capacities of Traditional <strong>Timber</strong> Connections,” Wood<br />
Design Focus. 3(4), 17-21.<br />
Brungraber, R. L. (1985). “Traditional <strong>Timber</strong> <strong>Joinery</strong>: A Modern Analysis,” Ph.D.<br />
Dissertation, Stanford University, Palo Alto, California.<br />
Brungraber, R. L., and Morse-Fortier, L., (1996). “Wooden Peg Tests - Their Behavior and<br />
Capacities as Used in Town Lattice Trusses,” Contract Report to Vermont Department<br />
of Transportation, Contract No. TH 9290 - Long Term Covered Bridge Study, March.<br />
Charles, F. W. B. (1984). “Conservation of <strong>Timber</strong> Buildings,” Hutchinson & Co.<br />
(Publishers) Ltd., 10-12.<br />
Church, J. R. (1995). “Characterization of Factors Influencing the Bearing Strength of<br />
Wood Pegged Connections,” M.S. Thesis, University of Idaho.<br />
Church, J. R. and Tew, B. W. (1997). “Characterization of Bearing Strength Factors in<br />
Pegged <strong>Timber</strong> Connections,” Journal of Structural <strong>Engineering</strong>, March 1997, 326-332.<br />
Duff, S. F., Black, R. G., Mahin, S. A., and Blondet, M. (1996). “Parameter Study of an<br />
Internal <strong>Timber</strong> <strong>Tension</strong> Connections,” Journal of Structural <strong>Engineering</strong>, 122(4), 446-452.<br />
Eckelman, C. A. (1970). “How to Design Dowel Joints,” Research Progress Report, Purdue<br />
University, Agricultural Experiment Station, 7 p.<br />
Eckelman, C. A. (1979). “Out-of-Plane Strength and Stiffness of Dowel Joints,” Forest<br />
Products Journal, 29(8), 32-38.<br />
Elliot, S. and Wallas, E., (1977). “The <strong>Timber</strong> Framing Book,” Housesmiths Press, 1-4.<br />
85
Hewett, Cecil A., (1980). “English Historic Carpentry,” Phillimore and Co., Glossary.<br />
Hill, M. D. and Eckelman, C. A., (1973). “Flexibility and Bending Strength of Mortise and<br />
Tenon Joints,” Furniture Design and Manufacturing, January, 54-60.<br />
Hoadley, R. B. (1980). “Understanding Wood - A Craftsman’s Guide to Wood<br />
Technology,” The Taunton Press, 1-17.<br />
Johansen, K. W. (1949). “Theory of <strong>Timber</strong> Connections,” International Association for<br />
Bridge and Structural <strong>Engineering</strong>, 9, 249-262.<br />
Kessel, M. H. (1988). “The Reconstruction of an Eight-Floor <strong>Timber</strong> <strong>Frame</strong> House at<br />
Hildesheim (FRG),” Proceedings, 1988 International Conference on <strong>Timber</strong> <strong>Engineering</strong>,<br />
Seattle, WA, 415-421.<br />
Kessel, (1996). - Personal communication with Dr. Richard Schmidt<br />
King, W. S., Yen, J. Y. R., and Yen, Y. N. A., (1996). “Joint Characteristics of Traditional<br />
Chinese Wooden <strong>Frame</strong>s,” <strong>Engineering</strong> Structures, 18(8), 635-644.<br />
Larsen, H. J. (1973). “The Yield Load of Bolted and Nailed Joints,” Proceedings of the<br />
International Union of Forestry Research Organization—Division V Conference, 645-654.<br />
Macmillan, Inc. (1996). “Webster’s New World Dictionary and Thesaurus,” Macmillan, Inc.<br />
135.<br />
McLain, T. E., and Thangjitham, S., (1983). “Bolted Wood-Joint Yield Model,” Journal of<br />
Structural <strong>Engineering</strong>. 109(8), 1820-1835.<br />
Peavy, M. D., and Schmidt, R. J. (1995). “Load Behavior of Connections With Oak Pegs”,<br />
<strong>Timber</strong> Framing. 38, 6-9. Translation of: Kessel, M. H., and Augustin, R., 1990,<br />
“Untersuchungen über das Tragverhalten von Verbindungen mit Eichenholznägeln,”<br />
Bauen mit Holz, 246-250, April.<br />
Peavy, M. D., and Schmidt, R. J. (1996). “Load Bearing Capacity of <strong>Timber</strong> Connections<br />
with Wood Pegs”, <strong>Timber</strong> Framing. 39, 8-11. Translation of: Kessel, M. H., and Augustin,<br />
R., 1994. “Untersuchungen der Tragfähigkeit von Holzverbindungen mit Holznägeln<br />
für Sanierung und Rekonstruktion alter Bausubstanz,” Bauen mit Holz, 484-487, June.<br />
Sandberg, L. B., Bulleit, W. M., O’Bryant, T. L., Postlewaite, J. J., and Schaffer, J. J.(1996).<br />
“Experimental Evaluation of Traditional <strong>Timber</strong> Connections,” Proceedings, International<br />
Wood <strong>Engineering</strong> Conference, New Orleans, LA., 4, 225-231.<br />
Schmidt, R. J., MacKay, R. B., and Leu, B. L. (1996). “Design of Joints in Traditional<br />
<strong>Timber</strong> <strong>Frame</strong> Buildings,” Proceedings, International Wood <strong>Engineering</strong> Conference, New<br />
Orleans, LA. 4, 240-247.<br />
Seike, K. (1977). “The Art of Japanese <strong>Joinery</strong>,” New York: J. Weatherhill.<br />
Sobon, J., and Schroeder, R. (1984). “<strong>Timber</strong> <strong>Frame</strong> Construction,” Garden Way Publishing,<br />
3-15.<br />
Sobon, J. (1994). “Build a Classic <strong>Timber</strong>-<strong>Frame</strong>d House,” Garden Way Publishing.<br />
Soltis, L. A., Hubbard, F. K. and Wilkinson, T. L. (1986). “Bearing Strength of Bolted<br />
<strong>Timber</strong> Joints,” Journal of Structural <strong>Engineering</strong>, 112(9), 2141-2154.<br />
86
Soltis, L. A.; Karnasudirdja, S.; Little, J. K. (1987). “Angle to Grain Strength of Dowel–type<br />
Fasteners.” Wood and Fiber Science. 19(1), 68-80.<br />
Soltis, L. A., and Wilkinson, T. L. (1987). “Bolted-Connection Design.” No. FPL-GTR-54,<br />
Forest Products Laboratory, U.S. Dept. of Agriculture, Washington, DC.<br />
Soltis, L. A. (1994). “Bolted Connection Research: Present and Future.” Wood Design Focus,<br />
Summer 1994, 5(2), 3-5.<br />
Thangjitham, S. (1981). “A Method of Evaluating The Probabilistic Resistance of Bolted<br />
Wood Joints”, Master’s Thesis, Virginia Polytechnic Institute and State University,<br />
Blacksburg, Virginia.<br />
87