Executive Summary School Accountability Report Card, 2011–12
Executive Summary School Accountability Report Card, 2011–12
Executive Summary School Accountability Report Card, 2011–12

Create successful ePaper yourself
Turn your PDF publications into a flip-book with our unique Google optimized e-Paper software.
<strong>Executive</strong> <strong>Summary</strong> <strong>School</strong> <strong>Accountability</strong> <strong>Report</strong> <strong>Card</strong>,<br />
<strong>2011–12</strong><br />
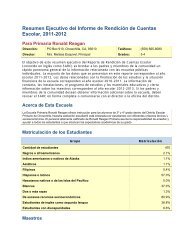
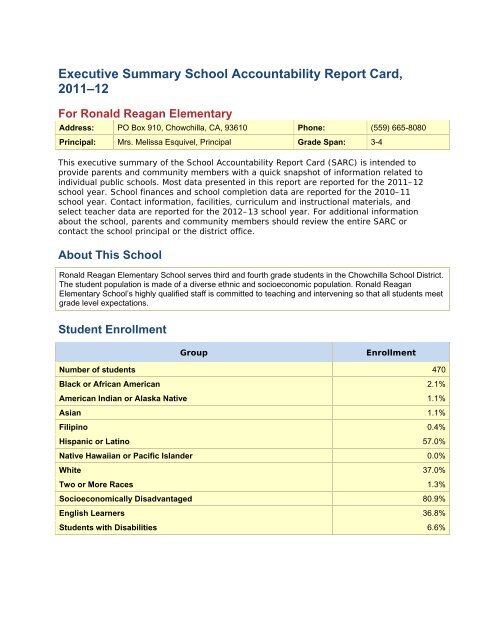
For Ronald Reagan Elementary<br />
Address: PO Box 910, Chowchilla, CA, 93610 Phone: (559) 665-8080<br />
Principal: Mrs. Melissa Esquivel, Principal Grade Span: 3-4<br />
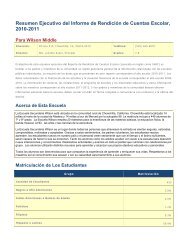
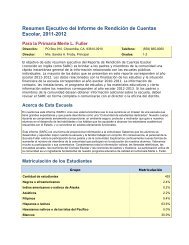
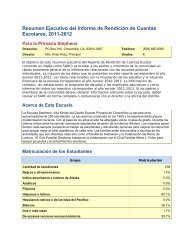
This executive summary of the <strong>School</strong> <strong>Accountability</strong> <strong>Report</strong> <strong>Card</strong> (SARC) is intended to<br />
provide parents and community members with a quick snapshot of information related to<br />
individual public schools. Most data presented in this report are reported for the <strong>2011–12</strong><br />
school year. <strong>School</strong> finances and school completion data are reported for the 2010–11<br />
school year. Contact information, facilities, curriculum and instructional materials, and<br />
select teacher data are reported for the 2012–13 school year. For additional information<br />
about the school, parents and community members should review the entire SARC or<br />
contact the school principal or the district office.<br />
About This <strong>School</strong><br />
Ronald Reagan Elementary <strong>School</strong> serves third and fourth grade students in the Chowchilla <strong>School</strong> District.<br />
The student population is made of a diverse ethnic and socioeconomic population. Ronald Reagan<br />
Elementary <strong>School</strong>’s highly qualified staff is committed to teaching and intervening so that all students meet<br />
grade level expectations.<br />
Student Enrollment<br />
Group<br />
Enrollment<br />
Number of students 470<br />
Black or African American 2.1%<br />
American Indian or Alaska Native 1.1%<br />
Asian 1.1%<br />
Filipino 0.4%<br />
Hispanic or Latino 57.0%<br />
Native Hawaiian or Pacific Islander 0.0%<br />
White 37.0%<br />
Two or More Races 1.3%<br />
Socioeconomically Disadvantaged 80.9%<br />
English Learners 36.8%<br />
Students with Disabilities 6.6%
Teachers<br />
Indicator<br />
Teachers<br />
Teachers with full credential 19<br />
Teachers without full credential 0<br />
Teachers Teaching Outside Subject Area of Competence 0<br />
Misassignments of Teachers of English Learners 0<br />
Total Teacher Misassignments 0<br />
Student Performance<br />
Subject<br />
Students Proficient and Above on STAR* Program Results<br />
English-Language Arts 47%<br />
Mathematics 60%<br />
Science 0%<br />
History-Social Science 0%<br />
*Standardized Testing and <strong>Report</strong>ing Program assessments used for accountability purposes include<br />
the California Standards Tests, the California Modified Assessment, and the California Alternate<br />
Performance Assessment.<br />
Academic Progress*<br />
Indicator<br />
Result<br />
2012 Growth API Score (from 2012 Growth API <strong>Report</strong>) 783<br />
Statewide Rank (from 2011 Base API <strong>Report</strong>) 3<br />
Met All 2012 AYP Requirements<br />
Number of AYP Criteria Met Out of the Total Number of Criteria Possible Met 16 of 21<br />
2012–13 Program Improvement Status (PI Year) Year 4<br />
*The Academic Performance Index is required under state law. Adequate Yearly Progress is required<br />
by federal law.<br />
no<br />
<strong>School</strong> Facilities <strong>Summary</strong> of Most Recent Site Inspection<br />
The most recent site inspection took place in August of 2012. Fifteen components were inspected<br />
throughout the 6 areas which make up the campus. Repairs were required in none of the components. The<br />
school’s overall ranking was “Good”. As per the Williams Settlement Legislation, Ronald Reagan Elementary<br />
facilities are in good repair. They are clean, safe, and functional. Classrooms and restrooms are cleaned<br />
daily. Our District has a work order process in place that ensures efficient service and that repairs are<br />
completed in a timely manner.
Repairs Needed<br />
None at this time.<br />
Corrective Actions Taken or Planned<br />
None at this time.<br />
Curriculum and Instructional Materials<br />
Core Curriculum Area<br />
Pupils Who Lack Textbooks and Instructional Materials<br />
Reading/Language Arts 0%<br />
Mathematics 0%<br />
Science 0%<br />
History-Social Science 0%<br />
<strong>School</strong> Finances<br />
Level<br />
Expenditures Per Pupil (Unrestricted Sources Only)<br />
<strong>School</strong> Site $5,095.57<br />
District $6,915.81<br />
State $5,455<br />
<strong>School</strong> <strong>Accountability</strong> <strong>Report</strong> <strong>Card</strong><br />
<strong>Report</strong>ed Using Data from the <strong>2011–12</strong> <strong>School</strong> Year<br />
Published During 2012–13<br />
Every school in California is required by state law to publish a <strong>School</strong> <strong>Accountability</strong> <strong>Report</strong><br />
<strong>Card</strong> (SARC), by February 1 of each year. The SARC contains information about the<br />
condition and performance of each California public school.<br />
<br />
<br />
For more information about SARC requirements, see the California Department of<br />
Education (CDE) SARC Web page at http://www.cde.ca.gov/ta/ac/sa/.<br />
For additional information about the school, parents and community members should<br />
contact the school principal or the district office.<br />
I. Data and Access<br />
Ed-Data Partnership Web Site
Ed-Data is a partnership of the CDE, EdSource, and the Fiscal Crisis and Management<br />
Assistance Team (FCMAT) that provides extensive financial, demographic, and performance<br />
information about California’s public kindergarten through grade twelve school districts and<br />
schools.<br />
DataQuest<br />
DataQuest is an online data tool located on the CDE DataQuest Web page at<br />
http://dq.cde.ca.gov/dataquest/ that contains additional information about this school and<br />
comparisons of the school to the district, the county, and the state. Specifically, DataQuest<br />
is a dynamic system that provides reports for accountability (e.g., state Academic<br />
Performance Index [API], federal Adequate Yearly Progress [AYP]), test data, enrollment,<br />
high school graduates, dropouts, course enrollments, staffing, and data regarding English<br />
learners.<br />
Internet Access<br />
Internet access is available at public libraries and other locations that are publicly accessible<br />
(e.g., the California State Library). Access to the Internet at libraries and public locations is<br />
generally provided on a first-come, first-served basis. Other use restrictions may include the<br />
hours of operation, the length of time that a workstation may be used (depending on<br />
availability), the types of software programs available on a workstation, and the ability to<br />
print documents.<br />
II. About This <strong>School</strong><br />
Contact Information (<strong>School</strong> Year 2012–13)<br />
<strong>School</strong><br />
District<br />
<strong>School</strong> Name Ronald Reagan Elementary District Name Chowchilla Elementary<br />
Street PO Box 910 Phone Number (559) 665-8000<br />
City, State, Zip Chowchilla, CA, 93610 Web Site www.chowchillaelem.k12.ca.us<br />
Phone Number (559) 665-8080 Superintendent Charles Martin<br />
Principal Mrs. Melissa Esquivel, Principal E-mail Address martinc@chowkids.com<br />
E-mail Address esquivelm@chowkids.com CDS Code 20651930113076<br />
<strong>School</strong> Description and Mission Statement (<strong>School</strong> Year <strong>2011–12</strong>)<br />
Like the mission of the Chowchilla Elementary <strong>School</strong> District, our mission is to provide each student a<br />
superior education in a safe and positive climate that promotes high academic performance, personal<br />
responsibility and respect for self and others.<br />
Opportunities for Parental Involvement (<strong>School</strong> Year <strong>2011–12</strong>)<br />
Ronald Reagan Elementary <strong>School</strong> encourages parent involvement. Parents are an important part in a<br />
child’s education. Parents are invited to visit and volunteer in the classroom as well as participate in Family<br />
Club, <strong>School</strong> Site Council (SSC), and the English Learner Advisory Committee (ELAC), Fall and Spring<br />
Conferences, Open House, and Back-to-<strong>School</strong> Night.<br />
For more information on how to become involved, contact Melissa Esquivel, Principal at (559) 665-8080.
Student Enrollment by Grade Level (<strong>School</strong> Year <strong>2011–12</strong>)<br />
Grade Level Number of Students Grade Level Number of Students<br />
Kindergarten 0 Grade 8 0<br />
Grade 1 0 Ungraded Elementary 0<br />
Grade 2 0 Grade 9 0<br />
Grade 3 227 Grade 10 0<br />
Grade 4 243 Grade 11 0<br />
Grade 5 0 Grade 12 0<br />
Grade 6 0 Ungraded Secondary 0<br />
Grade 7 0 Total Enrollment 470<br />
Student Enrollment by Student Group (<strong>School</strong> Year 2011-12)<br />
Group<br />
Percent of Total Enrollment<br />
Black or African American 2.1%<br />
American Indian or Alaska Native 1.1%<br />
Asian 1.1%<br />
Filipino 0.4%<br />
Hispanic or Latino 57.0%<br />
Native Hawaiian or Pacific Islander 0.0%<br />
White 37.0%<br />
Two or More Races 1.3%<br />
Socioeconomically Disadvantaged 80.9%<br />
English Learners 36.8%<br />
Students with Disabilities 6.6%<br />
Average Class Size and Class Size Distribution (Elementary)<br />
Grade<br />
Level<br />
Avg.<br />
Class<br />
Size<br />
1-<br />
20<br />
2009–10<br />
Number of<br />
Classes*<br />
21-<br />
32<br />
33+<br />
Avg.<br />
Class<br />
Size<br />
1-<br />
20<br />
2010–11<br />
Number of<br />
Classes*<br />
21-<br />
32<br />
33+<br />
Avg.<br />
Class<br />
Size<br />
1-<br />
20<br />
<strong>2011–12</strong><br />
Number of<br />
Classes*<br />
21-<br />
32<br />
33+<br />
3 20.5 12 20.6 12 0 0 20.3 11 0 0<br />
4 26 8 31.5 0 8 0 27.3 1 8 0<br />
Other 20.5 12<br />
* Number of classes indicates how many classes fall into each size category (a range of total students<br />
per classroom).
III. <strong>School</strong> Climate<br />
<strong>School</strong> Safety Plan (<strong>School</strong> Year <strong>2011–12</strong>)<br />
Ronald Reagan Elementary <strong>School</strong> is committed to providing a safe learning environment. Four custodians,<br />
as well as the District’s grounds crews, maintain Ronald Reagan Elementary <strong>School</strong>. The main custodian<br />
inspects the school on a regular basis to ensure a safe learning environment. Staff and students participate<br />
in ongoing fire and earthquake drills as well as lockdown protocols.<br />
The <strong>School</strong> Safety Plan was reviewed, updated, and discussed with the school faculty in May 2012.<br />
Suspensions and Expulsions<br />
Rate*<br />
<strong>School</strong><br />
2009–10<br />
<strong>School</strong><br />
2010–11<br />
<strong>School</strong><br />
<strong>2011–12</strong><br />
District<br />
2009–10<br />
District<br />
2010–11<br />
District<br />
<strong>2011–12</strong><br />
Suspensions 9.33% 8.82% 15.53% 15.34% 18.17% 17.83%<br />
Expulsions 0.00% 0.00% 0.00% 0.70% 0.34% 0.53%<br />
* The rate of suspensions and expulsions is calculated by dividing the total number of incidents by the<br />
total enrollment.<br />
IV. <strong>School</strong> Facilities<br />
<strong>School</strong> Facility Conditions and Planned Improvements (<strong>School</strong> Year 2012–13)<br />
Ronald Reagan Elementary sits on 10 acres. The campus contains 27 classrooms and 16 restrooms. The<br />
county added a portable during the 2008-2009 school year. The school’s grounds, buildings and restrooms<br />
are in good repair. Routine maintenance was performed throughout the site.<br />
<strong>School</strong> Facility Good Repair Status (<strong>School</strong> Year 2012–13)<br />
System Inspected<br />
Systems: Gas Leaks,<br />
Mechanical/HVAC, Sewer<br />
Interior: Interior Surfaces<br />
Cleanliness: Overall Cleanliness,<br />
Pest/ Vermin Infestation<br />
Electrical: Electrical<br />
Restrooms/Fountains: Restrooms,<br />
Sinks/ Fountains<br />
Safety: Fire Safety, Hazardous<br />
Materials<br />
Structural: Structural Damage, Roofs<br />
Repair Status<br />
Exemplary Good Fair Poor<br />
X<br />
X<br />
X<br />
X<br />
X<br />
X<br />
X<br />
Repair Needed and<br />
Action Taken or<br />
Planned<br />
Refrigeration Unit Repaired<br />
Squirrel Holes/ working with<br />
pest management
External: Playground/<strong>School</strong> Grounds,<br />
Windows/ Doors/Gates/Fences<br />
X<br />
Sprinkler leaks - repaired<br />
Overall Rating<br />
Good<br />
Note: Cells shaded in black do not require data.<br />
V. Teachers<br />
Teacher Credentials<br />
Teachers<br />
<strong>School</strong><br />
2009–10<br />
<strong>School</strong><br />
2010–11<br />
<strong>School</strong><br />
<strong>2011–12</strong><br />
District<br />
<strong>2011–12</strong><br />
With Full Credential 20 23 22 99<br />
Without Full Credential 0 0 0 1<br />
Teaching Outside Subject Area of<br />
Competence (with full credential)<br />
0 0 0 0<br />
Teacher Misassignments and Vacant Teacher Positions<br />
Indicator 2010–11 <strong>2011–12</strong> 2012–13<br />
Misassignments of Teachers of English Learners 0 0 0<br />
Total Teacher Misassignments* 0 0 0<br />
Vacant Teacher Positions 0 0 0<br />
Note: “Misassignments” refers to the number of positions filled by teachers who lack legal<br />
authorization to teach that grade level, subject area, student group, etc.<br />
* Total Teacher Misassignments includes the number of Misassignments of Teachers of English<br />
Learners.<br />
Core Academic Classes Taught by Highly Qualified Teachers (<strong>School</strong> Year <strong>2011–12</strong>)<br />
The Federal Elementary and Secondary Education Act (ESEA), also known as No Child Left<br />
Behind (NCLB), requires that core academic subjects be taught by Highly Qualified<br />
Teachers, defined as having at least a bachelor’s degree, an appropriate California teaching<br />
credential, and demonstrated core academic subject area competence. For more<br />
information, see the CDE Improving Teacher and Principal Quality Web page at:<br />
http://www.cde.ca.gov/nclb/sr/tq/<br />
Location of<br />
Classes<br />
Percent of Classes In Core<br />
Academic Subjects Taught by<br />
Highly Qualified Teachers<br />
Percent of Classes In Core<br />
Academic Subjects Not Taught by<br />
Highly Qualified Teachers<br />
This <strong>School</strong> 100.00% 0.00%<br />
All <strong>School</strong>s in<br />
District<br />
High-Poverty<br />
<strong>School</strong>s in<br />
District<br />
100.00% 0.00%<br />
100.00% 0.00%
Low-Poverty<br />
<strong>School</strong>s in<br />
District<br />
0.00% 0.00%<br />
Note: High-poverty schools are defined as those schools with student eligibility of approximately 40<br />
percent or more in the free and reduced price meals program. Low-poverty schools are those with<br />
student eligibility of approximately 25 percent or less in the free and reduced price meals program.<br />
VI. Support Staff<br />
Academic Counselors and Other Support Staff (<strong>School</strong> Year <strong>2011–12</strong>)<br />
Title<br />
Number of FTE*<br />
Assigned to <strong>School</strong><br />
Average Number of<br />
Students per Academic<br />
Counselor<br />
Academic Counselor 0 0<br />
Counselor (Social/Behavioral or<br />
Career Development)<br />
Library Media Teacher (librarian) 0<br />
Library Media Services Staff<br />
(paraprofessional)<br />
Psychologist .25<br />
Social Worker 0<br />
Nurse .22<br />
Speech/Language/Hearing Specialist . 08<br />
Resource Specialist (non-teaching) 0<br />
Other 1<br />
Note: Cells shaded in black do not require data.<br />
* One Full-Time Equivalent (FTE) equals one staff member working full-time; one FTE could also<br />
represent two staff members who each work 50 percent of full-time.<br />
VII. Curriculum and Instructional Materials<br />
Quality, Currency, Availability of Textbooks and Instructional Materials (<strong>School</strong> Year 2012–13)<br />
This section describes whether the textbooks and instructional materials used at the school<br />
are from the most recent adoption; whether there are sufficient textbooks and instruction<br />
materials for each student; and information about the school’s use of any supplemental<br />
curriculum or non-adopted textbooks or instructional materials.<br />
Year and month in which data were collected: ___August 2012___<br />
0<br />
1<br />
Core Curriculum<br />
Area<br />
Textbooks and<br />
instructional<br />
materials/year of<br />
adoption<br />
From most recent<br />
adoption<br />
Percent<br />
students lacking<br />
own assigned<br />
copy<br />
Reading/Language<br />
Arts<br />
A Legacy of Literacy, Houghton<br />
Mifflin<br />
All are most recent stateadoptions,<br />
fair to excellent<br />
quality and available to all<br />
0%
Mathematics<br />
Science<br />
History-Social<br />
Science<br />
students<br />
California HSP Mathematics,<br />
Harcourt<br />
Same as above 0%<br />
California Science, Houghton<br />
Mifflin<br />
Same as above 0%<br />
California Vistas,<br />
MacMillan/McGraw Hill Same as above 0%<br />
VIII. <strong>School</strong> Finances<br />
Expenditures Per Pupil and <strong>School</strong> Site Teacher Salaries (Fiscal Year 2010–11)<br />
Level<br />
Total<br />
Expenditures<br />
Per Pupil<br />
Expenditures Per<br />
Pupil<br />
(Supplemental /<br />
Restricted)<br />
Expenditures Per<br />
Pupil (Basic /<br />
Unrestricted)<br />
Average<br />
Teacher<br />
Salary<br />
<strong>School</strong> Site $5,095.57 $1,016.82 $4,078.84 $57,840<br />
District $5,092.52 $55,266<br />
Percent<br />
Difference –<br />
<strong>School</strong> Site<br />
and District<br />
80% 104%<br />
State $5,455 $65,598<br />
Percent<br />
Difference –<br />
<strong>School</strong> Site<br />
and State<br />
75% 88%<br />
Note: Cells shaded in black do not require data.<br />
Supplemental/Restricted expenditures come from money whose use is controlled by law or by a<br />
donor. Money that is designated for specific purposes by the district or governing board is not<br />
considered restricted. Basic/unrestricted expenditures are from money whose use, except for<br />
general guidelines, is not controlled by law or by a donor.<br />
For detailed information on school expenditures for all districts in California, see the CDE Current<br />
Expense of Education & Per-pupil Spending Web page at http://www.cde.ca.gov/ds/fd/ec/. For<br />
information on teacher salaries for all districts in California, see the CDE Certificated Salaries &<br />
Benefits Web page at http://www.cde.ca.gov/ds/fd/cs/. To look up expenditures and salaries for a<br />
specific school district, see the Ed-Data Web site at: http://www.ed-data.org.<br />
Types of Services Funded (Fiscal Year <strong>2011–12</strong>)<br />
Ronald Reagan <strong>School</strong> receives funding from State and Federal categorical programs, which include:<br />
• Title I–Part A (Basic Grant)<br />
• Title II-Part A (Teacher Quality)<br />
• Title II-Part D (Technology)<br />
• Title III-Limited English Proficient (LEP) Students<br />
• <strong>School</strong> Safety and Violence Prevention (AB1113)<br />
• Economic Impact Aid (EL)<br />
• <strong>School</strong> and Library Improvement Grant
• Gifted and Talented Education<br />
Students are monitored during the year with site benchmarks, classroom and publisher assessments.<br />
Students also participate in Accelerated Reader. Teachers provide leveled, small group instruction in<br />
addition to whole class instruction using explicit, direct instruction.<br />
Teacher and Administrative Salaries (Fiscal Year 2010–11)<br />
Category<br />
District<br />
Amount<br />
State Average For Districts In<br />
Same Category<br />
Beginning Teacher Salary $37,019 $40,962<br />
Mid-Range Teacher Salary $56,187 $63,212<br />
Highest Teacher Salary $71,801 $80,545<br />
Average Principal Salary<br />
(Elementary)<br />
$84,142 $102,057<br />
Average Principal Salary (Middle) $84,093 $106,108<br />
Average Principal Salary (High) $110,838<br />
Superintendent Salary $151,188 $152,557<br />
Percent of Budget for Teacher<br />
Salaries<br />
Percent of Budget for Administrative<br />
Salaries<br />
39.00% 40.00%<br />
8.00% 6.00%<br />
Note: For detailed information on salaries, see the CDE Certificated Salaries & Benefits Web page at<br />
http://www.cde.ca.gov/ds/fd/cs/.<br />
IX. Student Performance<br />
Standardized Testing and <strong>Report</strong>ing Program<br />
The Standardized Testing and <strong>Report</strong>ing (STAR) Program consists of several key<br />
components, including:<br />
<br />
<br />
<br />
California Standards Tests (CSTs), which include English-language arts (ELA) and<br />
mathematics in grades two through eleven; science in grades five, eight, and nine<br />
through eleven; and history-social science in grades eight, and nine through eleven.<br />
California Modified Assessment (CMA), an alternate assessment that is based on<br />
modified achievement standards in ELA for grades three through eleven; mathematics<br />
for grades three through seven, Algebra I, and Geometry; and science in grades five<br />
and eight, and Life Science in grade ten. The CMA is designed to assess those students<br />
whose disabilities preclude them from achieving grade-level proficiency on an<br />
assessment of the California content standards with or without accommodations.<br />
California Alternate Performance Assessment (CAPA), includes ELA and<br />
mathematics in grades two through eleven, and science for grades five, eight, and ten.<br />
The CAPA is given to those students with significant cognitive disabilities whose<br />
disabilities prevent them from taking either the CSTs with accommodations or<br />
modifications or the CMA with accommodations.
The assessments under the STAR Program show how well students are doing in relation to<br />
the state content standards. On each of these assessments, student scores are reported as<br />
performance levels.<br />
For detailed information regarding the STAR Program results for each grade and<br />
performance level, including the percent of students not tested, see the CDE STAR Results<br />
Web site at http://star.cde.ca.gov.<br />
Standardized Testing and <strong>Report</strong>ing Results for All Students – Three-Year Comparison<br />
Percent of Students Scoring at Proficient or Advanced (meeting or<br />
exceeding the state standards)<br />
Subject<br />
<strong>School</strong> District State<br />
2009–<br />
10<br />
2010–<br />
11<br />
2011–<br />
12<br />
2009–<br />
10<br />
2010–<br />
11<br />
2011–<br />
12<br />
2009–<br />
10<br />
2010–<br />
11<br />
2011–<br />
12<br />
English-<br />
Language<br />
Arts<br />
40% 44% 47% 43% 47% 46% 52% 54% 56%<br />
Mathematics 50% 54% 60% 46% 46% 48% 48% 50% 51%<br />
Science 0% 0% 0% 50% 59% 53% 54% 57% 60%<br />
History-<br />
Social<br />
Science<br />
0% 0% 0% 35% 48% 37% 44% 48% 49%<br />
Note: Scores are not shown when the number of students tested is ten or less, either because the<br />
number of students in this category is too small for statistical accuracy or to protect student privacy.<br />
Standardized Testing and <strong>Report</strong>ing Results by Student Group – Most Recent Year<br />
Group<br />
Percent of Students Scoring at Proficient or Advanced<br />
English-<br />
Language Arts<br />
Mathematics Science<br />
History- Social<br />
Science<br />
All Students in the LEA 46% 48% 53% 37%<br />
All Students at the <strong>School</strong> 47% 60% 0% 0%<br />
Male 42% 55% 0% 0%<br />
Female 53% 64% 0% 0%<br />
Black or African American 0% 0% 0% 0%<br />
American Indian or Alaska<br />
Native<br />
0% 0% 0% 0%<br />
Asian 0% 0% 0% 0%<br />
Filipino 0% 0% 0% 0%<br />
Hispanic or Latino 40% 55% 0% 0%
Native Hawaiian or Pacific<br />
Islander<br />
White 58% 67% 0% 0%<br />
Two or More Races 0% 0% 0% 0%<br />
Socioeconomically<br />
Disadvantaged<br />
41% 55% 0% 0%<br />
English Learners 17% 35% 0% 0%<br />
Students with Disabilities 23% 43% 0% 0%<br />
Students Receiving Migrant<br />
Education Services<br />
27% 45% 0% 0%<br />
Note: Scores are not shown when the number of students tested is ten or less, either because the<br />
number of students in this category is too small for statistical accuracy or to protect student privacy.<br />
California Physical Fitness Test Results (<strong>School</strong> Year <strong>2011–12</strong>)<br />
The California Physical Fitness Test (PFT) is administered to students in grades five, seven,<br />
and nine only. This table displays by grade level the percent of students meeting the fitness<br />
standards for the most recent testing period. For detailed information regarding this test,<br />
and comparisons of a school’s test results to the district and state, see the CDE PFT Web<br />
page at http://www.cde.ca.gov/ta/tg/pf/.<br />
Grade Level<br />
Percent of Students Meeting Fitness Standards<br />
Four of Six Standards Five of Six Standards Six of Six Standards<br />
5 N/A<br />
7<br />
9<br />
Note: Scores are not shown when the number of students tested is ten or less, either because the<br />
number of students in this category is too small for statistical accuracy or to protect student privacy.<br />
X. <strong>Accountability</strong><br />
Academic Performance Index<br />
The Academic Performance Index (API) is an annual measure of state academic<br />
performance and progress of schools in California. API scores range from 200 to 1,000, with<br />
a statewide target of 800. For detailed information about the API, see the CDE API Web<br />
page at http://www.cde.ca.gov/ta/ac/ap/.<br />
Academic Performance Index Ranks – Three-Year Comparison<br />
This table displays the school’s statewide and similar schools’ API ranks. The statewide<br />
API rank ranges from 1 to 10. A statewide rank of 1 means that the school has an API<br />
score in the lowest ten percent of all schools in the state, while a statewide rank of 10<br />
means that the school has an API score in the highest ten percent of all schools in the state.<br />
The similar schools API rank reflects how a school compares to 100 statistically matched<br />
“similar schools.” A similar schools rank of 1 means that the school’s academic performance<br />
is comparable to the lowest performing ten schools of the 100 similar schools, while a
similar schools rank of 10 means that the school’s academic performance is better than at<br />
least 90 of the 100 similar schools.<br />
API Rank 2009 2010 2011<br />
Statewide 3 3 3<br />
Similar <strong>School</strong>s 3 3 2<br />
Academic Performance Index Growth by Student Group – Three-Year Comparison<br />
Group<br />
Actual API<br />
Change 2009–10<br />
Actual API<br />
Change 2010–11<br />
Actual API<br />
Change <strong>2011–12</strong><br />
All Students at the <strong>School</strong> 10 16 20<br />
Black or African American<br />
American Indian or Alaska<br />
Native<br />
Asian<br />
Filipino<br />
Hispanic or Latino 13 31 3<br />
Native Hawaiian or Pacific<br />
Islander<br />
White 6 3 40<br />
Two or More Races<br />
Socioeconomically<br />
Disadvantaged<br />
9 23 8<br />
English Learners 9 34 -8<br />
Students with Disabilities<br />
Note: “N/D” means that no data were available to the CDE or LEA to report. “B” means the school did<br />
not have a valid API Base and there is no Growth or target information. “C” means the school had<br />
significant demographic changes and there is no Growth or target information.<br />
Academic Performance Index Growth by Student Group – 2012 Growth API Comparison<br />
This table displays, by student group, the number of students included in the API and the<br />
2012 Growth API at the school, LEA, and state level.<br />
2012 Growth API<br />
Group<br />
Number of<br />
Students<br />
<strong>School</strong><br />
Number of<br />
Students<br />
LEA<br />
Number of<br />
Students<br />
State<br />
All Students at the<br />
<strong>School</strong><br />
Black or African<br />
American<br />
American Indian or<br />
Alaska Native<br />
432 783 1,478 763 4,664,264 788<br />
8 31 748 313,201 710<br />
5 13 700 31,606 742
Asian 5 19 911 404,670 905<br />
Filipino 2 7 124,824 869<br />
Hispanic or Latino 246 756 873 745 2,425,230 740<br />
Native Hawaiian or<br />
Pacific Islander<br />
0 2 26,563 775<br />
White 161 822 526 790 1,221,860 853<br />
Two or More Races 4 6 88,428 849<br />
Socioeconomically<br />
Disadvantaged<br />
345 759 1,210 747 2,779,680 737<br />
English Learners 158 740 533 724 1,530,297 716<br />
Students with<br />
Disabilities<br />
35 633 127 562 530,935 607<br />
Adequate Yearly Progress<br />
The federal ESEA requires that all schools and districts meet the following Adequate Yearly<br />
Progress (AYP) criteria:<br />
<br />
<br />
<br />
<br />
Participation rate on the state’s standards-based assessments in ELA and<br />
mathematics<br />
Percent proficient on the state’s standards-based assessments in ELA and<br />
mathematics<br />
API as an additional indicator<br />
Graduation rate (for secondary schools)<br />
For detailed information about AYP, including participation rates and percent proficient<br />
results by student group, see the CDE AYP Web page at http://www.cde.ca.gov/ta/ac/ay/.<br />
Adequate Yearly Progress Overall and by Criteria (<strong>School</strong> Year <strong>2011–12</strong>)<br />
AYP Criteria <strong>School</strong> District<br />
Made AYP Overall No No<br />
Met Participation Rate - English-Language Arts Yes Yes<br />
Met Participation Rate - Mathematics Yes Yes<br />
Met Percent Proficient - English-Language Arts No No<br />
Met Percent Proficient - Mathematics No No<br />
Met API Criteria Yes Yes<br />
Met Graduation Rate N/A N/A
Federal Intervention Program (<strong>School</strong> Year 2012–13)<br />
<strong>School</strong>s and districts receiving federal Title I funding enter Program Improvement (PI) if<br />
they do not make AYP for two consecutive years in the same content area (ELA or<br />
mathematics) or on the same indicator (API or graduation rate). After entering PI, schools<br />
and districts advance to the next level of intervention with each additional year that they do<br />
not make AYP. For detailed information about PI identification, see the CDE PI Status<br />
Determinations Web page: http://www.cde.ca.gov/ta/ac/ay/tidetermine.asp.<br />
Indicator <strong>School</strong> District<br />
Program Improvement Status In PI In PI<br />
First Year of Program Improvement 2009-2010 2011-2012<br />
Year in Program Improvement Year 4 Year 2<br />
Number of <strong>School</strong>s Currently in Program Improvement 5<br />
Percent of <strong>School</strong>s Currently in Program Improvement 100.0%<br />
Note: Cells shaded in black do not require data.<br />
XI. <strong>School</strong> Completion and Postsecondary Preparation<br />
N/A<br />
XII. Instructional Planning and Scheduling<br />
Professional Development<br />
This section provides information on the annual number of school days dedicated to staff<br />
development for the most recent three-year period.<br />
The students at Ronald Reagan Elementary <strong>School</strong> are dismissed one hour early every Monday for staff<br />
development. During staff development, teachers focus on English language arts and mathematics. Time is<br />
spent collaborating best teaching practices, analyzing student data, and setting goals for improved student<br />
achievement. Some staff development days are spent as whole staff, while other days are devoted to grade<br />
level meetings. The goal of staff development is to collaborate and discuss student data. Areas of focus<br />
include reading/language arts and mathematics/writing. Professional development is delivered in afterschool<br />
workshops, out-of-District conferences, and staff development sessions held outside of the school<br />
day (Saturdays).<br />
For the 2011-2012 school year, four days were dedicated to staff and professional development.<br />
Ronald Reagan Elementary <strong>School</strong> <strong>Accountability</strong> <strong>Report</strong> <strong>Card</strong>, 2011-2012<br />
Chowchilla Elementary<br />
Provided by the Ed-Data Partnership<br />
For more information visit www.ed-data.org