Introduction to Introduction to Sensory Data Analysis - Camo
Introduction to Introduction to Sensory Data Analysis - Camo
Introduction to Introduction to Sensory Data Analysis - Camo

You also want an ePaper? Increase the reach of your titles
YUMPU automatically turns print PDFs into web optimized ePapers that Google loves.
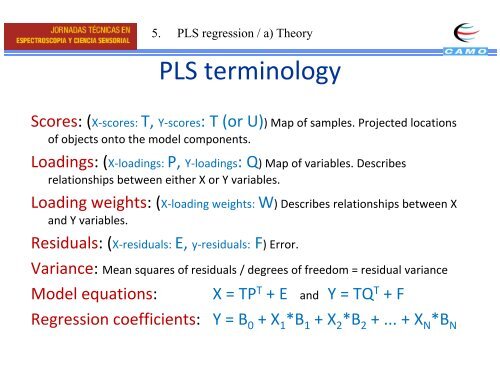
5. PLS regression / a) Theory<br />
PLS terminology<br />
Scores: (X‐scores: T, Y‐scores: : T (or U)) Map of samples. Projected dlocations<br />
of objects on<strong>to</strong> the model components.<br />
Loadings: (X‐loadings:( P, Y‐loadings: Q) Map of variables. Describes<br />
relationships between either X or Y variables.<br />
Loading weights: (X‐loading weights: W) Describes relationships between X<br />
and Y variables. ibl<br />
Residuals: (X‐residuals: E, y‐residuals: F) Error.<br />
Variance: Mean squares of residuals / degrees of freedom = residual variance<br />
Model equations:<br />
X = TP T + E and Y = TQ T + F<br />
Regression coefficients: i Y = B 0 + X 1 *B 1 + X 2 *B 2 + ... + X N *B N