Lab 7 Identifying Limiting Nutrient - Sayre School
Lab 7 Identifying Limiting Nutrient - Sayre School
Lab 7 Identifying Limiting Nutrient - Sayre School

Create successful ePaper yourself
Turn your PDF publications into a flip-book with our unique Google optimized e-Paper software.
<strong>Lab</strong> 7: The Ecosystem Drawing<br />
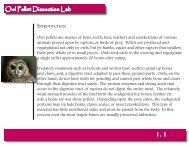
Introduction:<br />
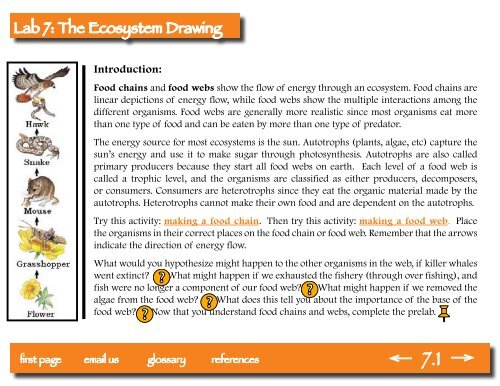
Food chains and food webs show the flow of energy through an ecosystem. Food chains are<br />
linear depictions of energy flow, while food webs show the multiple interactions among the<br />
different organisms. Food webs are generally more realistic since most organisms eat more<br />
than one type of food and can be eaten by more than one type of predator.<br />
The energy source for most ecosystems is the sun. Autotrophs (plants, algae, etc) capture the<br />
sun’s energy and use it to make sugar through photosynthesis. Autotrophs are also called<br />
primary producers because they start all food webs on earth. Each level of a food web is<br />
called a trophic level, and the organisms are classified as either producers, decomposers,<br />
or consumers. Consumers are heterotrophs since they eat the organic material made by the<br />
autotrophs. Heterotrophs cannot make their own food and are dependent on the autotrophs.<br />
Try this activity: making a food chain. Then try this activity: making a food web. Place<br />
the organisms in their correct places on the food chain or food web. Remember that the arrows<br />
indicate the direction of energy flow.<br />
What would you hypothesize might happen to the other organisms in the web, if killer whales<br />
went extinct What might happen if we exhausted the fishery (through over fishing), and<br />
fish were no longer a component of our food web What might happen if we removed the<br />
algae from the food web What does this tell you about the importance of the base of the<br />
food web Now that you understand food chains and webs, complete the prelab.<br />
email us<br />
glossary 7.1
<strong>Lab</strong> 7: The Ecosystem Drawing<br />
The water cycle is driven by the sun’s energy. The sun heats the water and some of it evaporates<br />
into the air. Ice and snow can sublimate directly into water vapor. Rising air currents take the<br />
vapor up into the atmosphere, along with water from transpiration, which is water transpired<br />
from plants. The vapor rises into the air where cooler temperatures cause it to condense into<br />
clouds. Air currents move clouds around the globe, cloud particles collide, grow, and fall out<br />
of the sky as precipitation. Some precipitation falls as snow and can accumulate as ice caps<br />
and glaciers, which can store frozen water for thousands of years.<br />
<strong>Nutrient</strong>s cycle through the environment, but energy has a one way<br />
flow and is lost as heat.<br />
Most precipitation falls back into the oceans or onto land, where, due to gravity, the precipitation<br />
flows over the ground as surface runoff. A portion of runoff enters rivers which move<br />
water towards the oceans. Runoff, and ground-water seepage, accumulate and are stored as<br />
freshwater in lakes. Not all runoff flows into rivers, though. Much of it soaks into the ground<br />
as infiltration. Some water infiltrates deep into the ground and replenishes aquifers (saturated<br />
subsurface rock), which store huge amounts of freshwater for long periods of time.<br />
Over 96% of the world’s total water supply is salt water. Of the total freshwater, 68% is<br />
locked up in ice and glaciers. Another 30% of freshwater is in the ground. Fresh surface-water<br />
sources, such as rivers and lakes, only constitute about 1/150 of one percent of total water.<br />
Yet, rivers and lakes are the sources of most of the water people use everyday.<br />
email us<br />
glossary 7.2
<strong>Lab</strong> 7: The Ecosystem Drawing<br />
email us<br />
glossary 7.3
<strong>Lab</strong> 7: The Ecosystem Drawing<br />
Carbon enters the living world through the action of autotrophs (plants and algae) that use<br />
the sun’s energy to convert carbon dioxide (CO 2<br />
) into organic sugar. Animals eat plants to<br />
get the energy rich sugar, and perform cellular respiration to convert the sugar into usuable<br />
energy. Carbon returns to the atmosphere by respiration, burning fossil fuels, and decay.<br />
The uptake and return of CO 2<br />
are not currently in balance. The carbon<br />
dioxide content of the atmosphere is gradually and steadily increasing.<br />
The graph shows the CO 2<br />
concentration at a summit in Hawaii from 1958<br />
through 1999. The seasonal fluctuation is caused by the increased uptake<br />
of CO 2<br />
by plants in the summer. Samples of air trapped over the centuries<br />
in the glacial ice of Greenland show no change in CO 2<br />
content until 300<br />
years ago.<br />
• Since 1958 concentrations have risen over 20%. This increase is caused by human activities:<br />
burning fossil fuels (coal, oil, natural gas) which returns to the atmosphere carbon that has<br />
been locked within the earth for millions of years.<br />
• clearing and burning of forests, especially in the tropics. In recent decades, large areas of<br />
the Amazon rain forest have been cleared for agriculture and cattle grazing.<br />
Despite CO 2<br />
sinks (ocean, desert sand, plants), the concentration of atmospheric CO 2<br />
continues<br />
to rise. Carbon dioxide is transparent to light but rather opaque to heat rays. Therefore, CO 2<br />
in<br />
the atmosphere retards the radiation of heat from the earth back into space - the “greenhouse<br />
effect”. This greenhouse effect is causing a change in the world’s climate.<br />
email us<br />
glossary 7.4
<strong>Lab</strong> 7: The Ecosystem Drawing<br />
email us<br />
glossary 7.5
<strong>Lab</strong> 7: The Ecosystem Drawing<br />
Phosphorus is an important element for making DNA and RNA, and is also a component of<br />
ATP which serves as an energy source. The phosphorus cycle differs from the other major<br />
cycles because it does not include a gas phase.<br />
When it rains, phosphates are removed from the rocks (via weathering) and are distributed<br />
throughout both soils and water. Plants take up the phosphate from the soil. The phosphates<br />
then move from plants to animals when herbivores eat plants and carnivores herbivores.<br />
The phosphates in the animal tissue eventually return to the soil through excretion, and<br />
decomposition of plants and animals. The same process occurs in aquatic ecosystem.<br />
algae bloom off<br />
coast of Florida<br />
While obviously beneficial for many biological processes, an excessive amount of phosphorus<br />
is considered a pollutant in water. Phosphate stimulates the growth of plankton and plants.<br />
When there are no longer enough nutrients, the plants die. Excess growth of decomposers<br />
tends to consume large amounts of dissolved oxygen, potentially suffocating fish and other<br />
marine animals. While the excess dead plants block available sunlight to bottom dwelling<br />
species. This is known as eutrophication.<br />
Humans can alter the phosphorus cycle in many ways, including deforesting the tropical rain<br />
forests and the using agricultural fertilizers. As the forest is cut, heavy rains quickly wash away<br />
nutrients originally stored in plants. Agricultural runoff provides much of the phosphate<br />
found in waterways. Crops often cannot absorb all of the fertilizer in the soils, causing excess<br />
fertilizer runoff and increasing phosphate levels in rivers and other bodies of water.<br />
email us<br />
glossary 7.6
<strong>Lab</strong> 7: The Ecosystem Drawing<br />
email us<br />
glossary 7.7
<strong>Lab</strong> 7: The Ecosystem Drawing<br />
Nitrogen is used to produce proteins and DNA. Despite its abundance in the atmosphere,<br />
nitrogen is often the limiting nutrient for plant growth. This occurs because most plants can<br />
only use nitrogen in two solid forms: ammonium and nitrate. Animals receive the nitrogen they<br />
need for metabolism, growth, and reproduction by eating living or dead organic material.<br />
In the process of nitrification, ammonium is chemically altered by bacteria to form nitrate.<br />
Nitrate is very soluble and it is easily lost from the soil system by leaching. Some of this leached<br />
nitrate flows through the water system where it is returned to the atmosphere by denitrification.<br />
Denitrification is also common in soils and is carried out by heterotrophic bacteria.<br />
Nitrifying Bacteria<br />
Almost all of the nitrogen found in any terrestrial ecosystem originally came from the<br />
atmosphere. Significant amounts enter the soil in rainfall or through the effects of lightning.<br />
The majority, however, is fixed within the soil by bacteria. Members of the bean family form<br />
symbiotic relationships with nitrogen fixing bacteria. In exchange for some nitrogen, the<br />
bacteria receive carbohydrates and a moist environment from the plants.<br />
Humans have altered the nitrogen cycle by:<br />
• The over-use of nitrogen fertilizers has caused nitrate to leach into water. The additional<br />
nitrogen flows into streams, rivers, lakes, and estuaries which can lead to eutrophication.<br />
• The farming of livestock which release large amounts of ammonia into the environment<br />
from their wastes.<br />
• Sewage waste and septic tank leaching.<br />
email us<br />
glossary 7.8
<strong>Lab</strong> 7: The Ecosystem Drawing<br />
email us<br />
glossary 7.9
<strong>Lab</strong> 7: The Ecosystem Drawing<br />
Procedure:<br />
Your teacher will assign you and your partner a biome. The inspiration file linked next to the<br />
biome name has a background photograph for you to use in your drawing:<br />
• Desert<br />
• Tropical Rain Forest<br />
• Tundra<br />
• Alpine<br />
• Chaparral<br />
• Savanna<br />
• Grasslands<br />
• Taiga<br />
From the information that you have learned in class you will create an Ecosystem Drawing of<br />
your assigned Biome. Your drawing should include the four major nutrient cycles: phosphorus,<br />
carbon, nitrogen, and water. This drawing will illustrate the interaction between biotic and<br />
abiotic factors, how energy flows through the ecosystem, and how inorganic materials are<br />
recycled back into the ecosystem.<br />
Be sure to look at the scoring guide to understand what material should be on your drawing<br />
and how you will be graded. If your partner is absent for an extended time period, you<br />
need to discuss with your teacher how to proceed. You will also need to properly cite the<br />
source of your pictures.<br />
You will use Inspiration to make your Drawing. Be sure to go to the Link menu and uncheck<br />
“draw links under symbols”. This will allow you to make food chains over the background<br />
picture.<br />
email us<br />
glossary 7.10
<strong>Lab</strong> 7: The Ecosystem Drawing<br />
The following items should be ILLUSTRATED in your ecosystem:<br />
1. On your Ecosystem drawing you need four producers, correctly labeled with organism<br />
common name, scientific name and correctly labeled with trophic level.<br />
2. On your Ecosystem drawing you need at least 9 consumers (including herbivores, carnivores,<br />
omnivores), correctly labeled with organism common name, scientific name, and correctly<br />
labeled with trophic level.<br />
3. On your Ecosystem drawing you need two decomposers correctly labeled with trophic level.<br />
You may use generic decomposers like fungi and bacteria to make the nutrients cycle in your<br />
biome.<br />
4. On your Ecosystem drawing, you need four different Food Chains, each color-coded to<br />
identify them clearly. Arrows should be drawn in correct direction. Each chain will be used<br />
for one of the nutrient cycles. Make sure the organisms in your food chains actually live in the<br />
same area of the Earth.<br />
5. On your Ecosystem drawing you need the Abiotic Factors listed in lower left corner.<br />
6. On your Ecosystem drawing you need a Primary Energy Source properly labeled and attached<br />
to one plant. Color code that arrow yellow to show how sunlight energy is moving into your<br />
Ecosystem.<br />
email us<br />
glossary 7.11
<strong>Lab</strong> 7: The Ecosystem Drawing<br />
7. The Water Cycle on your Ecosystem drawing should include transpiration, precipitation,<br />
condensation, evaporation, percolation, runoff, root uptake, and groundwater. The arrows<br />
should be color-coded blue.<br />
8. The Carbon Cycle on your Ecosystem drawing should include the processes of respiration,<br />
eating, photosynthesis, decomposition, and combustion. The arrows should be color-coded<br />
grey.<br />
9. The Phosphorus Cycle on your Ecosystem drawing should include a cycle on land and a<br />
cycle in water. Be sure to label weathering, uplifting and sediments. The arrows should be<br />
color-coded orange.<br />
10. The Nitrogen Cycle on your Ecosystem drawing should include nitrogen fixation,<br />
assimilation, ammonification, nitrification, and denitrification. The arrows should be colorcoded<br />
green.<br />
11. Be sure to include a man-made disturbance that exists in your biome. Think about tying<br />
the disturbance to burning of fossil fuels.<br />
12. You will be awarded points for neatness and creativity. Points will be deducted if you don’t<br />
have a bibliography or if you use animals that don’t live in the same area of the Earth.<br />
13. Don’t forget to do you homework. It is a review of all the information we have discussed<br />
on Ecosystems and a review for your quiz.<br />
email us<br />
glossary 7.12
<strong>Lab</strong> 7: The Ecosystem Drawing<br />
email us<br />
glossary 7.13
<strong>Lab</strong> 7: The Ecosystem Drawing<br />
References:<br />
Biology Sciences Curriculum Study. Biology: A Human Approach. Kendall/ Hunt Publishing:<br />
Iowa. 1997.<br />
deCharon, Annette. Toxic and Harmful Algal Blooms Educational Activities. Bigelow <strong>Lab</strong>oratory<br />
for Ocean Sciences. www.bigelow.org/edhab/fitting_algae.html. 29 September 2008.<br />
Holsinger, Rachel and Debbie Wheeler. “<strong>Lab</strong> 7: The Ecosystem Drawing” <strong>Sayre</strong> <strong>School</strong>:<br />
Lexington, KY. September 2014.<br />
Kimball, John. The Carbon Cycle. Kimball’s Biology Pages. September 2008 http://users.rcn.<br />
com/jkimball.ma.ultranet/BiologyPages/C/CarbonCycle.html. 29 September 2008.<br />
Pidwirny, Michael. Chapter 9: Introduction to the Biosphere. Physical Geographyhttp://www.<br />
physicalgeography.net/fundamentals/9s.html. 29 September 2008.<br />
Water Cycle. Envrionmental Literacy Council. 26 June 2008. http://www.enviroliteracy.org/<br />
article.php/704.php. 29 September 2008.<br />
email us<br />
glossary 7.14