unique asr&per revis.. - Ministry Of Agriculture, Food and Cooperatives
unique asr&per revis.. - Ministry Of Agriculture, Food and Cooperatives
unique asr&per revis.. - Ministry Of Agriculture, Food and Cooperatives

Create successful ePaper yourself
Turn your PDF publications into a flip-book with our unique Google optimized e-Paper software.
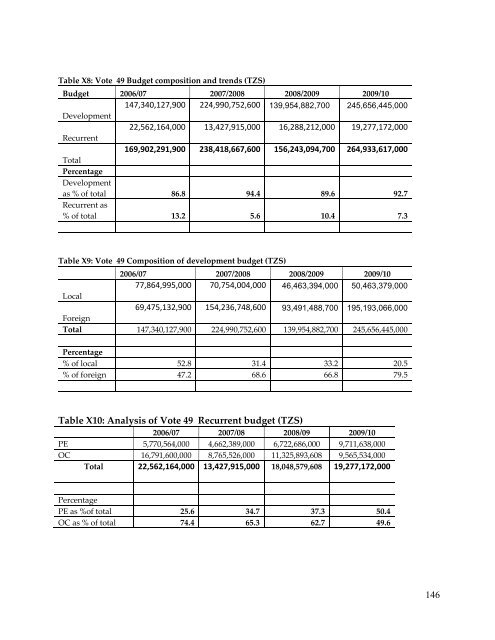
Table X8: Vote 49 Budget composition <strong>and</strong> trends (TZS)<br />
Budget 2006/07 2007/2008 2008/2009 2009/10<br />
147,340,127,900 224,990,752,600 139,954,882,700 245,656,445,000<br />
Development<br />
22,562,164,000 13,427,915,000 16,288,212,000 19,277,172,000<br />
Recurrent<br />
169,902,291,900 238,418,667,600 156,243,094,700 264,933,617,000<br />
Total<br />
Percentage<br />
Development<br />
as % of total 86.8 94.4 89.6 92.7<br />
Recurrent as<br />
% of total 13.2 5.6 10.4 7.3<br />
Table X9: Vote 49 Composition of development budget (TZS)<br />
2006/07 2007/2008 2008/2009 2009/10<br />
77,864,995,000 70,754,004,000 46,463,394,000 50,463,379,000<br />
Local<br />
69,475,132,900 154,236,748,600 93,491,488,700 195,193,066,000<br />
Foreign<br />
Total 147,340,127,900 224,990,752,600 139,954,882,700 245,656,445,000<br />
Percentage<br />
% of local 52.8 31.4 33.2 20.5<br />
% of foreign 47.2 68.6 66.8 79.5<br />
Table X10: Analysis of Vote 49 Recurrent budget (TZS)<br />
2006/07 2007/08 2008/09 2009/10<br />
PE 5,770,564,000 4,662,389,000 6,722,686,000 9,711,638,000<br />
OC 16,791,600,000 8,765,526,000 11,325,893,608 9,565,534,000<br />
Total 22,562,164,000 13,427,915,000 18,048,579,608 19,277,172,000<br />
Percentage<br />
PE as %of total 25.6 34.7 37.3 50.4<br />
OC as % of total 74.4 65.3 62.7 49.6<br />
146