download pdf file - Eastech Flow Controls
download pdf file - Eastech Flow Controls
download pdf file - Eastech Flow Controls

Create successful ePaper yourself
Turn your PDF publications into a flip-book with our unique Google optimized e-Paper software.
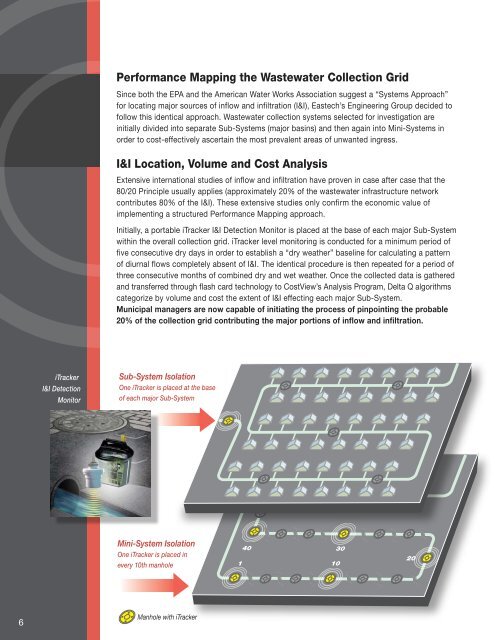
Performance Mapping the Wastewater Collection Grid<br />
Since both the EPA and the American Water Works Association suggest a “Systems Approach”<br />
for locating major sources of inflow and infiltration (I&I), <strong>Eastech</strong>’s Engineering Group decided to<br />
follow this identical approach. Wastewater collection systems selected for investigation are<br />
initially divided into separate Sub-Systems (major basins) and then again into Mini-Systems in<br />
order to cost-effectively ascertain the most prevalent areas of unwanted ingress.<br />
I&I Location, Volume and Cost Analysis<br />
Extensive international studies of inflow and infiltration have proven in case after case that the<br />
80/20 Principle usually applies (approximately 20% of the wastewater infrastructure network<br />
contributes 80% of the I&I). These extensive studies only confirm the economic value of<br />
implementing a structured Performance Mapping approach.<br />
Initially, a portable iTracker I&I Detection Monitor is placed at the base of each major Sub-System<br />
within the overall collection grid. iTracker level monitoring is conducted for a minimum period of<br />
five consecutive dry days in order to establish a “dry weather” baseline for calculating a pattern<br />
of diurnal flows completely absent of I&I. The identical procedure is then repeated for a period of<br />
three consecutive months of combined dry and wet weather. Once the collected data is gathered<br />
and transferred through flash card technology to CostView’s Analysis Program, Delta Q algorithms<br />
categorize by volume and cost the extent of I&I effecting each major Sub-System.<br />
Municipal managers are now capable of initiating the process of pinpointing the probable<br />
20% of the collection grid contributing the major portions of inflow and infiltration.<br />
iTracker<br />
I&I Detection<br />
Monitor<br />
Sub-System Isolation<br />
One iTracker is placed at the base<br />
of each major Sub-System<br />
Mini-System Isolation<br />
One iTracker is placed in<br />
every 10th manhole<br />
40<br />
30<br />
1 10<br />
20<br />
6<br />
Manhole with iTracker