Pitfalls of IRR Pricing - Actuary.com
Pitfalls of IRR Pricing - Actuary.com
Pitfalls of IRR Pricing - Actuary.com

Create successful ePaper yourself
Turn your PDF publications into a flip-book with our unique Google optimized e-Paper software.
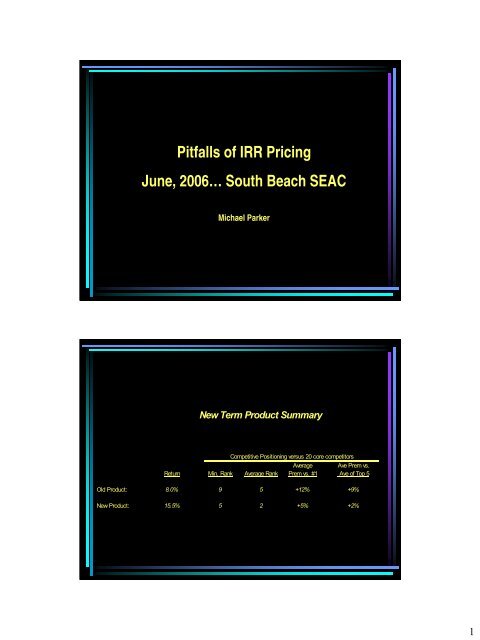
<strong>Pitfalls</strong> <strong>of</strong> <strong>IRR</strong> <strong>Pricing</strong><br />
June, 2006… South Beach SEAC<br />
Michael Parker<br />
New Term Product Summary<br />
Competitive Positioning versus 20 core <strong>com</strong>petitors<br />
Average Ave Prem vs.<br />
Return Min. Rank Average Rank Prem vs. #1 Ave <strong>of</strong> Top 5<br />
Old Product: 8.0% 9 5 +12% +9%<br />
New Product: 15.5% 5 2 +5% +2%<br />
1
Sales Jump!<br />
Agents get record bonuses!<br />
Humphrey Sanders gets a promotion and raise!<br />
The CFO appears on the cover <strong>of</strong> “Forbes” magazine.<br />
Who loses?<br />
… To be answered later.<br />
Where are the Earnings ??!!!<br />
2
Roadmap for this Presentation<br />
-- Use the Term Insurance Example above (featuring a 3rd party Capital Solution) to Expose<br />
Some <strong>of</strong> the Short<strong>com</strong>ings <strong>of</strong> the <strong>IRR</strong> measure.<br />
-- Create a better pricing report<br />
> <strong>IRR</strong> Pr<strong>of</strong>it versus $$$ Pr<strong>of</strong>it.<br />
> Risk<br />
> GAAP Earnings<br />
-- Using the knowledge gained above, analyze the <strong>IRR</strong>'s short<strong>com</strong>ings in Other Business Scenarios<br />
> Agent Commission Example<br />
> IOLI Example<br />
What <strong>IRR</strong> is:<br />
-- A beautiful and powerful tool for re-imagining a Business, Business Unit, Product,<br />
or Product Line as a bond-like investment.<br />
-- A percentage<br />
-- A measure <strong>of</strong> the rate <strong>of</strong> incidence <strong>of</strong> Pr<strong>of</strong>it<br />
-- Technically, the return rate at which a set <strong>of</strong> Cash flows will present value back to zero.<br />
3
What <strong>IRR</strong> is not :<br />
-- A measure <strong>of</strong> pr<strong>of</strong>it level .<br />
-- Dependable as an all-en<strong>com</strong>passing indicator <strong>of</strong> financial well-being<br />
Comparative 8% Investments<br />
Coupon Fixed Period Humphrey Term<br />
& Redemption Bond Annuity (Before Capital Solution)<br />
<strong>IRR</strong> 8.0% 8.0% 8.0%<br />
PV Pr<strong>of</strong>its $295 $188 $159<br />
FY Investment: 1,000 1,000 1,000<br />
1 (1,000) (1,000) (1,000)<br />
2 80 160 223<br />
3 80 160 201<br />
4 80 160 181<br />
5 80 160 163<br />
6 80 160 146<br />
7 80 160 132<br />
8 80 160 119<br />
9 80 160 107<br />
10 1,080 160 96<br />
4
Comparative 8% Investments<br />
Coupon Fixed Period Humphrey Term<br />
& Redemption Bond Annuity (Before Capital Solution)<br />
<strong>IRR</strong> 8.0% 8.0% 8.0%<br />
PV Pr<strong>of</strong>its $295 $188 $159<br />
FY Investment: 1,000 1,000 1,000<br />
1 (1,000) (1,000) (1,000)<br />
2 80 160 223<br />
3 80 160 201<br />
4 80 160 181<br />
5 80 160 163<br />
6 80 160 146<br />
7 80 160 132<br />
8 80 160 119<br />
9 80 160 107<br />
10 1,080 160 96<br />
5
Capital Soultion Impact on Cash Flows<br />
Humphrey Term Capital Humphrey Term<br />
(Before Capital Solution) Solution<br />
Cash Flows<br />
(After Capital Solution)<br />
<strong>IRR</strong> 8.0% 15.5% 94%<br />
PV Pr<strong>of</strong>its $159 $13 -92%<br />
FY Investment: 1,000 100 -90%<br />
1 (1,000) 900 (100)<br />
2 223 (73) 150<br />
3 201 (51) 150<br />
4 181 (81) 100<br />
5 163 (113) 50<br />
6 146 (96) 50<br />
7 132 (182) (50)<br />
8 119 (219) (100)<br />
9 107 (257) (150)<br />
10 96 (261) (165)<br />
6
Pushing the Limit<br />
Capital<br />
Extreme<br />
Before Capital Solution Solution<br />
Cash Flows<br />
Capital Solution<br />
<strong>IRR</strong> 8.0% 9900.0% 123679%<br />
PV Pr<strong>of</strong>its $159 $1 -99%<br />
FY Investment: 1,000 0 -100%<br />
1 (1,000) 999.99 (0.01)<br />
2 223 (222) 1<br />
3 201 (201) -<br />
4 181 (181) -<br />
5 163 (163) -<br />
6 146 (146) -<br />
7 132 (132) -<br />
8 119 (119) -<br />
9 107 (107) -<br />
10 96 (96) -<br />
Capital Budget <strong>of</strong> $1,000,000 for this Product<br />
<strong>IRR</strong>: 8.0% 15.5% 5.5% 6.3%<br />
PV Pr<strong>of</strong>its: $158,969 $12,812 $103,521 $116,333<br />
FY Investment: $1,000,000 $100,000 $900,000 $1,000,000<br />
Sell 1000 Policies Invest $900,000<br />
Corporate Invest $1,000,000 in 8% $100,000 in Term Difference in Total Corporate<br />
Capital Available Term Business Business 5.5% Bonds Cash Flows<br />
1 1,000,000 (1,000,000) (100,000) (900,000) (1,000,000)<br />
2 223,257 150,000 49,500 199,500<br />
3 200,931 150,000 49,500 199,500<br />
4 180,838 100,000 49,500 149,500<br />
5 162,754 50,000 49,500 99,500<br />
6 146,479 50,000 49,500 99,500<br />
7 131,831 (50,000) 49,500 (500)<br />
8 118,648 (100,000) 49,500 (50,500)<br />
9 106,783 (150,000) 49,500 (100,500)<br />
10 96,105 (164,619) 949,500 784,881<br />
7
Risk Exposure Inherent in Thin Cash Flows<br />
Be fore After Before After<br />
Capital Sol ution Ca pital Solution Ma l-Experience Capital Solution Capital Solution<br />
Impact<br />
<strong>IRR</strong> 8.0% 15.5% 7.0% -26.3%<br />
PV Pr<strong>of</strong>its $159 $13 $118 ($28)<br />
FY Investment: 1,000 100 1,005 105<br />
1 (1,000) (100) (5) (1,005) (105)<br />
2 223 150 (5) 218 145<br />
3 201 150 (5) 196 145<br />
4 181 100 (5) 176 95<br />
5 163 50 (5) 158 45<br />
6 146 50 (5) 141 45<br />
7 132 (50) (5) 127 (55)<br />
8 119 (100) (5) 114 (105)<br />
9 107 (150) (5) 102 (155)<br />
10 96 (165) (5) 91 (170)<br />
Impact <strong>of</strong> GAAP on Humphrey Term Distributable Earnings<br />
Statutory<br />
GAAP<br />
Before After Before After<br />
Capital Solution Ca pital Solution<br />
Capita l Solution Capital Solution<br />
<strong>IRR</strong> 8.0% 15.5% Net GAAP Impacts<br />
PV Pr<strong>of</strong>its $159 $13 $301 ($53)<br />
FY Investment: 1,000 100<br />
Before CS Afte r CS<br />
1 (1,000) (100) 1,040 93 40 (7)<br />
2 223 150 (185) (157) 39 (7)<br />
3 201 150 (164) (157) 37 (7)<br />
4 181 100 (143) (107) 38 (7)<br />
5 163 50 (126) (56) 37 (6)<br />
6 146 50 (113) (56) 33 (6)<br />
7 132 (50) (97) 44 35 (6)<br />
8 119 (100) (82) 94 36 (6)<br />
9 107 (150) (71) 144 36 (6)<br />
10 96 (165) (59) 158 37 (6)<br />
8
Impact <strong>of</strong> GAAP on Humphrey Term Distributable Earnings<br />
Statutory<br />
GAAP<br />
Before After Before After<br />
Capital Solution Ca pital Solution<br />
Capita l Solution Capital Solution<br />
<strong>IRR</strong> 8.0% 15.5% Net GAAP Impacts<br />
PV Pr<strong>of</strong>its $159 $13 $301 ($53)<br />
FY Investment: 1,000 100<br />
Before CS Afte r CS<br />
1 (1,000) (100) 1,040 93 40 (7)<br />
2 223 150 (185) (157) 39 (7)<br />
3 201 150 (164) (157) 37 (7)<br />
4 181 100 (143) (107) 38 (7)<br />
5 163 50 (126) (56) 37 (6)<br />
6 146 50 (113) (56) 33 (6)<br />
7 132 (50) (97) 44 35 (6)<br />
8 119 (100) (82) 94 36 (6)<br />
9 107 (150) (71) 144 36 (6)<br />
10 96 (165) (59) 158 37 (6)<br />
<strong>Pricing</strong> / Capital Allocation Report For Upper Management<br />
Statutory Analysis<br />
Capital Solution<br />
Utilization Investment Return PV Pr<strong>of</strong>its Risk<br />
High $100,000 15.5% $12,812 High<br />
Medium High $250,000 14.1% $37,171 Medium High<br />
Medium $500,000 10.7% $77,771 Medium<br />
None $1,000, 000 8.0% $158,969 Low<br />
9
<strong>Pricing</strong> / Capital Allocation Report For Upper Management<br />
Statutory Analysis<br />
Capital Solution<br />
Utilization Investment Return PV Pr<strong>of</strong>its Risk<br />
High $100,000 15.5% $12,812 High<br />
Medium High $250,000 14.1% $37,171 M edium Hi gh<br />
Medium $500,000 10.7% $77,771 Medium<br />
None $1,000, 000 8.0% $158,969 Low<br />
<strong>Pricing</strong> / Capital Allocation Report For Upper Management<br />
Statutory Analysis<br />
Capital Solution<br />
Utilization FY Investment Return PV Pr<strong>of</strong>its Risk<br />
High $100,000 15.5% $12,812 High<br />
Medium High $250,000 14.1% $37,171 Medium High<br />
Medium $500,000 10.7% $77,771 Medium<br />
None $1,000,000 8.0% $158,969 Low<br />
Projected GAAP Earnings by Year per $1000 Statutory Investment:<br />
Capital Solution<br />
Utilization 1 2 3 4 5<br />
High ($71) ($68) ($65) ($67) ($65)<br />
None $40 $39 $37 $38 $37<br />
10
Analyzing the Year 10 Commission Scheme<br />
The Deal: Rather than paying out Year 1 Commissions today, accumulate at 7.5% interest<br />
and pay in ten years.<br />
The Analysis:<br />
Pr<strong>of</strong>it PV 25Yr Common<br />
<strong>IRR</strong> Margin GAAP Earnings Sense<br />
Base Product 14% 7.4% 101% Resonable<br />
Revised Commission Scheme 14% 3.6% 55% Mighty<br />
Generous<br />
11
New Growth Strategy<br />
1 Reorganize Sales force to pursue Older Aged Sales<br />
2 Revamp UL Product to meet this Market's needs (lower premiums).<br />
Why do it?<br />
> Fertile demogarphics (lots <strong>of</strong> available business!)<br />
-- Tap IOLI markets<br />
> Larger Sales Premium per case<br />
> Higher pr<strong>of</strong>its??<br />
Pr<strong>of</strong>itability <strong>of</strong> Current Sales Strategy<br />
($59.8 million <strong>of</strong> Sales Premiums)<br />
% <strong>of</strong> Pr<strong>of</strong>it PV Pr<strong>of</strong>its<br />
Sales Premium <strong>IRR</strong> Margin Strain ($1000s)<br />
Younger Aged 65% 11.3% 9.0% 64% 29,000<br />
Age 70+ 35% 17.1% 10.9% 40% 18,016<br />
Total: 100% 12.4% 9.1% 56% 47,016<br />
12
Pr<strong>of</strong>itability <strong>of</strong> Current Sales Strategy<br />
($59.8 million <strong>of</strong> Sales Premiums)<br />
% <strong>of</strong> Pr<strong>of</strong>it PV Pr<strong>of</strong>its<br />
Sales Premium <strong>IRR</strong> Margin Strain ($1000s)<br />
Younger Aged 65% 11.3% 9.0% 64% 29,000<br />
Age 70+ 35% 17.1% 10.9% 40% 18,016<br />
Total: 100% 12.4% 9.1% 56% 47,016<br />
New Age 70+ 11.4% 4.4% 42%<br />
Pr<strong>of</strong>itability <strong>of</strong> Older-Aged Sales Strategy<br />
($71.1 million <strong>of</strong> Sales Premiums)<br />
% <strong>of</strong> Pr<strong>of</strong>it PV Pr<strong>of</strong>its<br />
Sales Premium <strong>IRR</strong> Margin Strain ($1000s)<br />
Younger Aged 35% 11.3% 9.0% 63% 18,740<br />
Age 70+ 65% 11.4% 4.4% 42% 16,093<br />
Total: 100% 11.4% 5.6% 48% 34,833<br />
-26%<br />
13
Take Aways<br />
> A high <strong>IRR</strong> can be cooked up through low strain.<br />
> Not all <strong>IRR</strong>s are created Equal. Some have greater :<br />
- Dollar Pr<strong>of</strong>its<br />
- GAAP Earnings<br />
- Risk<br />
> <strong>IRR</strong> is an essential and indespensible Pr<strong>of</strong>itability Statistic<br />
when used appropriately as a measure <strong>of</strong> the Rate <strong>of</strong> Earnings.<br />
14