TVK Annual Report 2010 (pdf, 2.5 MB)
TVK Annual Report 2010 (pdf, 2.5 MB)
TVK Annual Report 2010 (pdf, 2.5 MB)

You also want an ePaper? Increase the reach of your titles
YUMPU automatically turns print PDFs into web optimized ePapers that Google loves.
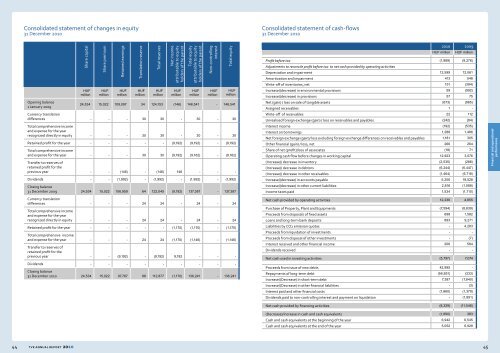
Consolidated statement of changes in equity<br />
31 December <strong>2010</strong><br />
Consolidated statement of cash-flows<br />
31 December <strong>2010</strong><br />
Opening balance<br />
1 January 2009<br />
Share capital<br />
HUF<br />
million<br />
Share premium<br />
HUF<br />
million<br />
Retained earnings<br />
HUF<br />
million<br />
Translation reserve<br />
HUF<br />
million<br />
Total reserves<br />
HUF<br />
million<br />
Net income<br />
attributable to equity<br />
holders of the parent<br />
HUF<br />
million<br />
Total equity<br />
attributable to equity<br />
holders of the parent<br />
HUF<br />
million<br />
Non-controlling<br />
interest<br />
HUF<br />
million<br />
Total equity<br />
HUF<br />
million<br />
24,534 15,022 109,097 34 124,153 (146) 148,541 - 148,541<br />
Currency translation<br />
differences - - - 30 30 - 30 - 30<br />
Total comprehensive income<br />
and expense for the year<br />
recognized directly in equity - - - 30 30 - 30 - 30<br />
Retained profit for the year - - - - - (9,192) (9,192) - (9,192)<br />
Total comprehensive income<br />
and expense for the year - - - 30 30 (9,192) (9,162) - (9,162)<br />
Transfer to reserves of<br />
retained profit for the<br />
previous year - - (146) - (146) 146 - - -<br />
Dividends - - (1,992) - (1,992) - (1,992) - (1,992)<br />
Closing balance<br />
31 December 2009 24,534 15,022 106,959 64 122,045 (9,192) 137,387 - 137,387<br />
Currency translation<br />
differences - - - 24 24 - 24 - 24<br />
Total comprehensive income<br />
and expense for the year<br />
recognized directly in equity - - - 24 24 - 24 - 24<br />
Retained profit for the year - - - - - (1,170) (1,170) - (1,170)<br />
Total comprehensive income<br />
and expense for the year - - - 24 24 (1,170) (1,146) - (1,146)<br />
Transfer to reserves of<br />
retained profit for the<br />
previous year - - (9,192) - (9,192) 9,192 - - -<br />
Dividends - - - - - - - - -<br />
Closing balance<br />
31 December <strong>2010</strong> 24,534 15,022 97,767 88 112,877 (1,170) 136,241 - 136,241<br />
<strong>2010</strong> 2009<br />
HUF million HUF million<br />
Profit before tax (1,989) (9,276)<br />
Adjustments to reconcile profit before tax to net cash provided by operating activities<br />
Depreciation and impairment 12,599 12,061<br />
Amortization and impairment 413 548<br />
Write-off of inventories, net 151 (394)<br />
Increase/(decrease) in environmental provisions 59 (592)<br />
Increase/(decrease) in provisions 57 75<br />
Net (gain) / loss on sale of tangible assets (673) (965)<br />
Assigned receivables 1 -<br />
Write-off of receivables 22 112<br />
Unrealised foreign exchange (gain) / loss on receivables and payables (242) (84)<br />
Interest income (192) (535)<br />
Interest on borrowings 1,288 1,486<br />
Net foreign exchange (gain)/ loss excluding foreign exchange differences on receivables and payables 1,181 305<br />
Other financial (gain) / loss, net 266 264<br />
Share of net (profit)/loss of associates (18) 71<br />
Operating cash flow before changes in working capital 12,923 3,076<br />
(Increase)/ decrease in inventory (2,535) (286)<br />
(Increase)/ decrease in debtors (6,244) (6,447)<br />
(Increase)/ decrease in other receivables (1,464) (6,718)<br />
Increase/(decrease) in accounts payable 5,206 18,528<br />
Increase/(decrease) in other current liabilities 2,816 (1,588)<br />
Income taxes paid 1,534 (1,710)<br />
Net cash provided by operating activities 12,236 4,855<br />
Purchase of Property, Plant and Equipments (7,594) (8,639)<br />
Proceeds from disposals of fixed assets 698 1,582<br />
Loans and long-term bank deposits 893 9,271<br />
Liabilities by CO2 emission quotas - 4,283<br />
Proceeds from liquidation of investments - -<br />
Proceeds from disposal of other investments - (7)<br />
Interest received and other financial income 206 584<br />
Dividends received - -<br />
Net cash used in investing activities (5,797) 7,074<br />
Proceeds from issue of new debts 42,995 -<br />
Repayments of long-term debt (56,851) (333)<br />
Increase/(Decrease) in short-term debt 7,387 (7,840)<br />
Increase/(Decrease) in other financial liabilities - (3)<br />
Interest paid and other financial costs (1,860) (1,379)<br />
Dividends paid to non-controlling interest and payment on liquidation - (1,991)<br />
Financial and operational<br />
performance<br />
Net cash provided by financing activities (8,329) (11,546)<br />
(Decrease)/increase in cash and cash equivalents (1,890) 383<br />
Cash and cash equivalents at the beginning of the year 6,942 6,545<br />
Cash and cash equivalents at the end of the year 5,052 6,928<br />
44 <strong>TVK</strong> <strong>Annual</strong> <strong>Report</strong> <strong>2010</strong><br />
45