Introduction to the HCUP Nationwide Inpatient Sample (NIS)
Introduction to the HCUP Nationwide Inpatient Sample (NIS)
Introduction to the HCUP Nationwide Inpatient Sample (NIS)
Create successful ePaper yourself
Turn your PDF publications into a flip-book with our unique Google optimized e-Paper software.
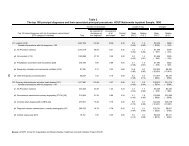
Table 8: Number of Hospitals and Discharges in 2009 AHA Universe, Frame, and <strong>NIS</strong>, by<br />
State<br />
State<br />
Number of Hospitals and Discharges in 2009 AHA Universe, Frame, and <strong>NIS</strong>, by State<br />
AHA Frame <strong>NIS</strong><br />
Hospitals Discharges Hospitals Discharges Hospitals Discharges<br />
Weighted<br />
Discharges<br />
Non-<strong>NIS</strong> States 334 1,770,421 0 0 0 0 0<br />
Arizona 76 807,765 74 778,259 17 140,894 685,556<br />
Arkansas 88 418,197 86 397,989 20 82,524 428,744<br />
California 350 3,951,394 347 3,858,856 82 901,279 4,325,433<br />
Colorado 81 508,064 74 484,707 19 156,401 728,694<br />
Connecticut 34 445,506 29 428,021 7 98,266 526,881<br />
Florida 201 2,638,379 199 2,549,132 50 670,080 3,390,281<br />
Georgia 151 1,086,555 148 1,058,371 43 269,146 1,344,582<br />
Hawaii 24 119,206 20 94,532 3 6,712 35,134<br />
Illinois 185 1,699,263 184 1,630,925 41 364,160 1,856,905<br />
Indiana 127 825,609 115 786,089 27 188,850 954,454<br />
Iowa 118 388,287 117 348,142 25 64,231 318,532<br />
Kansas 142 364,391 125 331,520 27 64,830 319,477<br />
Kentucky 103 636,294 101 623,309 23 146,772 747,019<br />
Louisiana 168 737,376 109 580,777 29 107,695 546,237<br />
Maine 36 160,419 32 78,601 6 12,472 65,883<br />
Maryland 47 776,403 47 767,921 8 148,423 749,834<br />
Massachusetts 73 879,945 64 844,948 14 133,087 704,454<br />
Michigan 156 1,327,020 117 933,986 27 178,485 888,910<br />
Minnesota 133 687,926 127 565,150 30 121,238 601,893<br />
Missouri 130 902,346 121 881,195 29 198,586 1,007,699<br />
Montana 52 111,473 42 102,050 10 23,754 128,417<br />
Nebraska 89 235,584 82 164,802 19 45,187 224,389<br />
Nevada 37 296,058 36 293,531 8 69,276 361,382<br />
New Hampshire 26 133,136 26 127,211 5 41,564 187,847<br />
New Jersey 71 1,175,760 70 1,110,425 14 226,033 1,203,081<br />
New Mexico 39 211,386 35 163,082 7 20,469 93,764<br />
New York 187 2,749,912 187 2,598,322 41 540,878 2,924,354<br />
North Carolina 115 1,147,716 113 1,114,952 30 300,636 1,514,419<br />
Ohio 191 1,663,083 160 1,611,394 40 425,216 2,116,207<br />
Oklahoma 133 514,346 123 463,488 39 153,430 753,767<br />
<strong>HCUP</strong> <strong>NIS</strong> (09/06/2011) I-19 Appendix I<br />
Tables and Figures


