Isolated ileal interposition in enteroendocrine L cells differentiation
Isolated ileal interposition in enteroendocrine L cells differentiation
Isolated ileal interposition in enteroendocrine L cells differentiation

Create successful ePaper yourself
Turn your PDF publications into a flip-book with our unique Google optimized e-Paper software.
from the product of serum <strong>in</strong>sul<strong>in</strong> (mU/mL), glycaemia (mg/mL), and the constant 0.05551<br />
divided by 22.5.<br />
- Insul<strong>in</strong> Tolerance Test (ITT): will be performed <strong>in</strong> all animals on the day of study onset (W12),<br />
two weeks before surgery (S26), eight weeks after surgery (W36), and euthanasia (W44). The<br />
rate of glucose removal will be calculated us<strong>in</strong>g the formula In2/t1/2; t1/2 will be calculated<br />
for glucose from the m<strong>in</strong>imum slope of the regression curve dur<strong>in</strong>g the phase of l<strong>in</strong>ear decay<br />
of serum glucose concentration us<strong>in</strong>g PRISMA software.<br />
3.12. Tissue collection<br />
After euthanasia, the follow<strong>in</strong>g fragments of <strong>in</strong>test<strong>in</strong>al tissue will be collected for<br />
Nature Preced<strong>in</strong>gs : doi:10.1038/npre.2011.6614.2 : Posted 30 Nov 2011<br />
histological analysis by immunofluorescence and gene expression analysis by molecular<br />
biology:<br />
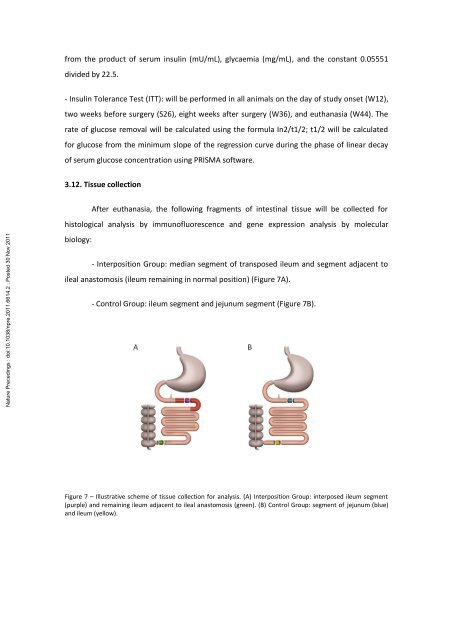
- Interposition Group: median segment of transposed ileum and segment adjacent to<br />
<strong>ileal</strong> anastomosis (ileum rema<strong>in</strong><strong>in</strong>g <strong>in</strong> normal position) (Figure 7A).<br />
- Control Group: ileum segment and jejunum segment (Figure 7B).<br />
Figure 7 – Illustrative scheme of tissue collection for analysis. (A) Interposition Group: <strong>in</strong>terposed ileum segment<br />
(purple) and rema<strong>in</strong><strong>in</strong>g ileum adjacent to <strong>ileal</strong> anastomosis (green). (B) Control Group: segment of jejunum (blue)<br />
and ileum (yellow).