Isolated ileal interposition in enteroendocrine L cells differentiation
Isolated ileal interposition in enteroendocrine L cells differentiation
Isolated ileal interposition in enteroendocrine L cells differentiation

You also want an ePaper? Increase the reach of your titles
YUMPU automatically turns print PDFs into web optimized ePapers that Google loves.
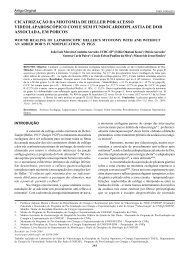
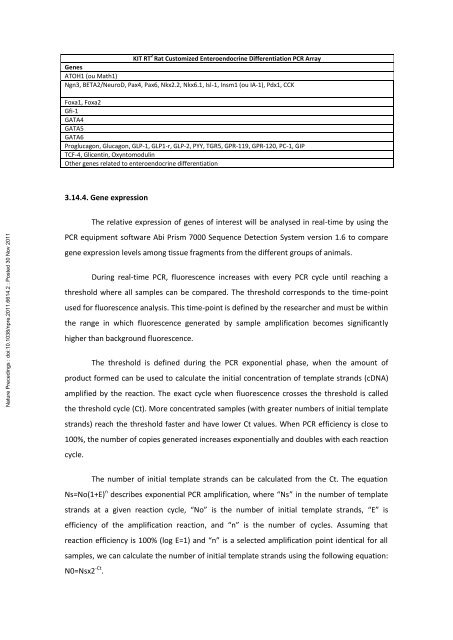
KIT RT 2 Rat Customized Enteroendocr<strong>in</strong>e Differentiation PCR Array<br />
Genes<br />
ATOH1 (ou Math1)<br />
Ngn3, BETA2/NeuroD, Pax4, Pax6, Nkx2.2, Nkx6.1, Isl-1, Insm1 (ou IA-1), Pdx1, CCK<br />
Foxa1, Foxa2<br />
Gfi-1<br />
GATA4<br />
GATA5<br />
GATA6<br />
Proglucagon, Glucagon, GLP-1, GLP1-r, GLP-2, PYY, TGR5, GPR-119, GPR-120, PC-1, GIP<br />
TCF-4, Glicent<strong>in</strong>, Oxyntomodul<strong>in</strong><br />
Other genes related to enteroendocr<strong>in</strong>e <strong>differentiation</strong><br />
3.14.4. Gene expression<br />
Nature Preced<strong>in</strong>gs : doi:10.1038/npre.2011.6614.2 : Posted 30 Nov 2011<br />
The relative expression of genes of <strong>in</strong>terest will be analysed <strong>in</strong> real-time by us<strong>in</strong>g the<br />
PCR equipment software Abi Prism 7000 Sequence Detection System version 1.6 to compare<br />
gene expression levels among tissue fragments from the different groups of animals.<br />
Dur<strong>in</strong>g real-time PCR, fluorescence <strong>in</strong>creases with every PCR cycle until reach<strong>in</strong>g a<br />
threshold where all samples can be compared. The threshold corresponds to the time-po<strong>in</strong>t<br />
used for fluorescence analysis. This time-po<strong>in</strong>t is def<strong>in</strong>ed by the researcher and must be with<strong>in</strong><br />
the range <strong>in</strong> which fluorescence generated by sample amplification becomes significantly<br />
higher than background fluorescence.<br />
The threshold is def<strong>in</strong>ed dur<strong>in</strong>g the PCR exponential phase, when the amount of<br />
product formed can be used to calculate the <strong>in</strong>itial concentration of template strands (cDNA)<br />
amplified by the reaction. The exact cycle when fluorescence crosses the threshold is called<br />
the threshold cycle (Ct). More concentrated samples (with greater numbers of <strong>in</strong>itial template<br />
strands) reach the threshold faster and have lower Ct values. When PCR efficiency is close to<br />
100%, the number of copies generated <strong>in</strong>creases exponentially and doubles with each reaction<br />
cycle.<br />
The number of <strong>in</strong>itial template strands can be calculated from the Ct. The equation<br />
Ns=No(1+E) n describes exponential PCR amplification, where “Ns” <strong>in</strong> the number of template<br />
strands at a given reaction cycle, “No” is the number of <strong>in</strong>itial template strands, “E” is<br />
efficiency of the amplification reaction, and “n” is the number of cycles. Assum<strong>in</strong>g that<br />
reaction efficiency is 100% (log E=1) and “n” is a selected amplification po<strong>in</strong>t identical for all<br />
samples, we can calculate the number of <strong>in</strong>itial template strands us<strong>in</strong>g the follow<strong>in</strong>g equation:<br />
N0=Nsx2 -Ct .