RACE AND THE ENFORCEMENT OF DRUG DELIVERY LAWS IN ...
RACE AND THE ENFORCEMENT OF DRUG DELIVERY LAWS IN ...
RACE AND THE ENFORCEMENT OF DRUG DELIVERY LAWS IN ...

You also want an ePaper? Increase the reach of your titles
YUMPU automatically turns print PDFs into web optimized ePapers that Google loves.
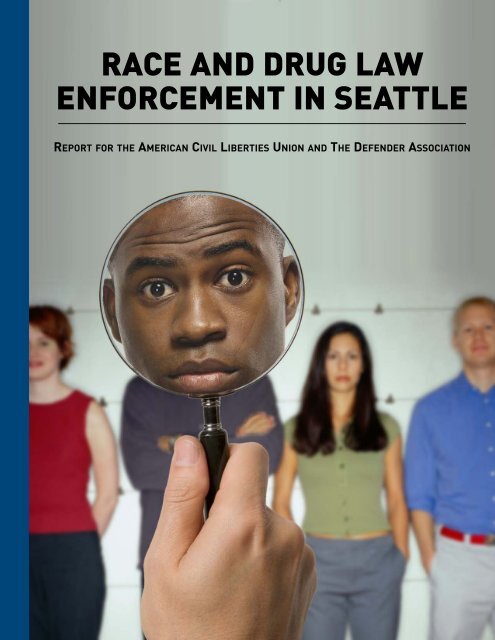
<strong>RACE</strong> <strong>AND</strong> <strong>DRUG</strong> LAW<br />
<strong>ENFORCEMENT</strong> <strong>IN</strong> SEATTLE<br />
REPORT FOR <strong>THE</strong> AMERICAN CIVIL LIBERTIES UNION <strong>AND</strong> <strong>THE</strong> DEFENDER ASSOCIATION
<strong>RACE</strong> <strong>AND</strong> <strong>DRUG</strong> LAW <strong>ENFORCEMENT</strong> <strong>IN</strong> SEATTLE<br />
REPORT PREPARED FOR <strong>THE</strong> ACLU <strong>DRUG</strong> LAW REFORM PROJECT<br />
<strong>AND</strong> <strong>THE</strong> DEFENDER ASSOCIATION<br />
September 2008<br />
KA<strong>THE</strong>R<strong>IN</strong>E BECKETT<br />
Associate Professor<br />
Department of Sociology<br />
Law, Societies & Justice Program<br />
University of Washington
This report was commissioned as part of litigation challenging the<br />
selective enforcement of drug laws against African Americans in<br />
Seattle. The arrest and complaint data analyzed in the report<br />
were produced by the Seattle Police Department in the course of<br />
the litigation.<br />
<strong>THE</strong> AMERICAN CIVIL LIBERTIES UNION is our nation’s<br />
guardian of liberty, working daily in courts, legislatures and<br />
communities to defend and preserve the individual rights<br />
and liberties that the Constitution and laws of the United<br />
States guarantee everyone in this country.<br />
<strong>THE</strong> ACLU <strong>DRUG</strong> LAW REFORM PROJECT is a division of the<br />
national ACLU. The Project’s goal is to end punitive drug<br />
policies that cause the widespread violation of constitutional<br />
and human rights, as well as unprecedented levels of<br />
incarceration.<br />
<strong>THE</strong> DEFENDER ASSOCIATION is a non-profit law firm<br />
providing public defender services to King County and the<br />
City of Seattle since 1969. Its Racial Disparity Project has<br />
worked since 1998 to reduce racial inequality in the criminal<br />
justice system. The project is supported by the JEHT<br />
Foundation, the Open Society Institute, the Drug Policy<br />
Alliance and the Massena Family Foundation, among other<br />
funders.<br />
Design: Daniel Berger<br />
The individuals depicted on the front cover of this report are models and are used for illustrative<br />
purposes only.
TABLE <strong>OF</strong> CONTENTS<br />
PAGE<br />
Summary of Findings 1<br />
Introduction 5<br />
Racial Disparity in Seattle Drug Arrests 7<br />
Research Design and Organization of the Report 13<br />
Part I: The Seattle Drug Market 17<br />
Patterns of Drug Use among Seattle Residents 19<br />
The Racial and Ethnic Composition of Drug Deliverers in Seattle 40<br />
Race, Ethnicity and the Seattle Drug Market: Conclusions 44<br />
Part II: Seattle Drug Delivery Arrests 47<br />
2005–2006 Seattle Drug Delivery Arrests 48<br />
Racial Disparity in Seattle Drug Arrests in Comparative Perspective 54<br />
Part III: Explaining Racial Disparity in Seattle Drug Arrests 59<br />
Hypothesis 1: Racial Disparity in Drug Arrests Is a Function 60<br />
of Race Differences in Involvement in Drug Delivery<br />
Hypothesis 2: The Focus on Outdoor Drug Markets 73<br />
Explains Racial Disparity in Drug Arrests<br />
Hypothesis 3: Racial Disproportionality Stems from the 74<br />
Concentration of Drug Law Enforcement Resources Downtown<br />
Hypothesis 4: The Focus on Crack Cocaine Explains Racial 75<br />
Disproportionality in Seattle Drug Arrests<br />
Conclusion 99<br />
References 101<br />
Appendices<br />
Appendix A: Public Drug Treatment Admissions among 111<br />
Seattle Residents<br />
Appendix B: Unreliable 9-1-1 Call Examples 112
LIST <strong>OF</strong> TABLES <strong>AND</strong> FIGURES<br />
PAGE<br />
TABLES:<br />
Table 1. Black and White Drug Arrest Rates and Black/White Arrest 9<br />
Rate Ratio, U.S. Mid-Sized Cities, 2000<br />
Table 2. SAMHSA Survey on Drug Use and Health, Recent Drug Use among 22<br />
Seattle Residents Aged 12 and Older, 2002–2006<br />
Table 3. The Racial and Ethnic Composition of Needle Exchangers 31<br />
Who Recently Obtained Serious Drugs in Seattle<br />
Table 4. Race and Ethnicity of Seattle Residents Admitted to Public Drug 34<br />
Treatment Programs by Primary Drug of Abuse and Referral Source, 2006<br />
Table 5. Racial and Ethnic Composition of Observed Drug Purchasers, 39<br />
Capitol Hill and Downtown Seattle, 2007<br />
Table 6. The Racial and Ethnic Composition of Seattle Providers of Serious 42<br />
Drugs, 2007–2008 Seattle-King County Needle Exchange Survey<br />
Table 7. Racial and Ethnic Composition of Observed Drug Deliverers, 44<br />
Capitol Hill and Downtown Seattle, 2007<br />
Table 8. Summary of Data Pertaining to Racial and Ethnic Composition of 46<br />
Seattle Users and Deliverers of All Serious Drugs<br />
Table 9. The Race and Ethnicity of Seattle Drug Delivery Arrestees, 49<br />
2005–2006<br />
Table 10. Racial Disparity in Drug Arrests in Mid-Sized U.S. Cities, 2006 56<br />
Table 11. Comparison of Racial/Ethnic Composition of Drug 61<br />
Deliverers and Drug Delivery Arrestees<br />
Table 12. Racial and Ethnic Composition of Downtown Drug Deliverers, 64<br />
Seattle-King County Needle Exchange Survey<br />
Table 13. Racial and Ethnic Composition of Downtown Drug Deliverers 65<br />
by Drug, Seattle-King County Needle Exchange Survey
Table 14. Racial and Ethnic Composition of Downtown Drug Deliverers 66<br />
Table 15. Statistical Significance of the Difference between the Racial/ 68<br />
Ethnic Composition of Observed Downtown Drug Deliverers and<br />
Downtown Drug Delivery Arrestees<br />
Table 16. Statistical Significance of the Difference between the 71<br />
Racial/Ethnic Composition of Observed Drug Deliverers and Drug<br />
Delivery Arrestees<br />
Table 17. The Racial/Ethnic Composition of Drug Deliverers and Drug 72<br />
Delivery Arrestees, University District<br />
Table 18. Comparison of Civilian Complaints and Drug Delivery Arrests 91<br />
Table 19. Weapons Found in Seattle Drug Arrests, 2005–2006 96<br />
FIGURES:<br />
Figure 1. SAMHSA Survey Results for City of Seattle: Drug Activity in 21<br />
Past Year, 2002–2006<br />
Figure 2. Drug Use in Past 30 Days among Seattle Public School 23<br />
Students, 2004<br />
Figure 3. Prevalence of Past Month Drug Use among Seattle Public 24<br />
School Students<br />
Figure 4. Racial and Ethnic Composition of Seattle-King County 30<br />
Needle Exchangers by Survey Status<br />
Figure 5. Drug Treatment Admissions among Seattle Residents by 32<br />
Primary Drug of Abuse, 2005–2007<br />
Figure 6. Drug-Related Deaths among Seattle Residents by Race, 36<br />
2005–2007<br />
Figure 7. Purposeful Seattle Drug Delivery Arrests by Drug, 1999–2001 48<br />
and 2005–2006<br />
Figure 8. Purposeful Seattle Drug Delivery Arrests by Operation Type, 50<br />
2005–2006
Figure 9. Purposeful Seattle Drug Delivery Arrests by Operation Type 51<br />
and Race, 2005–2006<br />
Figure 10. Purposeful Seattle Drug Delivery Arrests by Location Type 51<br />
and Race, 2005–2006<br />
Figure 11. Purposeful Seattle Drug Delivery Arrests by Precinct, 52<br />
2005–2006<br />
Figure 12. Geographic Distribution of Seattle Drug Delivery 53<br />
Arrests by Census Tract and Point Location, 2005–2006<br />
Figure 13. Capitol Hill Deliverers and Delivery Arrestees, 2005–2006 69<br />
Figure 14. Percentage of Purposeful Seattle Drug Delivery Arrests 77<br />
Involving Blacks, Crack Cocaine and No Crack Cocaine, 2005–2006<br />
Figure 15. Percentage of Purposeful Delivery Arrests Involving Black 78<br />
Suspects by Arrest Type, 2005–2006<br />
Figure 16. Seattle Treatment Admissions by Drug of Abuse, 2005–2007 81<br />
Figure 17. Geographic Distribution of Narcotics Activity Reports, 86<br />
2005–2006<br />
Figure 18. Geographic Distribution of Civilian Narcotics 9-1-1 Calls 87<br />
Figure 19. Geographic Distribution of Civilian Complaints about Drug 88<br />
Activity and Drug Delivery Arrests<br />
Figure 20. Geographic Distribution of Civilian Narcotics Complaints 89<br />
Figure 21. Geographic Distribution of Seattle Drug Delivery Arrests 90
ACKNOWLEDGEMENTS<br />
I am grateful for the assistance and insights of many. Reliable, smart and<br />
responsive research assistants are difficult to come by, and I am thankful to have<br />
benefited from the support of several: Tyler Corwin, Dave Sharrow, Matt Wilson<br />
and Erin Powers. Caleb Banta-Green, Michael Arthur, James Colliver, Kris Nyrop<br />
and Fritz Wrede provided key data sources and were generous with their time.<br />
Public Health—Seattle & King County collaborated in the design of the 2007–<br />
2008 Seattle-King County Needle Exchange Survey and generously allowed the<br />
needle exchange survey to take place at all seven syringe exchange facilities.<br />
Michael Hanrahan also provided useful information regarding injection drug<br />
users in King County. As always, I am thankful for Steve Herbert’s support and<br />
ideas. This study was commissioned by The Defender Association and the ACLU<br />
Drug Law Reform Project, without whom little would be known about those<br />
arrested for drug law violations in Seattle.
SUMMARY <strong>OF</strong> KEY F<strong>IN</strong>D<strong>IN</strong>GS<br />
F<strong>IN</strong>D<strong>IN</strong>G 1<br />
The majority of those who use and deliver serious drugs in Seattle are<br />
white.<br />
• Data from multiple sources – surveys of public school students,<br />
needle exchange clients, and the general Seattle population;<br />
mortality data; drug treatment admission data; and an observational<br />
study of two outdoor Seattle drug markets – all support the<br />
conclusion that a majority of those who use and deliver serious<br />
illegal drugs with the possible exception of crack cocaine in Seattle<br />
are white.<br />
F<strong>IN</strong>D<strong>IN</strong>G 2<br />
The majority of those purposefully arrested for delivering a serious drug<br />
in Seattle are black, and blacks are over-represented among drug<br />
arrestees to a greater degree than in nearly all other mid-sized cities.<br />
• Although the city population is 8 percent black, two-thirds (67<br />
percent) of those arrested in Seattle for delivery of a serious drug in<br />
a four-month sample from 2005–2006 were black.<br />
• The black drug arrest rate in 2006 was more than 13 times higher<br />
than the white drug arrest rate.<br />
• The black drug arrest rate for delivery of a serious drug is more than<br />
21 times higher than the white arrest rate for the same crime.<br />
• In 2006, only one of 38 comparable mid-sized cities had a higher<br />
degree of racial disproportionality in drug arrests than Seattle.<br />
1
F<strong>IN</strong>D<strong>IN</strong>G 3<br />
The focus on crack cocaine is the fundamental cause of racial disparity in<br />
Seattle drug delivery arrests.<br />
• The over-representation of blacks among drug delivery arrestees is<br />
not primarily a function of racial differences in drug delivery.<br />
o Blacks delivering drugs downtown are 13.6 times more likely to<br />
be arrested than whites engaging in the same behavior in the<br />
same geographic area.<br />
o Blacks are over-represented by a statistically significant margin<br />
among those arrested in the Capitol Hill and University District<br />
neighborhoods.<br />
• Most blacks who are arrested for delivering serious drugs are<br />
arrested downtown and outdoors. However, the majority of those<br />
arrested in other parts of the city and indoors are also black.<br />
• The focus on crack cocaine is a fundamental cause of racial disparity<br />
in Seattle drug delivery arrests.<br />
o Nearly three-fourths (72.9 percent) of those purposefully arrested<br />
for delivery of a serious drug in 2005–2006 were arrested for<br />
delivering crack cocaine. Nearly three-fourths (73.4 percent) of<br />
those purposefully arrested for delivering crack cocaine in 2005–<br />
2006 were black.<br />
o By contrast, fewer than 20 percent of those arrested for delivery<br />
of a serious drug other than crack were black.<br />
2
F<strong>IN</strong>D<strong>IN</strong>G 4<br />
The focus on crack cocaine is not a function of race-neutral policy<br />
considerations.<br />
• Powder cocaine and ecstasy are the most widely used serious drugs<br />
in Seattle.<br />
• More Seattle residents are admitted to public drug treatment<br />
programs for heroin abuse than for crack cocaine abuse. Heroin<br />
users also report making more frequent purchases than crack<br />
cocaine users. The frequency with which crack cocaine is exchanged<br />
thus does not explain the over-representation of crack cocaine<br />
among Seattle drug arrestees.<br />
• The focus on crack cocaine is not a function of public health<br />
considerations. Although crack cocaine use poses health risks, other<br />
serious drugs, especially heroin and other opiates, are more likely to<br />
be associated with drug-related mortality and infectious disease.<br />
• The focus on crack cocaine is not a function of public safety risks.<br />
Among Seattle serious drug arrestees, those involved with crack<br />
cocaine were least likely to have a dangerous weapon in their<br />
possession at the time of their arrest.<br />
• The focus on crack is not a consequence of civilian complaints about<br />
that particular substance: there is little geographic correspondence<br />
between complaints and delivery arrests, and most complainants do<br />
not identify the drug involved. Moreover, most civilian complaints<br />
about drug activity do not result in arrest, and most arrests do not<br />
involve a civilian complainant.<br />
3
CONCLUSIONS<br />
• The degree to which blacks are over-represented among drug arrestees in<br />
Seattle continues to be large relative to other mid-sized cities.<br />
• Black over-representation in Seattle drug delivery arrests is primarily a<br />
function of the focus on crack cocaine.<br />
• The focus on crack cocaine does not appear to be attributable to the<br />
frequency with which crack cocaine is exchanged, civilian complaints,<br />
public health or public safety considerations.<br />
• Although colorblind on its face, the focus on crack cocaine does not appear<br />
to be a function of race-neutral considerations and continues to produce an<br />
unusually high degree of racial disparity in Seattle drug arrests.<br />
4
<strong>IN</strong>TRODUCTION<br />
Less than 5 percent of the world’s population, but one-fourth of the world’s<br />
prisoners, live in the United States. 1 There are now 2.3 million people living<br />
behind bars in the United States. 2 This state of affairs is relatively new. Since<br />
1972, the U.S. incarceration rate has increased sevenfold to become the highest in<br />
the world. 3 The expansion of the penal system has had particularly adverse<br />
consequences for communities of color. By the end of the 1990s, a young, black<br />
man living in the United States was more likely to have spent time in prison than<br />
to have a college degree. 4 Black men are now eight times more likely to be<br />
incarcerated than white men, 5 and 25 percent of all black children born since 1990<br />
will experience a father being sent to prison by the time they turn 14. 6<br />
These developments concern many. Social scientists and policymakers are<br />
increasingly aware of the adverse consequences of “mass incarceration.” 7<br />
Approximately 700,000 people return home from prison or jail each year, mostly<br />
to poor urban communities. 8 Although those convicted of felony offenses and/or<br />
incarcerated are generally disadvantaged prior to their conviction, there is<br />
evidence that incarceration exacerbates their social and economic disadvantage.<br />
Specifically, imprisonment has been shown to have a negative impact on<br />
individuals’ educational and occupational attainment, earnings, civic<br />
engagement and family life. 9 Even in the absence of incarceration, felony<br />
conviction imposes adverse “collateral consequences” that enhance the social<br />
and financial disadvantage of those convicted and their families. For example,<br />
those who report a felony conviction on their job applications have far less<br />
success on the job market than similarly qualified and carefully matched<br />
applicants who do not report a felony conviction. 10 In Washington State, persons<br />
who have been convicted of a felony offense are also unable to restore their<br />
1<br />
Liptak 2008.<br />
2<br />
Bureau of Justice Statistics n.d.<br />
3<br />
International incarceration rates are available through the International Centre for Prison<br />
Studies, King’s College, London.<br />
4<br />
Pettit and Western 2004.<br />
5<br />
Western 2006.<br />
6<br />
Western 2006.<br />
7<br />
This term is taken from Garland 2001.<br />
8<br />
Western 2006.<br />
9<br />
Hagan and Dinovizer 1999; Manza and Uggen 2006; Mauer and Chesney-Lind 2002; Travis,<br />
McBride and Soloman 2005; Travis and Petersilia 2001; Western and McLanahan 2000; Western<br />
2006.<br />
10<br />
Pager 2003, 2007.<br />
5
voting rights until all of their legal financial obligations are paid. 11 As a result, an<br />
estimated 3.6 percent of the adult state population and 17.2 percent of all adult<br />
African American men living in Washington State were disenfranchised at the<br />
end of 2004. 12<br />
In short, mass incarceration is historically unprecedented and imposes a variety<br />
of social costs on the socially disadvantaged; these consequences may also<br />
adversely impact public safety in the long run. 13 It is also clear that the war on<br />
drugs is an important cause of the expansion of U.S. penal institutions and racial<br />
disparities within them. 14 As the author of one recent study wrote, “There is<br />
perhaps no single factor that has contributed as significantly to the expansion of<br />
racial disparity in the criminal justice system as ‘the war on drugs.’” 15<br />
Indeed, the number of annual drug arrests in the United States nearly tripled in<br />
recent decades, from 581,000 in 1980 to 1.8 million in 2005. 16 From 1980 to 2003,<br />
the black drug arrest rate per 100,000 residents rose from roughly 684 to 2,221<br />
arrests, an increase of 225 percent. By contrast, the white drug arrest rate grew<br />
from 387 to 658 arrests per 100,000 residents during this period, an increase of 70<br />
percent—less than one-third of the rate of increase experienced by blacks. 17 This<br />
racial disproportionality in drug arrests has important, long-term consequences.<br />
By 2003, blacks were 10 times as likely as whites to enter prison as a result of a<br />
drug conviction. 18 As a result, racially disparate drug arrest rates in cities across<br />
the country are the subject of much investigation and concern. 19<br />
11 ACLU 2004; Manza and Uggen 2006.<br />
12 Manza and Uggen 2006, Table A3.3. In March 2006, a Washington State Superior Court ruled<br />
that the state’s denial of the right to vote to ex-felons who are unable to pay their legal financial<br />
obligations in their entirety violates the Equal Protection Clause of the 14th Amendment.<br />
Madison v. State, No. 04-2-33414-4 SEA, 2006 WL 3713715 (Super. Ct. Wash. Mar. 27, 2006).<br />
However, in Madison v. State, 163 P.3d 757 (Wash. 2007), the Washington State Supreme Court<br />
disagreed, ruling that as long as all felons were treated in the same manner the law could not<br />
be considered biased against the poor. Id. at 769.<br />
13 Although crime rates have declined significantly since 1990, studies indicate that only about 10<br />
percent of the crime drop can be attributed to the increased use of prisons. Moreover, this<br />
modest improvement in public safety was purchased at a cost of $53 million in additional<br />
correctional expenditures (Western 2006). Furthermore, crime rates also fell in places like<br />
New York State and Canada, where incarceration rates actually dropped. It thus appears that<br />
there are alternative ways of reducing crime that do not entail the fiscal or social costs<br />
associated with mass incarceration.<br />
14<br />
Blumstein 1993; Duster 1997; King 2008; Tonry 1995; Western 2006.<br />
15<br />
King 2008: 10.<br />
16 King 2008: 4.<br />
17<br />
King 2008: 10.<br />
18 Human Rights Watch 2008: 3.<br />
19<br />
See, for example, Eckholm 2008; Human Rights Watch 2008; Ryan 2008; New York Times 2008.<br />
6
RACIAL DISPARITIES <strong>IN</strong> SEATTLE <strong>DRUG</strong> ARRESTS<br />
Several recent studies indicate that Seattle’s drug arrests are characterized by an<br />
especially high degree of racial disproportionality, and that blacks in particular<br />
are over-represented among Seattle drug arrestees. “Disproportionality” and<br />
“over-representation” are measured in a number of ways in these studies. In<br />
some cases, the conclusion that blacks are over-represented among Seattle drug<br />
arrestees is based on a comparison of the racial composition of Seattle drug<br />
arrestees with the racial composition of the city population. 20 Klement and<br />
Siggins (2001) found, for example, that 8 percent of Seattle’s population, but 57<br />
percent of those arrested for drug crimes in 1999, were black. As these<br />
researchers noted, comparisons of this sort provide a useful starting point, but do<br />
not take into account the racial composition of those who violate drug laws and<br />
are therefore likely candidates for arrest.<br />
Another method involves comparing racial disproportionality in drug arrests in<br />
a particular geographic area with that found in comparably-sized areas. Some<br />
criminal justice analysts have criticized comparisons of arrest rates and general<br />
population statistics on the grounds that the appropriate comparison, or<br />
benchmark, is the offender population rather than the general population. 21<br />
Although it is important to consider the racial composition of those actually<br />
breaking the law, comparing the magnitude of racial disparities (based upon<br />
general population statistics) across jurisdictions is also instructive. 22 Significant<br />
discrepancies in the degree to which blacks are over-represented among drug<br />
arrestees in comparably-sized cities are unlikely to reflect racial differences in<br />
drug law violation. For example, if the black drug arrest rate is twice the white<br />
drug arrest rate in one jurisdiction, but twenty times higher than the white drug<br />
arrest rate in another, analysts often infer that the cause of this variation lies<br />
largely in enforcement practices rather than in racial differences in drug law<br />
offending. 23 Comparisons of this sort entail calculating the black and white drug<br />
arrest rate (per capita), then dividing the former by the latter. The result,<br />
sometimes referred to as the “black-to-white drug arrest ratio,” is a measure of<br />
the extent to which blacks are over-represented among drug arrestees relative to<br />
the general population across jurisdictions.<br />
20 See Klement and Siggins 2001.<br />
21<br />
Buckman and Lamberth 1999; Engel and Calnon 2004.<br />
22 For some recent examples, see King 2008; Human Rights Watch 2008.<br />
23<br />
Ibid.<br />
7
A recent study of black over-representation in drug arrests in U.S. mid-sized<br />
cities in the year 2000 found that only one of these cities (San Francisco) had a<br />
higher black drug arrest rate (i.e. the number of drug arrests involving black<br />
suspects per 1,000 black residents) than Seattle. 24 Moreover, Seattle’s black drug<br />
arrest rate was 10.2 times greater than the white drug arrest rate in the year 2000,<br />
the greatest disparity among all the mid-sized cities for which data are available<br />
(see Table 1). Thus, the data shows that both the black drug arrest rate and the<br />
extent of racial disparity in drug arrests have been comparatively high in Seattle<br />
in recent years.<br />
24<br />
Beckett, Nyrop and Pfingst 2006. These cities include all of those with populations between<br />
500,000 and one million residents that also reported arrest data to the FBI’s Uniform Crime<br />
Reporting Program.<br />
8
Table 1. Black and White Drug Arrest Rates and<br />
Black/White Arrest Rate Ratio, US Mid-Sized Cities, 2000<br />
(A) Black Drug<br />
Arrest Rate (per<br />
1,000 residents)<br />
(B) White Drug<br />
Arrest Rate (per<br />
1,000 residents)<br />
Black/White<br />
Arrest Rate Ratio<br />
(A/B)<br />
Detroit, MI 10.7 8.7 1.2<br />
El Paso, TX 11.7 6.2 1.9<br />
Boston, MA 12.7 5.8 2.2<br />
Honolulu, HA 4.7 2.1 2.3<br />
San Jose, CA 35.3 14.7 2.4<br />
Denver, CO 29.8 11.7 2.5<br />
Memphis, TN 3.1 1.1 2.9<br />
Oklahoma City, OK 19.4 6.2 3.1<br />
Baltimore, MD 33.6 9.7 3.5<br />
Ft. Worth, TX 26.7 6.6 4.1<br />
Charlotte-<br />
Mecklenburg, NC<br />
13.9 3.1 4.5<br />
Nashville, TN 8.6 1.9 4.5<br />
Austin, TX 22.8 4.9 4.6<br />
Indianapolis, <strong>IN</strong> 15.1 3.2 4.8<br />
Portland, OR 51.3 8.9 5.8<br />
San Francisco, CA 88.3 12.3 7.2<br />
Columbus, OH 6.6 0.8 8.0<br />
Seattle, WA 58.4 5.8 10.2<br />
Note and sources: This measure of racial disparity compares the black and white drug arrest<br />
rates for Seattle and mid-sized U.S. cities (i.e. those with populations between 500,000-<br />
1,000,000) that reported drug arrest data to the FBI’s Uniform Crime Reporting program in<br />
2000. The Seattle arrest figures are based on an analysis of incident reports obtained from<br />
the Seattle Police Department and include all types of drug law violations. Population data<br />
are taken from the 2000 U.S. Census. Rates for Charlotte-Mecklenburg are based on<br />
population estimates for the city of Charlotte and are therefore inflated. Because Latinos may<br />
be classified as white, it is possible that data reported by some cities lead to an<br />
underestimation of the disparity between black and non-Hispanic white arrest rates.<br />
9
As noted previously, this type of comparison does not directly control for the<br />
possibility that racial disparities in drug arrest rates are a function of race<br />
differences in offending behavior. That is, it is possible that blacks are overrepresented<br />
among drug arrestees because blacks are more likely than whites to<br />
deliver drugs. However, the existence of significant variation in the black/white<br />
drug arrest rate ratio (shown in the far right column of Table 1) across U.S. cities<br />
suggests that racial disparity in drug arrests has more to do with local drug law<br />
enforcement practices than race differences in offending behavior. Because the<br />
ratios shown in Table 1 reflect differences in arrest rates (per 100,000 residents),<br />
demographic differences across cities have been taken into account, and<br />
differences in the racial composition of city populations cannot explain variation<br />
in the black/white drug arrest ratio. If this variation reflects differential levels of<br />
drug involvement among blacks and whites, it must be inferred from the data<br />
shown in Table 1 that blacks living in Detroit are only 1.2 times more likely to<br />
violate drug laws than whites, but blacks living in Seattle are 10.7 times more<br />
likely to violate drug laws than whites. Although the nature and prevalence of<br />
illicit drug use varies somewhat regionally, there is no known empirical reason<br />
to believe that the prevalence of illicit drug use among whites and blacks varies<br />
by over 1000 percent across U.S. cities. In short, significant geographic variation<br />
in the degree of racial disparity suggests that racial and ethnic differences in<br />
arrest rates are not primarily a function of race differences in offending rates.<br />
Several studies have adopted a third methodological approach, one that involves<br />
gathering and analyzing data regarding those who actually violate drug laws.<br />
This information is then compared with arrest statistics to determine if racial<br />
disparities in drug arrests exist even after possible race differences in offense<br />
rates are taken into account. In other words, these studies attempt to develop a<br />
“benchmark,” or profile of offenders who are likely candidates for arrest, based<br />
on data that shed light on the racial and ethnic composition of those who actually<br />
violate drug laws.<br />
Several studies that utilize this “benchmarking” approach indicate that blacks<br />
are over-represented among those arrested for delivering drugs in Seattle<br />
relative to the racial composition of those who actually deliver controlled<br />
substances. The first of these studies, recently published by the U.S. Department<br />
of Justice, found that race differences in rates of drug-selling were far smaller<br />
than race differences in drug sales arrests among Seattle youth. 25 Specifically,<br />
25 Huizinga et al. 2006. See especially Appendix 3, “Advancing Knowledge on Disproportionate<br />
Minority Confinement: Findings from the Seattle Social Development Project,” by Karl G. Hill, J.<br />
10
esearchers found that rates of drug-selling were 1.9 times higher among black<br />
youth than white youth, but that referral rates (treated in this study as analogous<br />
to arrest) for that same behavior were 18.8 times higher for black than white<br />
youth. The results of the DOJ study indicate that race differences in rates of drug<br />
selling explain approximately 10 percent of the large disparity between black and<br />
white drug arrest rates for Seattle youth, indicating that the vast majority of the<br />
observed racial disparity in those drug sales arrests was largely a function of<br />
enforcement practices rather than racial differences in offense rates.<br />
Similarly, prior research by the author of this report and affiliated researchers<br />
found that blacks were significantly over-represented among those arrested<br />
between 1999 and 2001 in Seattle for drug possession 26 and drug delivery 27<br />
relative to those who use and deliver illegal drugs in Seattle. Key findings from<br />
these studies include the following:<br />
• In Seattle, a majority of users of serious drugs, with the possible exception<br />
of crack cocaine, are white.<br />
• The majority of needle exchangers surveyed in Seattle obtained their<br />
drugs (primarily heroin, methamphetamine and cocaine) from a white<br />
person. Much smaller percentages reported obtaining those substances<br />
from a black person.<br />
• 64.2 percent of those purposefully arrested 28 for delivery of serious drugs,<br />
including heroin, methamphetamine, powder cocaine, crack cocaine and<br />
ecstasy, in Seattle from January 1999 to April 2001 were black.<br />
David Hawkins, Kenyatta Etchison, and James Herbert Williams. The data for this study were<br />
drawn from “a prospective longitudinal survey of 808 children who consented to participate in<br />
the study, drawn from the population of 1,053 fifth-grade students attending 18 elementary<br />
schools serving high-crime and other neighborhoods of Seattle in the fall of 1985 . . . Slightly<br />
less than half identified themselves as European-American (47 percent), about one-fourth (26<br />
percent) as African American, 22 percent as Asian American, and 5 percent as Native<br />
American. Five percent of the sample was Hispanic” (Appendix A, p. A51). Although the average<br />
family income level of those included in the study was generally low, rates of poverty were<br />
significantly higher among African American participants: 75.4 percent of the African American<br />
youth were eligible for the free lunch program, compared with only 31.2 percent of the<br />
Caucasian youth. Self-report information was collected from age 11 to age 17 for eight types of<br />
offenses, one of which is drug sales. Survey response rates were very high; 94 percent of the<br />
youths were interviewed at age 17. According to the authors of the report, most referrals to the<br />
juvenile court for criminal offenses followed arrests by the police.<br />
26 Beckett, Nyrop, Pfingst and Bowen 2005.<br />
27<br />
Beckett 2004; Beckett 2004; Beckett, Nyrop and Pfingst 2006.<br />
28 In the previous study, “purposeful” arrests included those that resulted from buy-busts,<br />
reverse buy-busts, and narcotics search warrants; “serious drugs” included heroin, crack<br />
11
• The vast majority (over 74 percent) of purposeful drug delivery arrests<br />
involved crack cocaine. The Seattle Police Department (SPD) made 2,018<br />
arrests for crack cocaine delivery, but only 138 for methamphetamine,<br />
ecstasy and powder cocaine combined, from 1999 to 2001.<br />
• Because most arrests involved crack cocaine, and because 79 percent of<br />
those purposefully arrested for delivering crack cocaine were black, nearly<br />
two-thirds (64.2 percent) of those purposefully arrested for delivering one<br />
of the five serious drugs included in the analysis were black. The focus on<br />
crack cocaine is thus a leading cause of racial disparity in drug delivery<br />
arrests.<br />
• The focus on outdoor drug activity also contributed to the overrepresentation<br />
of blacks among drug arrestees. However, the majority of<br />
those arrested both outdoors and indoors were black.<br />
• The racially diverse downtown market was the site of significantly more<br />
drug delivery arrests in both absolute and relative terms than the<br />
predominantly white outdoor market in Capitol Hill. Observed drug<br />
deliveries in the downtown market outnumbered observed drug<br />
deliveries in Capitol Hill by a ratio of 4.4 to 1; but downtown delivery<br />
arrests outnumbered Capitol Hill delivery arrests by over 25 to 1.<br />
In sum, across the nation, drug arrests are an important cause of rising<br />
incarceration rates and racial disparities in the criminal justice system. Prior<br />
studies have found that racial disparities in Seattle drug arrests are<br />
comparatively large, and that little of the racial disproportionality in Seattle drug<br />
arrests is a function of racial differences in rates of offending. Instead, two<br />
organizational practices explained much of this disparity: the police focus on<br />
(some) outdoor drug markets, particularly those located in downtown<br />
neighborhoods, and on those who deliver crack cocaine (as opposed to any other<br />
serious drug). The evidence presented in prior studies also indicated that these<br />
organizational practices were not a function of race-neutral policy considerations<br />
such as public health risk or citizen complaints about drug activity.<br />
cocaine, powder cocaine, methamphetamine, and ecstasy (MDMA); and “delivery arrests”<br />
included arrests involving allegations of delivery of controlled substances or possession with<br />
intent to deliver controlled substances. These categories have been slightly modified in the<br />
present study; the differences are explained at page 12-16 of the report.<br />
12
RESEARCH DESIGN <strong>AND</strong> ORGANIZATION <strong>OF</strong> <strong>THE</strong> REPORT<br />
This study updates prior research on racial disproportionality in Seattle drug<br />
delivery arrests. The goals of this study are to (a) ascertain whether the racial<br />
composition of Seattle narcotics delivery arrestees has changed since 1999–2001,<br />
when over 64 percent of those purposefully arrested for delivering serious illegal<br />
drugs were black; (b) compare the magnitude of black over-representation in<br />
Seattle drug arrests with that found in comparable cities; (c) assess the extent to<br />
which any observed over-representation of blacks among Seattle drug arrestees<br />
is a function of differences in rates of offending; (d) identify other potential<br />
causes of this disparity; and (e) assess the extent to which any policies or<br />
practices that contribute to racial disparity in drug arrests are likely the product<br />
of race-neutral policy considerations. Both updated data sources and, where<br />
appropriate, newly available or supplemental data sources are utilized in the<br />
analysis. 29<br />
Determining whether racial differences in drug law offending explain the overrepresentation<br />
of a particular racial group (in this case, blacks) among arrestees<br />
requires comparing the racial composition of those arrested for delivery of<br />
serious drugs with the racial composition of those delivering these same<br />
substances. Because of the illicit nature of the activity in question and the<br />
difficulty of gaining access to all sites where the activity occurs, it is not possible<br />
to observe a representative sample of all serious drug transactions in Seattle. This<br />
does not mean, however, that the nature of each drug market and the<br />
demographic profile of those who deliver serious drugs in Seattle cannot be<br />
reliably assessed.<br />
When estimating the characteristics of phenomena the universe of which cannot<br />
be directly observed, social scientists draw upon multiple data sources in order<br />
to bolster confidence in their findings. Often referred to as “triangulation,”<br />
drawing upon multiple data sources and methodologies allows researchers to<br />
cross-check the findings from each data source. When the results of diverse data<br />
29<br />
In a few instances, data sources utilized in previous analyses are no longer available. These<br />
include the Arrestee Drug Abuse Monitoring survey data, which provided data about drug use<br />
among those arrested for various crimes, and Drug Abuse Warning Network Data, which<br />
record instances in which patients admitted to hospital emergency rooms report having<br />
recently used illicit drugs.<br />
13
sources and methods of analysis are consistent with each other, social scientists<br />
have more confidence in their findings and conclusions. 30<br />
This report considers a wide range of data sources in order to assess the nature of<br />
Seattle’s drug markets and to estimate the racial composition of those who<br />
deliver serious drugs in Seattle. These data sources, along with their strengths<br />
and limitations, are described in the body of the report. In addition, this study<br />
uses the two analytic strategies previously described to analyze racial disparities<br />
in Seattle drug arrests: comparing the racial composition of those arrested for<br />
drug delivery in Seattle with (a) the racial composition of those arrested for that<br />
offense in other comparable cities; and (b) the racial composition of those who<br />
deliver serious illicit drugs in Seattle. The analysis then considers a variety of<br />
possible explanations for racially disparate arrest outcomes. The results of this<br />
analysis indicate that the SPD’s focus on the crack cocaine market is the<br />
fundamental cause of racial disproportionality in drug delivery arrests. This<br />
report then turns to whether this focus is a consequence of race-neutral policy<br />
considerations. Evidence that the focus on crack cocaine is not a function of raceneutral<br />
policy considerations supports the claim that the focus on crack cocaine is<br />
not a race-neutral policy or practice.<br />
In the present study, “purposeful” arrests include those that result from buy-bust<br />
operations, narcotics search warrants, other narcotics investigations, and “seepops”<br />
(police observations that result from the purposeful deployment of law<br />
enforcement officers for the purpose of drug law enforcement). “Serious drugs”<br />
include all illicit narcotics other than marijuana. 31 Only arrests conducted by the<br />
SPD that took place within Seattle city limits were included in the analysis. 32<br />
Finally, “delivery arrests” include those involving allegations of three legally<br />
comparable offenses: narcotics delivery, possession with the intent to deliver, or<br />
manufacture of a controlled substance.<br />
Part I of the report provides an overview of the Seattle drug market, as well as<br />
the racial/ethnic composition of those who use and deliver serious drugs in<br />
Seattle. The evidence indicates that the majority of those who use and deliver<br />
30 Jick 1979; Schutt 1996. For examples of academic and governmental research on illicit drug<br />
markets that employ this approach, see Darke, Kaey and Topp 2002; Ritter 2005; Shedlin et.al.,<br />
in progress; Topp, Breen and Darke 2004; Wilkins et. al. 2005; United Nationals International<br />
Drug Program 2000; World Health Organization 2008.<br />
31<br />
However, the results of the arrest analysis do not change if prescription drugs are excluded, as<br />
the SPD made no arrests for delivery of only prescription drugs during the sample period.<br />
32<br />
Some of these SPD arrests were the result of joint operations with other agencies.<br />
14
serious drugs in Seattle are white. This appears to be true for all serious drugs<br />
with the possible exception of crack cocaine. Part II describes the results of an<br />
analysis of a four-month sample of narcotics-related incident reports, and in<br />
particular, provides descriptive information regarding Seattle’s purposeful drug<br />
delivery arrests in four months of 2005–2006. The results of this analysis indicate<br />
that the racial composition of Seattle drug delivery arrestees has changed little:<br />
more than two-thirds (67 percent) of those arrested for delivering a serious drug<br />
in 2005–2006 are black. When converted to rates, these figures indicate that the<br />
black serious drug delivery arrest rate is 21 times higher than the white serious<br />
drug delivery arrest rate. The degree to which blacks are over-represented<br />
among drug arrestees relative to the general population in Seattle is<br />
comparatively high: Seattle has the second highest black-to-white drug arrest<br />
rate ratio (for both drug arrests in general and for serious drug delivery) of all<br />
mid-sized cities that reported data to the FBI in 2006.<br />
Part III of the report considers four possible explanations of the overrepresentation<br />
of blacks among drug delivery arrestees: the racial composition of<br />
those who deliver serious drugs in Seattle, the police focus on outdoor drug<br />
activity, the police focus on the downtown area and the police focus on those<br />
who deliver crack cocaine. Although the first three of these factors contribute<br />
modestly to racial disparities in drug arrests, the evidence strongly suggests that<br />
the focus on the crack cocaine market is the fundamental cause of the extreme disparity<br />
between the black and white drug arrest rates. The question then becomes whether<br />
the focus on crack cocaine—the only serious drug that may be predominantly<br />
used and delivered by blacks in Seattle, and that is strongly linked to blacks in<br />
popular imagery—can be explained in race-neutral terms. The evidence indicates<br />
that the police focus on crack cocaine is not driven by any of the following “raceneutral”<br />
factors: the frequency with which crack cocaine is exchanged, the<br />
distribution of resident complaints about perceived drug activity, public safety<br />
considerations or public health risks. Thus, the fundamental cause of racial<br />
disparity in Seattle’s drug delivery arrests—the focus on crack cocaine—does not<br />
appear to be explicable in race-neutral terms. This finding supports the<br />
conclusion that the focus on crack cocaine is not race-neutral. The concluding<br />
section of the report summarizes the main findings and considers their<br />
implications.<br />
15
PART I: <strong>THE</strong> SEATTLE <strong>DRUG</strong> MARKET<br />
This section of the report considers a wide range of data sources in order to<br />
provide a broad overview of Seattle’s illicit drug markets. In particular, this<br />
section explores data sources that shed light on drug use by Seattle residents in<br />
order to determine which drugs are most commonly used and distributed in<br />
Seattle, as well as the racial composition of those who use and deliver serious<br />
illegal narcotics. Data sources discussed in this section pertain to Seattle residents<br />
only and include surveys conducted by federal researchers of Seattle residents<br />
aged 12 and older, surveys conducted by federal researchers of Seattle public<br />
school students, mortality data collected by the Medical Examiner’s office, a<br />
survey of persons exchanging needles at Seattle-King County syringe exchange<br />
facilities designed by the author of this report in conjunction with Public Health -<br />
Seattle & King County staff, drug treatment admission data collected by<br />
Washington State and an observational study of two of Seattle’s open air drug<br />
markets. 33 The strengths and limitations of each of these data sources are<br />
described in the following discussion.<br />
Although this report is primarily concerned with participation in, and arrests for,<br />
drug delivery, data sources pertaining to the racial composition of those who use<br />
serious illicit drugs in Seattle are also described, for two reasons. First, an<br />
extensive body of survey and ethnographic research indicates that most drug<br />
users knowingly transfer (i.e. deliver) drugs in the course of their drug-using<br />
activities. 34 These behaviors may or may not be aimed at securing compensation,<br />
and are part of drug-using cultures as described by researchers who have<br />
observed those settings. Common behaviors that constitute drug delivery<br />
include “treating” others to drugs, passing drugs between friends, making<br />
collective purchases that are then divided among purchasing parties, and so<br />
forth. In her review of the ethnographic research on drug users and drug<br />
markets, Hunt concluded that these behaviors are quite common among drug<br />
33 My previous report referenced a number of data sources that pertained to King County and<br />
adjusted to reflect dynamics in Seattle wherever possible. This report includes only data<br />
sources that pertain to Seattle residents specifically. This change reflects a) the increased<br />
availability of data sources pertaining to Seattle and b) the fact that several of the King County<br />
data sources are no longer available. In particular, data from SAMHSA’s Drug Abuse Warning<br />
Network (DAWN), which track the number of times drugs are “mentioned” by patients in<br />
hospital emergency rooms (SAMHSA 2002), are no longer collected in Seattle-King County.<br />
34<br />
Adler 1985; Hunt 1990; Murphy and Waldorf 1998; Murphy and Rosenbaum 1997; Rosenbaum,<br />
Morgan and Beck 1998; Sifaneck and Neaigus 2001; Waldorf, Reinarman and Murphy 1991;<br />
Waldorf 1998.<br />
17
users: “Persons at almost all levels of drug use distribute drugs, that is, sell or<br />
share them.” This tendency is particularly pronounced among frequent drug<br />
users, although “occasional users may distribute small amounts as part of<br />
sharing drugs or obtaining them for their own use and often do not classify their<br />
activities as dealing or selling.” 35<br />
In addition, researchers have consistently found that many frequent drug users<br />
participate in some aspect of the drug distribution system in order to support<br />
their drug habit and/or generate income. 36 Such services include working as a<br />
runner, courier, or lookout for drug dealers; selling small amounts of drugs;<br />
injecting others; and preparing drugs for sale on the street. Users who participate<br />
in the drug distribution system to support their drug habit are especially likely to<br />
participate in the lower end of the distribution system, particularly street sales.<br />
Indeed, active involvement in the lower end of the drug distribution system<br />
among addicts and frequent drug users is consistently reported in the research<br />
literature. Based on her comprehensive review of the literature, Hunt concluded<br />
that because many frequent drug users distribute or sell drugs or provide “drug<br />
services,” drug dealing is “endemic” among frequent users. 37 In Seattle, too, local<br />
health experts and police officers have observed that many drug users obtain<br />
their drugs by providing services for drug dealers or selling small amounts of<br />
drugs. 38<br />
In short, research suggests that most frequent drug users knowingly transfer—<br />
i.e. deliver—illegal drugs in the course of their drug-using activities; many also<br />
engage in or facilitate drug sales or distribution. Data pertaining to the racial<br />
composition of Seattle residents who use serious illegal drugs is thus relevant to<br />
a complete assessment of the racial composition of those who deliver those drugs<br />
in Seattle.<br />
Data sources that identify the drugs most commonly used and abused by Seattle<br />
residents, as well as the race/ethnicity of those who use and deliver them, are<br />
discussed next in Part I.A. These data sources indicate that a variety of serious<br />
drugs—including powder cocaine, ecstasy, heroin and other opiates,<br />
amphetamines (including methamphetamine) and crack cocaine—are widely<br />
35<br />
Hunt 1990: 166.<br />
36 Bourgois 1995; Dunlap, Johnson and Maher 1997; Hagedorn 1994; Maher and Daly 1996; Preble<br />
and Casey 1998; Sterk 1999.<br />
37 Hunt 1990: 174-9.<br />
38<br />
Klement and Siggins 2001: 17.<br />
18
used and distributed in the Seattle area. 39 The findings also indicate that the<br />
majority of those who use and deliver serious drugs in Seattle are white.<br />
PATTERNS <strong>OF</strong> <strong>DRUG</strong> USE AMONG SEATTLE RESIDENTS<br />
The United States Department of Health and Human Services’ Substance Abuse<br />
& Mental Health Services Administration (SAMHSA) conducts an annual survey<br />
of U.S. residents aged 12 and older to assess trends and patterns in drug use. 40<br />
The respondent population for this survey<br />
is the civilian, non-institutionalized population aged 12 years old or<br />
older . . . The survey includes persons living in noninstitutionalized<br />
group quarters (e.g., shelters, rooming/boarding<br />
houses, college dormitories, migratory workers' camps, halfway<br />
houses), and civilians living on military bases. Persons excluded<br />
from the survey include persons with no fixed household address<br />
(e.g., homeless and/or transient persons not in shelters), active-duty<br />
military personnel, and residents of institutional group quarters,<br />
such as correctional facilities, nursing homes, mental institutions,<br />
and long-term hospitals. 41<br />
Thus, SAMHSA’s Survey on Drug Use and Health seeks primarily to provide a<br />
nationally representative sample of respondents to generate reliable knowledge<br />
regarding drug use and health among the housed and non-incarcerated. Insofar<br />
39 According to 2000 ADAM survey data of King County arrestees, Seattle had one of the four most<br />
active drug markets in the country (Taylor et al. 2001); rates of heroin, methamphetamine, and<br />
crack use (respectively) were especially high relative to other urban areas. Unfortunately, these<br />
data have not been collected since 2003 and are therefore not included in the analysis of<br />
contemporary drug use patterns in Seattle.<br />
40 For more information about the survey, see http://www.oas.samhsa.gov/nhsda.htm (accessed<br />
April 7, 2008).<br />
41 See SAMHSA’s 2006 National Survey on Drug Use and Health, Appendix A. Available online at<br />
http://www.oas.samhsa.gov/NSDUH/2k6NSDUH/appA.htm (accessed April 4, 2008). As noted by<br />
SAMHSA researchers, although the surveyed population “includes almost 98 percent of the<br />
total U.S. population aged 12 or older, it excludes some important and unique subpopulations<br />
who may have very different drug use patterns. For example, the survey excludes active<br />
military personnel, who have been shown to have significantly lower rates of illicit drug use.<br />
Also, persons living in institutional group quarters, such as prisons and residential drug use<br />
treatment centers, are not included in NSDUH, yet they have been shown in other surveys to<br />
have higher rates of illicit drug use. Also excluded are homeless persons not living in a shelter<br />
on the survey date; they are another population shown to have higher than average rates of<br />
illicit drug use” (Appendix B1). The demographic implications of this sampling strategy are<br />
considered in the next section of this report.<br />
19
as the goal is to provide samples of this population that are representative of the<br />
state and national population, the number of people surveyed in any particular<br />
city, including Seattle, is not especially large. 42 In addition, although the<br />
surveyed population is representative of the target population at the state level,<br />
the Seattle respondent population may not be representative of the Seattle<br />
population. In particular, as a result of comparatively small sample sizes, the<br />
survey results for non-white Seattle residents are considered unreliable and are<br />
suppressed; only the results for white respondents and for all survey<br />
respondents were considered reliable and reported by federal researchers.<br />
Finally, like all surveys, the SAMHSA survey relies upon self-reporting of illicit<br />
behavior. 43 The results should therefore be interpreted with caution.<br />
According to survey data provided by federal researchers at SAMHSA, 44 18.5<br />
percent of Seattle residents aged 12 or older and surveyed from 2002 to 2006<br />
reported using an illegal drug other than marijuana in the past year; another 8.5<br />
percent reported using an illegal drug other than marijuana in the past month. 45<br />
Among those reporting serious drug use in the past year, ecstasy, powder<br />
cocaine 46 and crack cocaine were the most widely used (by 5.1, 3.4, and 2.5<br />
percent of Seattle residents, respectively). Among those reporting serious drug<br />
use in the past month, powder cocaine, methamphetamine and crack cocaine<br />
42 The number of respondents varied by question. On average, approximately 450 Seattle<br />
residents responded to each survey question.<br />
43 There is evidence that relying on self-reports generally leads to underestimates of drug use<br />
(and other stigmatized behaviors) (see Chen et al. 2006; Lu, Taylor and Riley 2001;<br />
Soldbergsdottir et al. 2004). These studies also indicate that respondents are most likely to lie<br />
about their use of highly stigmatized drugs, particularly heroin (ibid). On the other hand,<br />
SAMHSA researchers make sophisticated efforts to solicit honest answers from survey<br />
respondents. In particular, the survey incorporates “procedures that would be likely to increase<br />
respondents' cooperation and willingness to report honestly about their illicit drug use<br />
behavior. Confidentiality is stressed in all written and oral communications with potential<br />
respondents. Respondents' names are not collected with the data, and computer-assisted<br />
interviewing (CAI) methods, including audio computer-assisted self-interviewing (ACASI), are<br />
used to provide a private and confidential setting to complete the interview . . . The interviewer<br />
requests the selected respondent to identify a private area in the home to conduct the interview<br />
away from other household members” (see SAMHSA’s 2006 National Survey on Drug Use and<br />
Health, Appendix A1).<br />
44<br />
The results for Seattle residents only were provided to the author of this report by Dr. James<br />
Colliver, Division of Population Surveys, Office of Applied Studies, Substance Abuse and Mental<br />
Health Services Administration.<br />
45<br />
This category includes the drugs shown in Figure 1 as well as heroin, hallucinogens,<br />
stimulants, inhalants, and the non-medical use of pain relievers, tranquilizers, and sedatives.<br />
46 The SAMHSA survey question regarding cocaine specifically includes all forms of cocaine (see<br />
SAMHSA 2007, Appendix C). To estimate the percentage of respondents who used powder<br />
cocaine, the percent reporting that they used crack was subtracted from the percent reporting<br />
that they used any form of cocaine.<br />
20
were most widely reported (by 1.7 percent, 1 percent and 1 percent of Seattle<br />
residents, respectively) 47 (see Figure 1).<br />
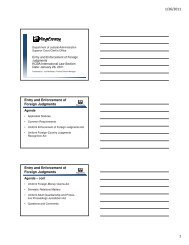
Figure 1. SAMHSA Survey Results for City of Seattle:<br />
Drug Activity in Past Year, 2002-2006<br />
20%<br />
15%<br />
10%<br />
5%<br />
0%<br />
Used a Serious Drug<br />
Used Ecstasy<br />
Used Powder Cocaine<br />
Used Crack<br />
Used Meth<br />
Sold an Illegal Drug<br />
Source: Dr. James Colliver, Division of Population Surveys, Office of Applied Studies,<br />
Substance Abuse and Mental Health Services Administration.<br />
Note: The question about cocaine did not specify which form of cocaine. However, since the<br />
survey question about crack cocaine use was asked separately, it appears to refer to powder<br />
cocaine.<br />
SAMHSA’s Survey on Drug Use and Health of residents aged 12 and older also<br />
provides some information about the race/ethnicity of those who use and deliver<br />
illegal drugs. As noted previously, the numbers of people surveyed in any<br />
particular city, including Seattle, are not especially large. Nonetheless, these<br />
survey data suggest that the prevalence of serious drug use among white Seattle<br />
residents is nearly identical to the prevalence of serious drug use among all<br />
Seattle residents. For example, 18.5 percent of all Seattle residents, and 18.6<br />
47 Washington State also conducts a survey on substance abuse that includes only adults living in<br />
households. (These survey data were described in my previous report). According to the most<br />
recent (2003) Washington State household survey data, 4.5 percent of adults living King County<br />
households reported using an illegal drug other than marijuana in the past year; 2 percent<br />
reported using a serious illicit substance in the past month (see<br />
http://www.dshs.wa.gov/pdf/ms/rda/research/4/52/king.pdf) (accessed April 4, 2008).<br />
Unfortunately, these data are only available at the county level, and only include adults living in<br />
households. Substance Abuse, Substance Use Disorders and the Need for Treatment in<br />
Washington State: Preliminary Findings from the Washington State Needs Assessment<br />
Household Survey (Olympia, WA: Washington State Department of Social and Health Services,<br />
Research and Data Analysis Division, May 2004, p. 58). Presumably, the higher levels of drug<br />
use reported by SAMHSA for Seattle residents reflect the inclusion of adolescents and those<br />
living in group quarters such as college dormitories in the SAMHSA survey. This difference may<br />
also reflect higher rates of drug use in Seattle relative to King County as a whole.<br />
21
percent of white Seattle residents, reported using a serious illegal drug in the<br />
past year. Similarly, 8.5 percent of all Seattle residents, and 7.9 percent of all<br />
white Seattle residents, reported using a serious illicit drug in the previous<br />
month. Although the prevalence of serious drug use varied by drug, overall, the<br />
prevalence of serious drug use (use of any illicit drug other than marijuana)<br />
among white Seattle residents was similar to the prevalence of serious drug use<br />
among all Seattle residents (see Table 2). The prevalence of cocaine use (which<br />
includes all forms of cocaine) was slightly lower among whites than among all<br />
Seattle residents. Conversely, the prevalence of ecstasy use was higher for whites<br />
than for Seattle residents as a whole. 48<br />
Table 2. SAMHSA Survey on Drug Use and Health, Recent Drug Use among<br />
Seattle Residents Aged 12 and Older, 2002-2006<br />
White<br />
Residents<br />
Serious Drug<br />
Use in Past<br />
Year<br />
Serious Drug<br />
Use in Past<br />
Month<br />
Cocaine Use in<br />
Past Year<br />
Ecstasy Use in<br />
Past Year<br />
18.6% 7.9% 4.4% 6.5%<br />
All Residents 18.5% 8.5% 5.9% 5.1%<br />
Source: SAMHSA Survey on Drug Use and Health, provided by Dr. James Colliver, Division of<br />
Population Surveys, Office of Applied Studies, Substance Abuse and Mental Health Services<br />
Administration.<br />
Note: Results for all drug categories for which 20 or more of those surveyed responded<br />
affirmatively are shown here.<br />
SAMHSA’S COMMUNITIES THAT CARE YOUTH SURVEY<br />
SAMHSA also conducts a survey of public school students throughout the<br />
country. This survey is part of SAMHSA’s “Communities that Care” program,<br />
and is aimed at providing more detailed information about drug use among<br />
youth. 49 A few limitations should be kept in mind regarding these data. First, the<br />
survey does not include private school students, and, as a result, likely underrepresents<br />
students from higher-income families. Second, the response rates for<br />
48 Locally, other researchers have also found that the use of “club drugs,” especially ecstasy<br />
(MDMA), is concentrated among whites (Banta-Green et al. 2005).<br />
49 For more information about SAMHSA’s Communities that Care program, see<br />
http://ncadi.samhsa.gov/features/ctc/resources.aspx (accessed April 7, 2008).<br />
22
most categories were just over 60 percent. 50 Finally, the survey does not include<br />
those who were absent or who had dropped out of school.<br />
The survey results of the Communities that Care Youth Survey for the Seattle Public<br />
Schools 51 suggest that the use of serious drugs among Seattle Public School<br />
students is not uncommon. In particular, 7 percent of the students surveyed<br />
reported using (an unspecified form of) cocaine, ecstasy, or hallucinogens in the<br />
previous 30 days, while another 5 percent reported using stimulants. Overall,<br />
more than one-fourth (26.2 percent) of the public school students surveyed<br />
reported recently using at least one of these serious illicit drugs in the previous<br />
thirty days (see Figure 2).<br />
Figure 2. Drug Use in Past 30 Days among Seattle Public<br />
School Students, 2004<br />
30%<br />
20%<br />
10%<br />
0%<br />
Hallucinogens<br />
Cocaine<br />
Ecstasy<br />
Stimulants<br />
Any of the Above<br />
Source: Dr. Michael W. Arthur, Research Associate Professor, Social Development Research<br />
Group, University of Washington.<br />
In short, surveys of Seattle residents aged 12 and older suggest that cocaine and<br />
ecstasy are the most commonly used serious drugs. The results of the survey of<br />
Seattle Public School students indicate that these substances, along with<br />
hallucinogens and stimulants, are also fairly popular among youth. Significant<br />
percentages of Seattle residents reported recent use of a serious illicit drug.<br />
SAMHSA’s Communities that Care Youth Survey of public school students also<br />
provides information about the prevalence of serious drug use among particular<br />
50 The number of students surveyed varies by grade and by question, but ranges from 1,400 -<br />
2,100.<br />
51 These data were provided by Dr. Michael W. Arthur, Research Associate Professor, Social<br />
Development Research Group, University of Washington and are on file with the author.<br />
23
acial/ethnic groups. These data indicate that rates of serious drug use are<br />
roughly similar across public school students of diverse racial and ethnic<br />
backgrounds. Overall, Asian public school students report the lowest rates of<br />
serious drug use, while Hispanic students report the highest rates. Thirty percent<br />
of all black students, compared with 26 percent of all white students, reported<br />
using a serious illegal drug in the past 30 days (see Figure 3).<br />
35%<br />
Figure 3. Prevalence of Past Month Drug Use among Seattle<br />
Public School Students<br />
30%<br />
25%<br />
20%<br />
15%<br />
10%<br />
5%<br />
Asian<br />
Black<br />
Hispanic<br />
White<br />
All Students<br />
0%<br />
Cocaine Hallucinogens Ecstasy Stimulants Any of These<br />
Source: SAMHSA, Communities that Care Youth Survey. Data provided by Dr. Michael W.<br />
Arthur, Research Associate Professor, Social Development Research Group, University of<br />
Washington.<br />
Each of these two surveys suggests that the prevalence of serious drug use<br />
among white Seattle residents is similar to the prevalence of serious drug use<br />
among Seattle residents as a whole. The SAMHSA Survey on Drug Use and Health<br />
found slightly higher levels of past year drug use among whites (18.6 percent)<br />
than among Seattle residents as a whole (18.5 percent). The percentage of whites<br />
who recently (i.e. in past month) used a serious drug (7.9 percent) was similar to<br />
the percentage of all Seattle residents (8.5 percent) who had done so.<br />
Applying the past-year prevalence rates to the Seattle population aged 12 and<br />
older suggests that 69.1 percent of the Seattle residents aged 12 and older who<br />
used a serious illicit drug in the past year were white. This figure is nearly<br />
identical to the share of the Seattle population aged 12 and older that is white<br />
(68.7 percent). Extrapolating past-month prevalence estimates to the Seattle<br />
population suggests that 63.9 percent of the Seattle residents aged 12 and older<br />
24
who used a serious illicit drug in the past month were white. 52 In either case,<br />
these data indicate that a clear majority of those who recently used a serious<br />
illegal drug from 2002 to 2006 were white.<br />
Although useful, most general surveys such as those described above miss<br />
institutionalized, transient and homeless populations. As a result, such surveys<br />
may underestimate the prevalence of some categories of drug use. 53 In particular,<br />
the percentage of Seattle residents reporting heroin use in the previous year in<br />
the SAMHSA survey was very low (.1 percent). Yet, according to public health<br />
officials, 15,000–18,000 King County residents are injection drug users (IDUs),<br />
most of whom use heroin. 54 In the Seattle-King County area, concern among<br />
public health officials has therefore centered on injection drug use, which is<br />
believed to be unusually prevalent and poses particular health risks. 55 The<br />
Seattle-King County Needle Exchange Survey is an important source of<br />
information about IDUs living in King County.<br />
2007–2008 SEATTLE-K<strong>IN</strong>G COUNTY NEEDLE EXCHANGE SURVEY<br />
The 2007-2008 Seattle-King County Needle Exchange Survey was conducted on<br />
behalf of Public Health - Seattle & King County and The Defender Association. 56<br />
The survey was administered at all seven needle exchange sites in Seattle-King<br />
County during all hours of operation for a two-week period of time (September<br />
11–24th, 2006). Only clients who exchanged needles were surveyed. The twoweek<br />
sampling period was selected because according to public health experts,<br />
the majority of needle exchangers utilize the needle exchange services within that<br />
time frame.<br />
52<br />
These calculations were based on 2000 U.S. Census Bureau population counts provided in<br />
Tables QT-P6, P12, and P121; half of those in the 10–14 age range were combined with younger<br />
residents and subtracted from general population figures to calculate the proportion of the<br />
resident population and white resident population aged 12 and older.<br />
53 For example, a survey of homeless Seattle youth (whose drug use patterns may or may not be<br />
similar to those found among homeless adults) found that 46 percent had used LSD, 33.5<br />
percent had used amphetamines, 18.1 percent had used (an unspecified form of) cocaine, and<br />
10.3 percent had used heroin in the past three months (Wagner et al. 2001).<br />
54 Banta-Green et al. 2006: 10; Deibert et al. 2006: 1347; Public Health- Seattle & King County<br />
2005.<br />
55<br />
Injection drug use poses serious and particular health risks. For example, roughly one-third of<br />
all new HIV cases and 60 percent of hepatitis C infections stem from injection drug use (Deibert<br />
et al. 2006: 1347; Lee and Sharpe 2003).<br />
56 The 2007-2008 Seattle-King County Needle Exchange Survey was designed by Michael<br />
Hanrahan, Kris Nyrop and K. Beckett.<br />
25
When approaching clients, surveyors first asked whether the client had already<br />
completed the survey. Clients who had not already completed the survey were<br />
given the full survey that includes questions about recent drug transactions.<br />
Those who had already completed the survey were asked to complete a much<br />
shorter survey that did not include questions about drug transactions; these data<br />
were primarily intended to address questions pertaining to public health<br />
concerns. Thus, questions regarding drug transactions were asked only of needle<br />
exchangers who had not already completed the survey; any particular needle<br />
exchange client did not provide information about recent drug transactions more<br />
than once.<br />
All needle exchangers were asked about their race/ethnicity, age and gender.<br />
Those completing the survey for the first time were also asked about the drug(s)<br />
present in the needle(s) just exchanged, whether or not they obtained (each of)<br />
those drugs in Seattle and the race/ethnicity of the person from whom they had<br />
obtained those drugs. Respondents completing the full version of the survey<br />
were also asked about “other drugs” (i.e. drugs other than those found in the<br />
needles they exchanged) they had recently obtained, the location of those<br />
transactions and the race/ethnicity of the person from whom they obtained those<br />
drugs. 57 A second “wave” of the survey, administered at the downtown, Capitol<br />
Hill and University District syringe exchange facilities in 2008, was designed to<br />
provide more detailed information regarding the geographic location of recent<br />
drug transactions. The results of the “second wave” of the survey are described<br />
in Part III of this report. All needle exchange survey results described in the<br />
report were obtained from the “first wave” of the survey conducted in 2007<br />
unless otherwise indicated.<br />
The results of the survey indicate that many of the estimated 15,000–18,000 King<br />
County IDUs are homeless or unstably housed, and therefore unlikely to be<br />
included in general population surveys. 58 According to the results of the 2007–<br />
2008 Seattle-King County Needle Exchange Survey, only 37.6 percent of those<br />
exchanging needles at one of the seven King County syringe exchange facilities<br />
57<br />
This is important, as there is reason to believe that people exchanging needles downtown are<br />
more likely to exchange small numbers of needles more frequently; those exchanging needles<br />
at other facilities are more likely to exchange larger numbers of syringes less frequently.<br />
Moreover, people of color are most likely to exchange needles downtown (Kris Nyrop, former<br />
director of Street Outreach Services, personal communication, 2008). A more complete<br />
discussion of the possible racial/ethnic biases in the survey is provided in the subsequent<br />
section.<br />
58 Other drug users may also be under-represented in general surveys. However, there does not<br />
appear to have been any research that assesses this possibility in Seattle.<br />
26
were permanently housed; the majority were either homeless (40.5 percent) or<br />
unstably housed (21.9 percent) at the time of the survey.<br />
The survey results also suggest that the vast majority of the estimated 15,000–<br />
18,000 King County injection drug users obtain and use drugs in Seattle.<br />
According to the survey results, 83.7 percent of the needle exchangers surveyed<br />
at one of the seven King County needle exchange facilities lived in Seattle at the<br />
time of the interview. An even higher percentage—88.7 percent—of the recent<br />
drug transactions described by these needle exchangers were reported to have<br />
taken place inside Seattle. Similarly, over 90 percent of the more than two million<br />
needles exchanged in King County in 2007 were exchanged at one of the five<br />
needle exchange facilities in Seattle. 59 Thus, it appears that nearly 90 percent of<br />
the estimated 15,000 King County IDUs live, obtain their drugs, and exchange<br />
their needles in Seattle. 60<br />
A number of studies have found that Seattle-area injection drug users primarily<br />
inject heroin, amphetamines (including methamphetamine) and powder cocaine.<br />
For example, one recent study found that 61.8 percent of the 1,228 IDUs surveyed<br />
injected typically heroin; another 16.3 percent reported primarily injecting<br />
“speedballs” (a combination of heroin and cocaine). 61 The findings of the 2007–<br />
2008 Seattle-King County Needle Exchange Survey similarly indicate that heroin and<br />
powder cocaine are most commonly used by Seattle area injection drug users<br />
who exchange needles. Specifically, this study found that the syringes of 62.2<br />
percent of the needle exchangers surveyed contained heroin; 20.6 percent<br />
contained powder cocaine; and 10.3 percent contained methamphetamine<br />
(though many of those surveyed reported using other drugs as well).<br />
In summary, general surveys regarding drug use provide reasonably reliable<br />
information about the stably housed, but tend to miss particular segments of the<br />
population such as the homeless, transient and institutionalized. Among the<br />
stably housed, it appears that the most commonly used illicit drugs are powder<br />
cocaine and ecstasy; hallucinogens and stimulants are also fairly popular among<br />
59<br />
Data were provided by Kris Nyrop, consultant to Harm Reduction Advocates and former<br />
Director of Street Outreach Services.<br />
60 This inference is based on the assumption that IDUs who exchange needles are equally likely to<br />
live and obtain drugs in Seattle as IDUs who do not exchange needles. It is possible that this is<br />
not the case. However, the treatment admission data discussed below provide additional<br />
evidence regarding the relative prevalence of heroin use among Seattle residents, and provide<br />
additional evidence that heroin users are dramatically represented in the SAHHSA survey<br />
results.<br />
61<br />
Perdue et al. 2003.<br />
27
youth. However, these surveys likely underestimate particular categories of drug<br />
use, particularly the use of more stigmatized drugs and the drugs used by the<br />
unstably housed and homeless. Indeed, despite quite low levels of heroin use<br />
reported in SAMHSA’s Survey on Drug Use and Health, King County health<br />
officials estimate that 15,000 King County residents are active injection drug<br />
users. The evidence suggests that most of King County IDUs who exchange<br />
needles live, obtain drugs, and exchange their needles inside Seattle, and<br />
primarily use heroin, powder cocaine and amphetamines.<br />
The Seattle-King County Needle Exchange Survey also provides information about<br />
the race/ethnicity of those who utilize needle exchange services in Seattle and<br />
King County. Needle exchangers may or may not be representative of all<br />
injection drug users. On one hand, several studies (not conducted in Seattle)<br />
indicate that white IDUs are more likely to exchange syringes than black and<br />
Latino IDUs, in part as a result of heightened fear of detection among users of<br />
color. 62 On the other hand, non-prescription pharmacy sale of needles is legal in<br />
Washington State, and it is quite likely that Seattle IDUs who have the financial<br />
means to purchase their needles do so in order to avoid exchanging needles at<br />
public—and visible—needle exchange facilities. Moreover, according to local<br />
public health experts, injection drug users who utilize syringe exchange services<br />
tend to be poorer, have higher rates of unemployment, and are more likely to be<br />
long-term injectors than those who purchase their needles at pharmacies. 63 To the<br />
extent that this is the case, the needle exchange survey under-counts middle and<br />
upper income IDUs (who can afford to purchase needles). Thus, there are factors<br />
that may contribute to both under and over-representation of white injection<br />
drug users among Seattle needle exchangers.<br />
Overall, the needle exchange survey response rate was relatively high: 68 percent<br />
of those who visited a needle exchange facility in King County completed a<br />
survey. There are two reasons why a needle exchange client may not have been<br />
surveyed. First, some clients declined to complete the survey; people in this<br />
category will be referred to as “decliners.” Alternatively, there were some<br />
occasions in which the two to three surveyors present at a particular facility were<br />
already administering a survey when additional clients entered the premises. In<br />
these cases, those who were not surveyed are identified as “missed.” However,<br />
62 Friedman et al. 1999; Rich et al. 1999; Davis et al. 2005.<br />
63<br />
Personal communication, Michael Hanrahan, Public Health - Seattle & King County, May 9,<br />
2008. According to Mr. Hanrahan, about half of King Counties 15,000–18,000 IDUs utilize the<br />
syringe exchange programs.<br />
28
surveyors did record the perceived race/ethnicity of both “decliners” and the<br />
“missed,” which allows us to compare the three groups.<br />
This comparison indicates that the racial composition of those who completed<br />
the survey and those who did not was similar. The majority—67 percent—of the<br />
exchangers who completed the full survey were white, 13 percent were black, 9<br />
percent were American Indian/Alaska Native and 5 percent were Latino. 64 Of the<br />
non-respondents, 69 percent were identified as white, 21 percent as black, 6<br />
percent as American Indian/Alaska Native and less than one percent as Latino.<br />
White and black exchangers were thus slightly under-represented among those<br />
completing a survey; Latinos and American Indian/Alaska Natives were<br />
somewhat over-represented among those completing a survey. Although the<br />
response rate for blacks is the lowest of all racial/ethnic groups, only 7 percent of<br />
the decliners (but 20 percent of the exchangers missed by surveyors) were black.<br />
Thus, the comparatively high non-response rate among black needle exchangers<br />
was not primarily a result of a higher rate of “declining” among blacks, but<br />
rather the (lack of) availability of surveyors to administer the survey at the times<br />
when black needle exchangers happened to be present. 65<br />
If non-respondents and respondents are combined, 67 percent of those<br />
exchanging needles were white, 16 percent were black, 8 percent were American<br />
Indian/Alaska Native and 4 percent were Latino (see Figure 4). 66<br />
64 These results are very similar to those obtained in a similar 2003 survey, although the 2007<br />
survey results indicate a sharp increase in injection drug use among American Indians/Alaska<br />
Natives (see Beckett 2004; Beckett et al. 2005).<br />
65 In all likelihood, the fact that a higher percentage of black needle exchangers were “missed” by<br />
surveyors is a result of the fact that black needle exchangers are most likely to exchange<br />
needles downtown, and the downtown facility is both small and relatively busy because clients<br />
tend to exchange smaller numbers of syringes downtown than at the other facilities (Kris<br />
Nyrop, personal communication). Some of those who were apparently missed may have<br />
previously taken the survey.<br />
66<br />
There is also the possibility that some of the needles exchanged were exchanged for someone<br />
else. The results of this survey indicate that 21.3 percent of those who completed a survey were<br />
exchanging needles for others (typically, in addition to their own). However, the racial<br />
composition of the persons for whom needles were exchanged by others was very similar to the<br />
racial composition of those surveyed: 67.9 percent were white, and 14.3 percent were black.<br />
29
80%<br />
70%<br />
60%<br />
50%<br />
40%<br />
30%<br />
20%<br />
10%<br />
0%<br />
Figure 4. Racial and Ethnic Composition of Seattle-King<br />
County Needle Exchangers by Survey Status<br />
White Black A<strong>IN</strong>A Latino<br />
Surveyed<br />
Declined<br />
Missed<br />
All Exchangers<br />
Source: 2007–2008 Seattle-King County Needle Exchange Survey.<br />
Survey respondents described 981 instances in which they recently obtained a<br />
serious drug in Seattle. Just under half of these drug transactions—48 percent—<br />
involved heroin, another 22.4 percent involved powder cocaine, 10.8 percent<br />
involved methamphetamine, 9.9 percent involved crack cocaine and 8.4 percent<br />
involved prescription drugs. 67 The results of this survey indicate that the vast<br />
majority of needle exchangers inject heroin, powder cocaine and<br />
methamphetamine; the most reliable information that can be drawn from the<br />
survey thus pertains to the markets for these three drugs. However, as needle<br />
exchangers were also asked about “other drugs” recently obtained (i.e. drugs not<br />
in the needles they were exchanging), the survey provides some information<br />
about the markets for prescription drugs and crack cocaine.<br />
A clear majority of those who reported recently obtaining each of these drugs in<br />
Seattle were white. Specifically, 67.9 percent of those who recently acquired<br />
powder cocaine, 62.9 percent of those who recently acquired crack cocaine, 68.8<br />
percent of those who recently acquired heroin, 75.5 percent of those who recently<br />
acquired methamphetamine and 67.7 percent of those who recently obtained<br />
prescription drugs were white (see Table 3).<br />
67<br />
If we limit our attention to the more limited definition of “serious drugs” that excludes<br />
prescription drugs, survey respondents described 898 instances in which they obtained a<br />
serious drug in Seattle. More than half of these transactions—52.4 percent—involved heroin,<br />
another 24.5 percent involved powder cocaine, 11.8 percent involved methamphetamine and<br />
10.8 percent involved crack cocaine.<br />
30
Table 3. The Racial and Ethnic Composition of Needle Exchangers who<br />
Recently Obtained Serious Drugs in Seattle<br />
Heroin<br />
(n=470)<br />
Powder Cocaine<br />
(n=221)<br />
Meth/Stimulants<br />
(n=106)<br />
Crack Cocaine<br />
(n=97)<br />
Prescription Drugs<br />
(n=83)<br />
Any Serious Drug<br />
(n=981)<br />
White<br />
Black/<br />
African<br />
American<br />
American<br />
Indian/<br />
Alaska<br />
Native<br />
Hispanic/<br />
Latino<br />
Asian<br />
66.8% 14.2% 7.2% 5.1% .2%<br />
69.7% 11.3% 8.6% 3.6% 0<br />
75.5% 2.8% 6.6% 5.7% 0<br />
62.9% 11.3% 9.3% 3.1% 1%<br />
72.5% 10% 11.3% 2.5% 0<br />
67.7% 11% 7.9% 4.4% .2%<br />
Source: 2007–2008 Seattle-King County Needle Exchange Survey.<br />
Note: Drug categories that include 20 or more reported Seattle transactions are reported.<br />
Race/ethnicity of the drug buyer/recipient was unidentified in 11 cases; these are not<br />
included above.<br />
These data thus indicate that the majority of needle exchangers who obtain<br />
serious illegal drugs in Seattle are white. TARGET treatment admission data,<br />
discussed below, provide additional evidence that heroin users are particularly<br />
under-represented in the SAMHSA survey results, and that the majority of those<br />
who abuse serious drugs in Seattle are white.<br />
TARGET TREATMENT ADMISSION DATA<br />
TARGET (Treatment Assessment Report Generation Tool) is a reporting<br />
management information system used by the Washington State Department of<br />
Social and Health Services, Division of Alcohol and Substance Abuse. This<br />
reporting system collects information regarding those who are admitted to<br />
public drug and alcohol treatment facilities in Washington State. All treatment<br />
agencies providing public sector-contracted/publicly-funded treatment services<br />
must report data for those clients whose treatment is partially or fully publicly<br />
funded. 68 The data shown below include Seattle residents admitted to any fully<br />
68 These include publicly funded outpatient, intensive inpatient, recovery house, long-term<br />
residential and opiate substitution treatment admissions. TARGET data were provided by Caleb<br />
31
or partially publicly-funded treatment program from July 2005 to June 2007.<br />
Individuals are identified by their primary drug of abuse. Insofar as these data<br />
omit many persons who enter private drug treatment centers, they are best<br />
understood as a measure of drug abuse among lower income persons.<br />
According to these data, just over one-third (37 percent) of Seattle residents<br />
admitted to a publicly funded treatment program for abuse of an illegal drug<br />
other than marijuana primarily abused (some form of) cocaine; a similar<br />
percentage (36 percent) primarily abused heroin. Just over 16 percent primarily<br />
abused methamphetamine. The remainder primarily abused another<br />
(unidentified) serious drug (see Figure 5). Because the category “cocaine”<br />
includes all forms and modes of administration, it is not possible to ascertain<br />
how many of those admitted for cocaine abuse in 2005–2007 smoked cocaine<br />
(crack cocaine), snorted it in its powder form, or injected it.<br />
Figure 5. Drug Treatment Admissions among Seattle<br />
Residents by Primary Drug of Abuse, 2005-2007<br />
40%<br />
30%<br />
20%<br />
10%<br />
Cocaine (all forms)<br />
Heroin<br />
Methamphetamine<br />
Other Serious Drug<br />
0%<br />
Source: TARGET data collected by Washington State, Division of Alcohol and Substance<br />
Abuse, and provided by Caleb Banta-Green, Research Scientist, Alcohol and Drug Abuse<br />
Institute, University of Washington.<br />
Notes: These data are county level data; Seattle residents are identified based on zip code.<br />
However, four zip codes span the city border, and thus include areas both within and outside<br />
the city limits. The results shown here reflect only Seattle residents who live in zip code<br />
areas that fall solely within city borders. If residents of zip code areas that fall partly within<br />
Seattle are included, the results change very slightly: 37.4 percent of the treatment<br />
admittees primarily abused cocaine, 36.1 percent primarily abused heroin, 16.2 percent<br />
primarily abused methamphetamine and 10.3 percent primarily abused another serious drug.<br />
Banta-Green, Research Scientist at the Alcohol and Drug Abuse Institute, University of<br />
Washington.<br />
32
TARGET data also provide information about the race/ethnicity of a subset of<br />
serious drug users: those admitted to publicly funded drug treatment programs.<br />
These data include all Seattle residents admitted to fully or partially publiclyfunded<br />
drug treatment programs in 2006. Insofar as these data omit persons<br />
admitted to private drug treatment programs, they under-represent higher<br />
income persons and, as a result, likely over-represent blacks, Asians, Latinos and<br />
Native Americans among those entering drug treatment programs. 69<br />
Moreover, a substantial share of those entering public drug treatment programs<br />
are referred by criminal justice agencies, a pattern that inflates the representation<br />
of blacks among those entering publicly funded drug treatment programs.<br />
Persons admitted to public treatment programs may be referred to treatment<br />
programs by a variety of agencies, including the courts, probation office, and<br />
Department of Corrections. Referrals stemming from any of these three agencies<br />
are grouped together as “criminal justice referrals.” Overall, whites comprise a<br />
smaller share of those referred to treatment programs by criminal justice<br />
agencies than by other agencies. By contrast, blacks comprise a larger share of<br />
those entering public treatment programs via criminal justice institutions than<br />
those entering treatment programs via an alternative path. This pattern suggests<br />
that racial disproportionality in drug arrests, and the resulting disproportionality<br />
in contact with other criminal justice institutions, is inflating the representation<br />
of blacks in the TARGET data. 70<br />
Despite these biases, these data suggest that the majority of Seattle’s heroin,<br />
methamphetamine and other serious drug users are white (see Table 4).<br />
69<br />
According to 2000 U.S. census data, 8.5 percent of white Seattle residents, but 16.2 percent of<br />
Asian residents, 21.6 percent of Hispanic/Latino residents, 23 percent of black/African<br />
American residents and 29.1 percent of American Indian/Alaska Native residents, live in<br />
poverty (Cornelius n.d.).<br />
70 In Washington State there is evidence that the differential impact of drug law enforcement on<br />
black and Latino communities is not a consequence of differential treatment after arrest<br />
(Minority and Justice Commission Report 1999). This report examined the role of race and<br />
ethnicity in the processing and sentencing of felony drug offenders in King, Yakima, and Pierce<br />
counties. The authors found “no evidence that race and ethnicity are important factors affecting<br />
charging decisions for drug offenders (p. 2), but also suggested “further study should be done<br />
of law enforcement practices” (p. 70). This conclusion was primarily based on the finding that<br />
arrest rates roughly correspond to conviction rates among various racial/ethnic groups. The<br />
implication of this study, which involved interviews with law enforcement and justice system<br />
professionals in the three counties, is that the disparity in drug-related incarceration stems<br />
from arrest patterns and/or racial differences in offending behavior, rather than post-arrest<br />
practices.<br />
33
Primary<br />
Drug<br />
of Abuse<br />
Cocaine (all<br />
types)<br />
(n=2,184)<br />
Heroin<br />
(n=1,949)<br />
Meth<br />
(n=929)<br />
Other<br />
Serious<br />
Drugs<br />
(n=535)<br />
All Serious<br />
Drugs<br />
(n=5,597)<br />
Table 4. Race and Ethnicity of Seattle Residents Admitted to<br />
Public Drug Treatment Programs by Primary Drug<br />
of Abuse and Referral Source, 2006<br />
Referral<br />
Source<br />
White<br />
Black/<br />
African<br />
American<br />
American<br />
Indian/<br />
Alaska<br />
Native<br />
Hispanic/<br />
Latino<br />
Asian/<br />
Pacific<br />
Islander<br />
Criminal<br />
Justice<br />
27% 58.9% 1.2% 3.9% 2.9%<br />
Other 32.8% 53.4% 3% 3.5% 1.5%<br />
All<br />
Referrals<br />
30.6% 55.4% 2.4% 2.6% 2%<br />
Criminal<br />
Justice<br />
58% 23.1% 5.1% 7.9% .6%<br />
Other 62.9% 19.7% 3.8% 7.4% .9%<br />
All<br />
Referrals<br />
62% 20.3% 4% 7.5% .8%<br />
Criminal<br />
Justice<br />
81.3% 3.1% 2.2% 2.9% 4%<br />
Other 73.3% 7.9% 2.7% 7.4% 3.3%<br />
All<br />
Referrals<br />
77.2% 5.6% 2.5% 5.3% 3.7%<br />
Criminal<br />
Justice<br />
56% 24.8% 4.6% 8.3% 2.8%<br />
Other<br />
Referrals<br />
70.2% 12.4% 2.6% 3.8% 4.2%<br />
All<br />
Referrals<br />
67.3% 15% 3% 4.7% 3.9%<br />
Criminal<br />
Justice<br />
49.4% 34.8% 2.5% 4.7% 2.7%<br />
Other<br />
Referrals<br />
54.8% 29.4% 3.2% 5.6% 1.8%<br />
All<br />
Referrals<br />
52.8% 31.1% 3% 5.3% 2.1%<br />
Source: Caleb Banta-Green, Research Scientist, Alcohol and Drug Abuse Institute, University<br />
of Washington.<br />
Notes: These figures include Seattle residents living in one of the 37 zip code areas that fall<br />
entirely within Seattle city boundaries. Persons living in one of the four zip codes that fall<br />
partly within Seattle are not included. If persons living in one of the four zip codes that spans<br />
the city boundary are included, the results change very slightly (see Table 1A in Appendix A).<br />
Although these data do indicate that a majority of Seattle residents admitted to<br />
publicly-funded drug treatment programs are white, they also suggest that the<br />
34
majority of Seattle’s cocaine users are black. Although the higher levels of black<br />
involvement with cocaine reported in the treatment data partially results from<br />
referrals from the criminal justice system, 49.3 percent of the Seattle residents<br />
who primarily abused cocaine and were not referred to treatment programs by<br />
criminal justice agencies in 2006 were black. Because powder cocaine and crack<br />
cocaine are combined in these data, it is not possible to determine if this pattern<br />
is primarily due to high rates of crack cocaine use (as opposed to powder<br />
cocaine) among blacks.<br />
There is reason to suspect that this is the case, however. TARGET admission data<br />
for the year 2000 indicate that a majority (65.3 percent) of those who were<br />
admitted to publicly funded drug treatment programs and primarily or<br />
secondarily abused injected cocaine were white. Whites were also a plurality of<br />
those who abused snorted cocaine (48.5 percent versus 24.1 percent for blacks).<br />
However, the majority (51.2 percent) of those who abused smoked cocaine were<br />
black; just over a third (35.7 percent) of those who abused smoked cocaine were<br />
white. Thus it appears that in Seattle, a slight majority of the low-income persons<br />
who abuse smoked cocaine (crack cocaine) are black, while a majority/plurality<br />
of those who inject or snort cocaine are white. 71 In short, TARGET data suggest<br />
that although a majority of Seattle residents who abuse serious drugs are white,<br />
rates of crack cocaine use are comparatively high among blacks.<br />
MORTALITY DATA<br />
Mortality data also capture information about a particular subset of drug users:<br />
those who die of drug-related causes. The data shown below include only drugrelated<br />
deaths involving persons living in one of the 37 zip codes that fall<br />
exclusively within Seattle. 72 The data cover the period from July 2005 through<br />
June 2007. Because multiple drugs are detected in some cases, the number of<br />
drugs detected (341) exceeds the number of Seattle residents (244) who died as a<br />
result of drug-related causes. Figure 6 shows the racial composition of Seattle<br />
residents whose deaths in July 2005–June 2007 were attributed to drugs. The<br />
majority (82.2 percent) of the Seattle residents who died of drug–related causes<br />
that had any type of opiate, cocaine, sedatives and/or methamphetamine in their<br />
71<br />
Data provided by Fritz Wrede, Division of Alcohol and Drug Abuse of Washington’s Department<br />
of Social and Health Services.<br />
72 These data were provided by Caleb Banta-Green, Research Scientist, Alcohol and Drug Abuse<br />
Institute, University of Washington. There are another four zip codes that exceed the city<br />
boundary. Because residents of these four areas could not be clearly established as Seattle<br />
residents, they were excluded from the data provided.<br />
35
system at the time of their death were white (see Figure 6). 73 Although this was<br />
true for all drugs, these data provide further evidence of relatively high rates of<br />
cocaine use among blacks.<br />
100%<br />
Figure 6. Drug Related Deaths among<br />
Seattle Residents by Race, 2005-2007<br />
80%<br />
60%<br />
40%<br />
20%<br />
0%<br />
Black Native American White<br />
Prescription Opiates<br />
Heroin<br />
Tranquilizers<br />
Meth<br />
Cocaine<br />
All Deaths<br />
Sources: King County Medical Examiners Office; Caleb Banta-Green, Research Scientist,<br />
Alcohol and Drug Abuse Institute, University of Washington.<br />
Note: Hispanics are not treated as a separate category in these data, and are identified by<br />
race only.<br />
ETHNOGRAPHIC OBSERVATIONS<br />
A recent observational study of two outdoor drug venues provides a final source<br />
of information regarding the racial and ethnic composition of drug users in<br />
Seattle. The primary purpose of these observations was to establish the<br />
demographic composition of participants in two outdoor drug markets. Two<br />
areas were observed: the downtown area surrounding Third and Pike and the<br />
Capitol Hill area surrounding Broadway Avenue and Denny Way. 74 These areas<br />
73 Although white Hispanics are included in the “white” category in these data, the needle<br />
exchange survey data and treatment admission data suggest that rates of drug use among<br />
Hispanics living in Seattle are commensurate with their representation in the general<br />
population. Thus we can estimate that roughly 5 percent of those classified as white in the<br />
mortality data are white Hispanics.<br />
74 The downtown area was bounded to the north and south by Union and Stewart Street, and to<br />
the west and east by First and Fifth Avenues. This area corresponds to census tract 81.<br />
Similarly, the Capitol Hill area was bounded to the north and south by East Thomas and East<br />
Howell Street, and to the west and east by Harvard Avenue and 11th Avenue East. Observers<br />
remained within pre-defined boundaries at all times. At the start of each observational shift,<br />
ethnographers positioned themselves in a manner that allowed them to remain inconspicuous<br />
and limit their potential disturbance of drug transaction activity. If drug transaction activity was<br />
disrupted, observers moved to a different location within these restricted boundaries.<br />
36
were chosen because they are well known to drug users, law enforcement<br />
personnel, and business and neighborhood groups as centers of drug<br />
consumption and sales in Seattle. This study was designed and supervised by an<br />
independent researcher with extensive knowledge of Seattle’s drug markets and<br />
implemented by two trained field ethnographers. 75 In this study, “rapid<br />
assessment” ethnographic methods were used to assess the racial and ethnic<br />
composition of those delivering and purchasing illegal drugs in these two<br />
neighborhoods. The experience of the field observers included prior observation<br />
of drug markets and activity, prior work with drug-using populations,<br />
familiarity with typical indicators of drug transactions and familiarity with drug<br />
market dynamics.<br />
These observations are an important supplement to the needle exchange survey<br />
data, which primarily include information about those who use and deliver<br />
injected drugs. Although more than 10 percent of the needle exchangers<br />
surveyed reported recently obtaining crack cocaine, the needle exchange survey<br />
omits crack cocaine users who do not also inject drugs. By contrast, the<br />
observational study captures those delivering crack cocaine as well as other<br />
drugs. (Both the needle exchange survey and the observational study largely<br />
omit recreational drug users who are more likely to acquire drugs indoors and<br />
unlikely to inject drugs).<br />
The unit of analysis in the observational study was transactions rather than<br />
individuals. Each time a drug transaction was observed, the race/ethnicity of the<br />
person(s) buying and delivering narcotics was recorded. Under this<br />
methodology, individuals who were observed buying or selling drugs repeatedly<br />
were counted multiple times, as the goal of the research was to identify the<br />
race/ethnicity of the drug deliverer in the observed drug transactions. That is, if<br />
the ethnographers observed 10 white people who each delivered drugs once and<br />
one black person who delivered drugs 10 times, the number of white and black<br />
“deliveries” reported in the study would be equal, as the risk of arrest is<br />
theoretically present each time the act is committed. Many sellers or dealers do<br />
not actually hold the drugs themselves, but receive the money and signal to<br />
another individual to pass the drugs. In some cases, the runner may also receive<br />
the money. Observers’ attention focused on buyers and on those who were<br />
involved in the physical transfer of drugs. If the race/ethnicity of a dealer who<br />
75<br />
Kris Nyrop is an independent consultant and former Director of Street Outreach Services. The<br />
proposed study design was reviewed by a qualified and experienced researcher. A summary of<br />
the results are on file with the author of this report.<br />
37
did not transfer drugs to the buyer could be observed, this information was also<br />
recorded. Thus, an individual transaction could involve both multiple deliverers<br />
and multiple buyers.<br />
Observation times were broken into two-hour blocks. These two-hour blocks<br />
were limited to times of previously observed drug activity, i.e. between 10:00 am<br />
and 10:00 pm for the downtown area, and between 12:00 pm and 12:00 am for the<br />
Capitol Hill area. Both prior and recent preliminary ethnographic observations<br />
indicated that drug activity begins and ends slightly earlier downtown than in<br />
Capitol Hill. Thirty hours of observation were conducted in the downtown area<br />
and 28 hours were conducted on Capitol Hill. Two-hour time blocks from within<br />
the “windows” identified previously were randomly selected over a three-week<br />
period. Each time slot was selected using a random number generator. Given the<br />
nature of true randomization, certain days ended up with no observation times,<br />
while others had as many as three. The perceived race of all individuals involved<br />
in each transaction was recorded in the observation log kept by the team of<br />
observers. The date and location of transactions, along with any unusual<br />
circumstances (e.g. police presence, obstructed views, or inclement weather) was<br />
also noted in the observation log.<br />
Insofar as these observations include only those who have direct contact with<br />
drug buyers and deliver drugs outdoors, they likely over-represent the poor and<br />
therefore people of color. Nonetheless, the results of this study indicate that the<br />
majority (59.8 percent) of those observed obtaining drugs outdoors in these two<br />
neighborhoods (combined) were white. Of the others, 28.2 percent were black,<br />
7.3 percent were Hispanic and 3.1 percent were Native American. Moreover, in<br />
each of the outdoor markets in which observations were conducted, the majority<br />
of the persons observed purchasing drugs were white (see Table 5).<br />
The data thus indicate that a variety of serious drugs are widely used and abused<br />
by those living in Seattle. These include cocaine, which is smoked, snorted and<br />
injected; ecstasy (MDMA); methamphetamine and other stimulants; heroin and<br />
other opiates; sedatives; tranquilizers; inhalants and hallucinogens. General<br />
surveys indicate that ecstasy and powder cocaine are most commonly used by<br />
Seattle residents as a whole; among youth, hallucinogens and stimulants are also<br />
quite popular. Treatment admission data also indicate that a number of<br />
substances are abused by Seattle residents, primarily cocaine (of all forms),<br />
heroin and amphetamines. Research by researchers at Public Health—Seattle &<br />
King County, the needle exchange survey results, and treatment admission data<br />
all indicate that comparatively low rates of heroin consumption reported in<br />
38
general surveys likely reflect the fact that heroin is a highly stigmatized drug,<br />
and that those surveys tend to miss the homeless, transient and institutionalized.<br />
Indeed, there is evidence that the majority of Seattle IDUs who exchange needles<br />
are homeless or unstably housed and are therefore likely missed by surveys of<br />
the general population. The available evidence also indicates that most of the<br />
estimated 15,000 IDUs who reside in King County and exchange needles live and<br />
obtain their drugs in Seattle; most of these IDUs inject heroin, while some also<br />
inject powder cocaine and/or methamphetamine.<br />
Table 5. Racial and Ethnic Composition of Observed Drug Purchasers,<br />
Capitol Hill and Downtown Seattle, 2007<br />
White Black Hispanic<br />
Native<br />
American/<br />
Alaska Native<br />
Asian<br />
Capitol Hill<br />
(n=55)<br />
80% 14.5% 3.6% 1.8% 0<br />
Downtown<br />
(n=204)<br />
All Drug<br />
Transactions<br />
(n=259)<br />
54.4% 31.9% 8.3% 3.4% 1%<br />
59.8% 28.2% 7.3% 3.1% .8%<br />
Source: Kris Nyrop, Demographic Comparisons of Two Public Venue Drug Markets in Seattle.<br />
All of the available data sources indicate that the majority of those who use<br />
heroin, powder cocaine, methamphetamine, ecstasy and prescription drugs (nonmedically)<br />
are white. With respect to crack cocaine, the findings are mixed. On<br />
the one hand, the needle exchange survey results indicate that the majority of<br />
those who use crack cocaine are white. On the other hand, TARGET public drug<br />
treatment data indicate that the majority of the Seattle residents admitted to<br />
publicly-funded drug treatment programs and who primarily abuse crack<br />
cocaine are black. Although seemingly contradictory, this difference likely<br />
reflects the fact that the needle exchange survey data includes crack cocaine users<br />
only if they also inject drugs and exchange needles. Since most injection drug<br />
users who exchange needles are white, this survey reports higher levels of white<br />
crack cocaine use. By contrast, the treatment admission data include those who<br />
abuse crack cocaine whether or not they also inject drugs. As a result, this data<br />
source reports higher levels of crack cocaine use among blacks.<br />
39
Insofar as many drug users knowingly transfer narcotics in the course of their<br />
using activities and facilitate or participate in drug delivery in order to obtain<br />
narcotics, these data suggest that the majority of those who deliver serious drugs<br />
in these contexts are white. The following section considers data sources that<br />
shed more direct light on the racial and ethnic composition of those who deliver<br />
serious drugs in Seattle.<br />
<strong>THE</strong> RACIAL <strong>AND</strong> ETHNIC COMPOSITION <strong>OF</strong> <strong>DRUG</strong> DELIVERERS <strong>IN</strong> SEATTLE<br />
Three data sources provide information about the racial and ethnic composition<br />
of those who deliver serious drugs in Seattle, all of which were also considered in<br />
the previous section of this report. These include SAMHSA’s Survey on Drug Use<br />
and Health, the 2007–2008 Seattle-King County Needle Exchange Survey and the<br />
observational study of the Capitol Hill and downtown drug venues. 76 Because<br />
the methodological issues pertaining to these data sources were described<br />
previously, they are reiterated only briefly in this section. The review of these<br />
data sources indicates that the majority of those who deliver all serious drugs,<br />
with the possible exception of crack cocaine, are white. As noted in the<br />
introduction, this finding stands in sharp contrast to the racial composition of<br />
those purposefully arrested for delivery of a serious drug.<br />
76 Citizen complaints about perceived drug activity are not treated here as a reliable source of<br />
information about the Seattle drug market and its participants, for several reasons. First,<br />
people’s willingness to call 9-1-1 or to file a complaint with the police department is<br />
undoubtedly shaped by a number of personal and social characteristics, none of which are well<br />
understood. That is, not all persons who witness or believe they are witnessing illicit drug<br />
activity will call 9-1-1 to report it. Second, an emerging body of research suggests that racial<br />
stereotypes shape perceptions of the seriousness and/or dangerousness of potentially crimerelated<br />
situations, particularly when information about those situations is limited. For example,<br />
Quillian and Pager (2001) found that the percentage of young black men living in a<br />
neighborhood has a strong positive effect on residents’ perceptions of the level of crime in that<br />
neighborhood and that this effect exists even after crime rates and other objective factors were<br />
taken into account. Similarly, Sampson and Raudenbush (2004) report that residents’<br />
perceptions of neighborhood disorder are significantly affected by the racial, ethnic and class<br />
composition of the neighborhood. Finally, in many cases included in our four-month sample of<br />
9-1-1 calls, resident complaints about perceived drug activity were determined by officers to<br />
have been incorrect and/or unreliable. For example, some 9-1-1 callers reported what they<br />
perceived to be a large group of black teenagers smoking crack; when the police arrived, they<br />
found instead a few youths, some of whom were smoking cigarettes (see Appendix B for other<br />
examples). Although 9-1-1 calls and other narcotics complaints are not a reliable source of<br />
information about the demographic characteristics of those who use and distribute illicit drugs,<br />
they are a source of information about citizen complaints regarding drug use and will be<br />
analyzed in that context.<br />
40
SAMHSA’S HOUSEHOLD SURVEY ON <strong>DRUG</strong> USE <strong>AND</strong> HEALTH<br />
In recent years federal researchers have incorporated questions about<br />
involvement in drug sales in SAMHSA’s annual Survey on Drug Use and Health.<br />
In particular, the survey now includes the question: “have you sold illegal drugs<br />
in the past year?” 77 The results of the survey pertaining to Seattle residents<br />
indicate that in the years 2002–2006, an average of 4.7 percent of all Seattle<br />
residents aged 12 and older sold an (unspecified) illegal drug in the previous<br />
year. Extrapolated to the Seattle population aged 12 and older, 78 these figures<br />
suggest that from 2002 to 2006, an average of 23,547 Seattle residents sold an<br />
illegal drug at least once in the previous year.<br />
Notably, reported involvement in drug sales among white residents was greater<br />
than for Seattle residents as a whole. Specifically, 5.2 percent of white Seattle<br />
residents aged 12 and older, but 4.7 percent of all Seattle residents, indicated that<br />
they had sold an illegal drug in the previous year. Although the sample size for<br />
other racial and ethnic groups was suppressed by federal researchers, these<br />
results nonetheless suggest two things: many Seattle residents sell illegal drugs,<br />
and a clear majority of those who report doing so are white. Indeed,<br />
extrapolating these figures to the Seattle population as a whole suggests that 76.1<br />
percent of those who sell illegal drugs in Seattle are white. 79<br />
<strong>THE</strong> 2007–2008 SEATTLE NEEDLE EXCHANGE SURVEY<br />
The Seattle-King County Needle Exchange Survey also provides information about<br />
the race/ethnicity of Seattle needle exchangers and the race/ethnicity of the<br />
person(s) from whom they obtain their drugs. 80 Needle exchangers were asked to<br />
identify any illicit drug(s) they had recently obtained and the race/ethnicity of<br />
77 Unfortunately, the SAMHSA surveyors did not ask respondents to identify the type of drug sold.<br />
78 Population figures for this calculation were taken from U.S. Census Bureau, Census 2000,<br />
Summary File 1, Table P12. Half of those in the 10–14 age range were combined with younger<br />
residents and subtracted from general population figures to calculate the proportion of the<br />
resident population aged 12 and older.<br />
79<br />
These calculations were based on 2000 U.S. Census Bureau population counts provided in<br />
Tables QT-P6, P12, and P121; half of those in the 10–14 age range were combined with younger<br />
residents and subtracted from general population figures to calculate the proportion of the<br />
resident population and white resident population aged 12 and older.<br />
80<br />
In Washington State, drug delivery includes any knowing physical transfer of a controlled<br />
substance to another party (such as sharing or selling drugs) or the facilitation of any knowing<br />
transfer of these substances (Rev. Code Wash. 69.50.401). Although the needle exchange<br />
survey does not record whether the purchaser paid cash for the drugs obtained, this distinction<br />
is not relevant, as any knowing transfer of drugs meets the legal definition of drug delivery.<br />
41
the person who provided these substances. These responses provide information<br />
regarding nearly 1,000 drug transactions. The unit of analysis in this survey is<br />
drug transactions: if black drug dealers were delivering drugs obtained by<br />
needle exchangers more frequently than white dealers, this would be reflected in<br />
the survey results. Although this survey sample consists of injection drug users,<br />
many of those who inject drugs also use other drugs not contained in the<br />
needle(s) just exchanged. The results thus provide information about 170<br />
transactions involving crack cocaine and prescription drugs.<br />
The results of the 2007–2008 Seattle-King County Needle Exchange Survey provide<br />
additional evidence that the majority of those who deliver illegal drugs in Seattle<br />
are white. This was true for all drugs except crack cocaine. A substantial minority<br />
of the powder cocaine, heroin and crack cocaine transactions involved Latino<br />
deliverers. The only drug for which blacks comprise a plurality (49.4 percent) of<br />
dealers was crack cocaine (see Table 6).<br />
Table 6. The Racial and Ethnic Composition of Seattle Providers of Serious<br />
Drugs, Seattle-King County Needle Exchange Survey<br />
Heroin<br />
(n=433)<br />
Powder<br />
Cocaine<br />
(n=195)<br />
Meth/<br />
Stimulants<br />
(n=95)<br />
Prescription<br />
Drugs<br />
(n= 83 )<br />
Crack<br />
Cocaine<br />
(n=85)<br />
Any of the<br />
above<br />
(n=985)<br />
White<br />
Black/<br />
African<br />
American<br />
American<br />
Indian/<br />
Alaska<br />
Native<br />
Hispanic/<br />
Latino<br />
Asian<br />
55.7% 8.1% 1.8% 29.8% 0<br />
41% 20% 1% 34.4% .5%<br />
82.1% 7.4% 0 2.1% 4.2%<br />
65.1% 6% 3.6% 7.2% 3.6%<br />
17.6% 49.4% 1.2% 20% 2.4%<br />
52.7% 14.3% 1.6% 24.7% 1.1%<br />
Source: 2007–2008 Seattle-King County Needle Exchange Survey.<br />
42
In short, the results of the survey indicate that majority of those who provide<br />
needle exchangers with illicit substances are white, a substantial minority are<br />
Latino/Hispanic and only 14.3 percent are black. Theoretically, it is possible that<br />
the racial and ethnic differences between the survey respondents and nonrespondents<br />
could be reducing levels of black involvement in drug delivery<br />
indicated by the needle exchange survey. Specifically, the fact that the nonresponse<br />
rate was higher for blacks than whites could reduce the proportion of<br />
drug deliverers identified as black. However, if non-respondents (whose<br />
race/ethnicity was recorded) are included in the analysis, and we assume that the<br />
same user-dealer relationships that existed for respondents exist for all needle<br />
exchangers, 81 the proportion of deliveries estimated to involve black deliverers<br />
only increases by one-tenth of one percent, and the proportion that involve<br />
whites is unchanged. 82 The fact that the results change very little when nonrespondents<br />
are included reflects the fact that only 34 percent of black needle<br />
exchangers acquired their drugs from a black person; the majority obtained their<br />
drugs from either a white or Latino person. The comparatively low level of black<br />
involvement in drug delivery indicated by the needle exchange survey thus<br />
appears not to be a function of lower response rates among black needle<br />
exchangers.<br />
ETHNOGRAPHIC OBSERVATIONS<br />
The aforementioned observational study of two outdoor drug venues provides<br />
additional evidence that a majority of those who deliver illicit drugs in Seattle are<br />
white. This is true despite the fact that the study includes only outdoor drug<br />
activity and focuses on those at the bottom of the drug distribution hierarchy,<br />
features sometimes thought to explain black over-representation among drug<br />
arrestees. 83 According to these results, 84 percent of those who were observed<br />
delivering drugs in Capitol Hill, and half (49.5 percent) of those observed<br />
delivering drugs downtown, were white. A clear majority (56.8 percent) of those<br />
observed delivering drugs in either of these venues were white (see Table 7).<br />
81 There is no apparent reason to suspect that the race/ethnicity of the person who supplied the<br />
needle exchanger with a drug would influence needle exchangers’ willingness to complete a<br />
survey. It is therefore reasonable to assume that the same user-dealer relationships exist<br />
among respondents and non-respondents.<br />
82 This result was obtained by multiplying the number of black, Latino, white, and “other” users<br />
by the difference between the share of each group in the respondent population and total<br />
needle exchanger population.<br />
83<br />
See Duster 1997; Goode 2002.<br />
43
Table 7. Racial and Ethnic Composition of Observed Drug Deliverers, Capitol<br />
Hill and Downtown Seattle, 2007<br />
Capitol Hill<br />
(n=55)<br />
White Black Hispanic<br />
Native<br />
American/<br />
Alaska<br />
Native<br />
Asian<br />
83.6% 9.1% 3.6% 0 1.8%<br />
Downtown<br />
(n=204)<br />
All Drug<br />
Transactions<br />
(n=259)<br />
49.5% 33.3% 14.2% 1% .5%<br />
56.8% 28.2% 12% .8% .8%<br />
Source: Kris Nyrop, “Demographic Comparisons of Two Public Venue Drug Markets in<br />
Seattle.”<br />
<strong>RACE</strong>, ETHNICITY <strong>AND</strong> <strong>THE</strong> SEATTLE <strong>DRUG</strong> MARKET: CONCLUSIONS<br />
The data analyzed in this section support several conclusions. First, the Seattle<br />
market for serious illegal drugs is substantial: over 18 percent of all Seattle residents<br />
report having used a serious illegal drug (i.e., an illicit drug other than<br />
marijuana) in the previous year. Rates of serious drug use appear to be even<br />
higher among Seattle youth: over one-fourth of all Seattle public school students<br />
in grades 6–12 report having used a serious illegal drug in the previous month.<br />
Among the adult and student populations, the most popular serious drugs are<br />
ecstasy, cocaine, hallucinogens and stimulants. However, because these surveys<br />
miss the homeless, transient and institutionalized, they may undercount other<br />
categories of serious drug use, especially injection drug use. King County health<br />
officials estimate that the county is home to 15,000–18,000 IDUs. The evidence<br />
indicates that most of the IDUs who exchange needles in King County live and<br />
obtain their drugs inside Seattle; the most commonly injected drugs are heroin,<br />
powder cocaine and methamphetamine. Among those admitted to public<br />
treatment programs, cocaine (mostly smoked and injected), heroin and<br />
methamphetamine are most commonly abused. Robust markets for all serious<br />
drugs, including all forms of cocaine, ecstasy, heroin, methamphetamine and<br />
prescription drugs, appear to exist in Seattle.<br />
Second, multiple data sources indicate that the majority of those who use serious<br />
drugs in Seattle are white. This is the case despite the fact that most of the data<br />
44
sources over-represent the poor and therefore likely over-represent people of<br />
color. For example, TARGET data include only those admitted to publicly<br />
funded treatment programs. Nonetheless, these data sources indicate that a<br />
majority of those who use serious drugs in Seattle are white (see Table 8). Insofar<br />
as many drug users deliver drugs in the course of their using activities, and<br />
many others deliver drugs in order to maintain their drug habit, these data<br />
sources imply that the majority of user-deliverers are white.<br />
Finally, the data reviewed in this section indicate that the majority of those who<br />
deliver serious drugs in Seattle are white (see the bottom three rows of Table 8).<br />
Specifically, the SAMHSA survey, the needle exchange survey, and the<br />
observational study of the Capitol Hill and downtown markets all indicate that a<br />
majority of those who deliver drugs in Seattle are white. This pattern is<br />
especially notable given that neither the needle exchange survey nor the<br />
observational study provides information about the racial composition of those<br />
higher up in the drug distribution system. 84 Insofar as this system is stratified by<br />
race, this omission may lead to an underestimate of white involvement, and an<br />
over-estimate of black involvement, in drug distribution. In addition, the<br />
observational study includes only those who deliver drugs in outdoor venues.<br />
Nevertheless, all of the available data sources indicate that the majority of those<br />
who use and deliver serious drugs in Seattle are white.<br />
Of the three data sources that provide information about the racial and ethnic<br />
composition of those who deliver serious drugs in Seattle, only one provides<br />
information about the racial and ethnic composition of those who deliver<br />
particular drugs. Specifically, the results of the 2007–2008 Seattle-King County<br />
Needle Exchange Survey indicate that a majority of those who deliver<br />
methamphetamine, heroin and prescription drugs, and a plurality of those who<br />
deliver powder cocaine, are white. The only exception to this pattern involved<br />
crack cocaine: 17.6 percent of the needle exchange clients who had recently used<br />
crack cocaine reported obtaining that drug from a white person; larger<br />
percentages obtained their crack cocaine from a black (49.4 percent) or Latino (20<br />
percent) person. In short, this survey provides further evidence that most of<br />
those who deliver serious drugs other than crack cocaine in Seattle are white. The<br />
next section compares this body of information with data regarding the race and<br />
ethnicity of those purposefully arrested for delivery of a serious drug in Seattle.<br />
84 By contrast, the SAMHSA survey asks only if the respondent sold drugs in the previous year,<br />
and may therefore capture those who serve as “wholesalers” as well as “retailers.”<br />
45
Table 8. Summary of Data Pertaining to Racial and Ethnic Composition of<br />
Seattle Users and Deliverers of All Serious Drugs<br />
White<br />
Black/<br />
African<br />
American<br />
Latino/<br />
Hispanic<br />
Seattle City Population<br />
American<br />
Indian/<br />
Alaska<br />
Native<br />
Asian<br />
U.S. Census Bureau:<br />
2000 Decennial<br />
Census<br />
U.S. Census Bureau:<br />
2006 American<br />
Community Survey<br />
SAMHSA Survey<br />
(Past Month Users)<br />
Seattle Public<br />
School Students*<br />
Public Drug<br />
Treatment Admittees<br />
Needle Exchange<br />
Survey<br />
Ethnographic<br />
Observations<br />
68% 8.2% 5.3% 1% 13.1%<br />
68% 7.9% 5.9% .8% 12.9%<br />
Seattle Drug Users<br />
63.9% NR NR NR NR<br />
49.6% 18.7% 10% NR 13.4%<br />
53.1% 27.8% 9.7% 2.4% 1.7%<br />
67.7% 11% 4.4% 7.9% .2%<br />
59.8% 28.2% 7.3% 3.1% .8%<br />
Seattle Drug Deliverers<br />
SAMHSA Survey on<br />
Drug Use and Health<br />
Needle Exchange<br />
Survey<br />
Ethnographic<br />
Observations-<br />
Downtown and<br />
Capitol Hill<br />
76.1% NR NR NR NR<br />
52.7% 14.3% 24.7% 1.6% 1.1%<br />
56.8% 28.2% 12% .8% .8%<br />
Notes: “NR” indicates that the results were not reported by data collectors due to small<br />
sample sizes. Prevalence estimates from these data sources were extrapolated to the ageappropriate<br />
Seattle population using 2000 U.S. Census survey data. When extrapolating the<br />
SAMHSA Survey on Health and Drug Use, population figures for each racial group aged 14<br />
and older were combined with half of those aged 10–14. When extrapolating the Communities<br />
of Care survey of sixth- through twelfth-grade Seattle Public School students, the number of<br />
persons aged 10–17 in each racial/ethnic group was utilized. The SAMHSA Survey on Drug<br />
Use and Health does not distinguish between those who sell marijuana and those who sell<br />
other drugs.<br />
46
PART II: SEATTLE PURPOSEFUL <strong>DRUG</strong> <strong>DELIVERY</strong> ARRESTS<br />
One of the goals of this study is to determine whether the racial and ethnic<br />
composition of those arrested in Seattle for delivery of a serious drug has<br />
changed since 1999–2001. The study also assesses how the extent of black overrepresentation<br />
among Seattle arrestees compares to that found in other mid-sized<br />
cities. The evidence described in this section indicates that Seattle arrests in 2005–<br />
2006 are characterized by an even greater degree of racial disproportionality than<br />
was the case in 2000, and that the degree to which blacks are over-represented<br />
among drug arrestees in Seattle is greater than in all but one of the other midsized<br />
cities for which data are available.<br />
Prior analysis of Seattle Police Department (SPD) arrest records from January<br />
1999 to April 2001 by the author of this report indicates that 64.2 percent of those<br />
arrested for delivery of a serious drug were black; another 14 percent were<br />
Latino. 85 Although the available evidence indicated that a clear majority of those<br />
who delivered serious drugs in Seattle during this period were white, only 17.6<br />
percent of those arrested for delivery of serious drugs were non-Hispanic whites.<br />
Although a clear majority of those arrested during this previous time frame were<br />
black, the race/ethnicity of drug delivery arrestees varied widely across drug<br />
categories. In fact, most of those arrested for delivery of heroin,<br />
methamphetamine, ecstasy and powder cocaine were white or Latino. The only<br />
drug category for which there were more black than white delivery arrestees was<br />
crack cocaine. But the SPD focused overwhelmingly on crack cocaine.<br />
Specifically, the SPD made 1,594 purposeful arrests for crack cocaine delivery,<br />
85<br />
Although Seattle police officers are not asked to record the ethnicity of arrestees on their<br />
incident reports, some officers do identify suspects as Hispanic. However, this practice is<br />
inconsistent. The previous analysis (Beckett 2004) utilized a methodology called Hispanic<br />
Surname Analysis to identify white suspects categorized by police officers as white. A numeric<br />
value between 0 and 1 was assigned to all arrestees initially coded as white in each subcategory<br />
(for example, delivery arrestees citywide, cocaine delivery arrestees in the West<br />
Precinct, etc). These numeric values are provided by the U.S. Census Department and<br />
represent the probability that a given surname corresponds to persons who identified as<br />
Hispanic/Latino in the 1990 U.S. Census. For each analysis, the mean of these numeric values<br />
(e.g. .18, or 18 percent) was used to estimate the percent of whites that are Latino. Applying<br />
this technique to the 1999–2001 arrest reports suggests that officers identify white Hispanics<br />
as Hispanic about half of the time. This technique was not used in the following analysis of the<br />
2005–2006 arrest data because the last name of the suspect was redacted in some of the<br />
records provided by the SPD. As a result, whites are over-represented, and Latinos underrepresented,<br />
in the following analyses of Seattle drug arrests.<br />
47
ut only 89 for methamphetamine, ecstasy and powder cocaine combined in the<br />
1999–2001 period. Because the vast majority (74 percent) of the serious drug<br />
delivery arrests from 1999–2001 involved crack cocaine, the majority of those<br />
arrested were black. The SPD’s overwhelming focus on crack cocaine was thus a<br />
primary cause of racially disparate arrest rates in Seattle.<br />
2005–2006 SEATTLE <strong>DRUG</strong> <strong>DELIVERY</strong> ARRESTS<br />
The analysis of more recent arrest records indicates that these patterns—the<br />
over-representation of blacks among drug arrestees and the dominance of crack<br />
cocaine arrests relative to arrests involving other serious drugs—has not<br />
changed. 86 A clear majority (74.1 percent) of the purposeful delivery arrests that<br />
took place during the four-month sampling period from 2005 to 2006 involved<br />
(only) crack cocaine. During this time, the SPD made 209 purposeful delivery<br />
arrests involving (only) crack cocaine, but only 24 involving powder cocaine,<br />
methamphetamine, ecstasy or heroin (see Figure 7).<br />
80%<br />
70%<br />
60%<br />
50%<br />
40%<br />
30%<br />
20%<br />
10%<br />
0%<br />
Figure 7. Purposeful Seattle Drug Delivery Arrests by Drug,<br />
1999-2001 and 2005-2006<br />
Meth Heroin Ecstasy Powder<br />
Cocaine<br />
Crack<br />
1999-2001<br />
2005-2006<br />
Source: Seattle Police Department incident reports.<br />
Note: Another 7.1 percent of all purposeful drug delivery arrests involving serious drugs<br />
involved crack cocaine and another serious drug.<br />
86<br />
All narcotics-related Seattle Police Department incident reports for the months of April and<br />
May 2005 and 2006 were provided to attorneys from The Defender Association and the ACLU<br />
Drug Law Reform Project and made available for analysis. The results presented here are<br />
based on an analysis of this four-month sampling period. Incidents in which no arrest was<br />
made or where the arrest location fell outside Seattle city boundaries were not included in the<br />
analysis.<br />
48
As was the case from 1999 to 2001, the focus on suspected deliverers of crack<br />
cocaine appears to be a significant cause of racial disparity in Seattle drug arrests.<br />
Two-thirds (67 percent) of those arrested for delivery of any serious drug are<br />
black. As previously noted, nearly three-fourths of these arrests involved crack<br />
cocaine, and nearly three-quarters of those arrested for delivery of crack cocaine<br />
were black. As a result, blacks comprise a large majority of those who are<br />
arrested for delivery of any serious drug. By contrast, less than one-fourth of<br />
those arrested for delivery during this time period are white (see Table 9).<br />
Heroin<br />
(n=6)<br />
Powder Cocaine<br />
(n=10)<br />
Methamphetamine<br />
(n=8)<br />
Crack Cocaine<br />
(n=209)<br />
Multiple drugs with<br />
Crack cocaine<br />
(n=20)<br />
Multiple drugs-<br />
No Crack cocaine<br />
(n=7)<br />
Other/ Unidentified<br />
(n=14)<br />
All Delivery<br />
Arrests (n=282)<br />
Table 9. The Race and Ethnicity of Purposeful Seattle<br />
Drug Delivery Arrestees, 2005–2006<br />
White<br />
Black/<br />
African<br />
American<br />
American<br />
Indian/<br />
Alaska Native<br />
Hispanic/<br />
Latino<br />
Asian<br />
66.7% 16.7% 16.7% 0 0<br />
50% 40% 0 10% 0<br />
75% 0 0 25% 0<br />
16.7% 74.6% 1% 4.8% 1.9%<br />
20% 70% 5% 0 5%<br />
42.9% 14.3% 0 0 42.9%<br />
42.9% 57.1% 0 0 0<br />
22.3% 67% 1.4% 5.7% 2.8%<br />
Source: Seattle Police Department incident reports.<br />
Notes: Figures are based on a four-month sample: April and May of 2005 and April and May<br />
of 2006. Race was unknown in two cases.<br />
Although the results indicate that fewer than one-fourth of those purposefully<br />
arrested for delivering a serious drug are white, it is likely that this figure shown<br />
over-estimates white representation among drug arrestees, as some of those<br />
classified as white are likely Hispanic. When Hispanic Surname Analysis was<br />
applied to the 1999–2001 arrest reports, the results indicated that officers identify<br />
white Hispanics as white about half the time and Hispanic about half of the<br />
49
time. 87 As noted previously, this technique was not used in this analysis of the<br />
2005–2006 arrest reports because the last name of the suspect was redacted in<br />
some of the records. However, we can estimate based on the previous pattern<br />
that roughly 12 percent of the delivery arrestees were Hispanic and 17 percent<br />
were white.<br />
Arrest outcomes varied somewhat by operation type. The majority of purposeful<br />
delivery arrests were the result of a buy-bust operation. Just over a quarter—28.7<br />
percent—were the result of a “see-pop.” Just over 7 percent resulted from the<br />
execution of a narcotics search warrant, and the remainder resulted from another<br />
narcotics investigation (see Figure 8).<br />
Figure 8. Purposeful Seattle Drug Delivery Arrests by<br />
Operation Type, 2005-2006<br />
12%<br />
7%<br />
Buy Bust<br />
See-Pop<br />
29%<br />
52%<br />
Narcotics Search<br />
Warrant<br />
Other<br />
Source: Seattle Police Department incident reports.<br />
The majority of those arrested through buy-busts, see-pops and other narcotics<br />
investigations were black. A plurality (38.1 percent) of those arrested as a result<br />
of a narcotics search warrant were white (see Figure 9). Thus, a majority of those<br />
arrested as a result of three of the four “purposeful” operation types were black.<br />
Notably, these three operation types were responsible for 92.6 percent of all<br />
arrests.<br />
87<br />
Beckett 2004.<br />
50
80%<br />
70%<br />
60%<br />
50%<br />
40%<br />
30%<br />
20%<br />
10%<br />
0%<br />
Figure 9. Purposeful Seattle Drug Delivery Arrests by<br />
Operation Type and Race, 2005-2006<br />
White Black Latino<br />
Buy Bust<br />
See-Pop<br />
Narcotics Search<br />
Warrant<br />
Other<br />
Source: Seattle Police Department incident reports.<br />
A significant majority (78 percent) of SPD delivery arrests took place outdoors.<br />
Only 15.6 percent took place indoors; the remaining 6 percent occurred in a<br />
vehicle. Although blacks comprised a larger share of those arrested outdoors<br />
(70.5 percent) than indoors (52.3 percent), the majority of those arrested in each<br />
location type (outdoors, indoors and in vehicles) were black (see Figure 10).<br />
70%<br />
60%<br />
Figure 10. Purposeful Seattle Drug Delivery Arrests by<br />
Location Type and Race, 2005-2006<br />
50%<br />
40%<br />
30%<br />
20%<br />
10%<br />
0%<br />
White Black Latino<br />
Indoors<br />
Outdoors<br />
In a vehicle<br />
Source: Seattle Police Department incident reports.<br />
51
Drug delivery arrests continue to be concentrated downtown: just over 57<br />
percent of the delivery arrests took place in the West Precinct (see Figure 11).<br />
Figure 11. Purposeful Seattle Drug Delivery Arrests by<br />
Precinct, 2005-2006<br />
15%<br />
57%<br />
3%<br />
18%<br />
East<br />
North<br />
South<br />
Southwest<br />
West<br />
7%<br />
Source: Seattle Police Department incident reports.<br />
Within the West Precinct, purposeful drug delivery arrests involving serious<br />
drugs are concentrated in a handful of census tracts, particularly census tract<br />
81. 88 In fact, more than one-fourth (26.3 percent) of all of Seattle’s purposeful<br />
drug delivery arrests involving serious drugs that took place during the fourmonth<br />
sampling period occurred within census tract 81. Nearly half of all<br />
delivery arrests that occurred in Seattle in these four months took place in just<br />
three census tracts: 81, 80 and 72 (see Figure 12). 89<br />
88<br />
Precinct is not identified in Seattle Police Department incident reports and was therefore<br />
derived either by beat or, if beat was unidentified, by geo-coding the arrest location provided by<br />
SPD officers. Although the incident report form does include an entry for census tract location,<br />
many of the census tracts identified on the form did not match the arrest location. Census tract<br />
was therefore also derived by geo-coding the arrest location.<br />
89 The five census tracts with the largest number of delivery arrests were census tract 81<br />
(downtown, 75 arrests), census tract 80 (Belltown, 37 arrests), census tract 72 (area<br />
surrounding the Seattle Center, 26 arrests), census tract 53 (University District, 20 arrests) and<br />
census tract 79 (Central District, 16 arrests).<br />
52
Figure Figure 12. Geographic 12. Geographic Distribution Distribution of Seattle of Seattle Drug Drug Delivery Delivery Arrests Arrests by Census by<br />
Census Tract Tract and and Point Point Location, Location, 2005–2006 2005–2006<br />
Source: Seattle Police Department incident reports.<br />
53
In sum, many of the arrest patterns previously documented continue to<br />
characterize Seattle drug delivery arrests. In particular, the majority of SPD<br />
delivery arrests involving serious drugs involve black suspects and crack<br />
cocaine. Arrests also continue to be geographically concentrated in the<br />
downtown area, and most occur outdoors.<br />
RACIAL DISPARITY <strong>IN</strong> SEATTLE <strong>DRUG</strong> ARRESTS <strong>IN</strong> COMPARATIVE PERSPECTIVE<br />
Racial disproportionality in Seattle drug arrests continues to be large relative to<br />
other mid-sized (and large) cities. 90 Table 10 shows the white and black drug<br />
arrest rates 91 in mid-sized cities (with populations ranging from 300,000 to<br />
800,000) for all drug-related arrests and arrests for delivery/sale of serious drugs.<br />
Table 10 also shows the black “over-representation” ratio, that is, the ratio of the<br />
black-to-white drug arrest rate for both of these categories. A black-to-white<br />
drug arrest rate ratio of 2 indicates that the black drug arrest rate is twice the<br />
white rate; a black-to-white drug arrest rate ratio of 10 means that the black drug<br />
arrest rate is ten times higher than the white drug arrest rate. The SPD reported<br />
its total number of drug arrests to the FBI in 2006, but did not report the number<br />
of drug sales arrests. SPD figures were used to calculate the total black and white<br />
drug arrest rates; the results of the analysis of the four-month 2005–2006<br />
sampling period were extrapolated to 2006 and used to estimate the black and<br />
white serious drug delivery arrest rates for that year.<br />
According to the SPD’s reported figures, Seattle has the fourth highest black total<br />
drug arrest rate—54.7 per 1,000 residents—of any mid-sized U.S. city for which<br />
data are available. 92 These figures also indicate that Seattle has the second highest<br />
black-to-white drug arrest ratio (13.6). That is, Seattle’s total black drug arrest<br />
rate was 13.6 times higher than the total white drug arrest rate. Of the 40 midsized<br />
cities that reported their arrest statistics to the FBI, only Minneapolis had a<br />
higher total black-to-white drug arrest ratio. 93<br />
90 See also Beckett et al. 2006.<br />
91 Rates were calculated per 1,000 residents of each race.<br />
92<br />
Among mid-sized cities, only San Francisco, Baltimore and Sacramento had higher black drug<br />
arrest rates. Only one (Las Vegas) of the nine larger cities that reported 2006 data to the FBI’s<br />
Uniform Crime Reporting Program had a higher black drug arrest rate than Seattle. Thus, the<br />
black drug arrest rate in Seattle was fifth highest among the 49 largest cities for which data are<br />
available for 2006. This is particularly notable given that very few marijuana arrests take place<br />
in Seattle since the adoption of proposition I-75 in 2003 (Marijuana Policy Review Panel 2007).<br />
93<br />
It is worth noting that although the disparity is very large in Minneapolis, the white and<br />
especially black drug sales arrest rates in that city are far lower than those found in Seattle,<br />
meaning that the volume of arrests is comparatively smaller in Minneapolis than in Seattle for<br />
54
If we focus only on delivery/sales/manufacture arrests involving serious drugs,<br />
Seattle’s black drug arrest rate for delivery of a serious drug was also higher than<br />
that found in all but one of the other mid-sized cities that reported arrest<br />
statistics to the FBI in 2006 (see Table 10). 94 Only one of the 38 mid-sized cities<br />
that reported arrest figures for 2006 (Minneapolis) had higher black-to-white<br />
drug arrest ratios for delivery/sales/manufacture of a serious drug. 95 Seattle’s<br />
black-to-white arrest ratio is 21.3. That is, black Seattle residents are more than 21<br />
times more likely than white Seattle residents to be arrested for delivery of a<br />
serious drug.<br />
This analysis thus indicates that the black drug arrest rate is comparatively high<br />
in Seattle: of the 38 other mid-sized cities included in the analysis, only one—San<br />
Francisco—had a higher black drug arrest rate than Seattle. Moreover, the blackto-white<br />
arrest rate ratio for drug law violations generally and for delivery of<br />
serious drugs is greater in Seattle than in 37 of the other 38 mid-sized cities for<br />
which data are available. If Seattle’s white drug arrest rate were equivalent to the<br />
black drug arrest rate in 2006, more than 26,000 white people would have been<br />
arrested for a drug law violation in 2006—nearly seven times the total number of<br />
Seattle drug arrests. 96 Instead, the number of white drug arrestees—1,592—was<br />
less than 7 percent of the number that would be obtained if whites were arrested<br />
at the same rate as blacks. Similarly, if the white arrest rate for delivery of a<br />
serious drug were equivalent to the estimated black rate in 2006, 6,446 white<br />
Seattle residents would have been arrested for delivery of a serious drug—nearly<br />
four times the estimated total number of arrests for 2006. Instead, 303 white<br />
people were arrested for delivery of a serious drug, less than 5 percent of the<br />
number that would be arrested if whites were arrested for delivery of a serious<br />
drug at the same rate as blacks.<br />
both racial groups. None of the nine larger cities that reported 2006 data to the FBI’s Uniform<br />
Crime Reporting Program had a higher black-to-white arrest ratio than Seattle. Thus, the<br />
black-to-white arrest ratio in Seattle is greater than in 47 of the 48 other cities with populations<br />
of more than 300,000 that reported arrest data to the FBI in 2006.<br />
94 Of the nine larger cities that also reported sales arrest figures in 2006, only San Antonio had a<br />
higher black drug arrest rate than Seattle. (These cities are not shown in Table 10; data are on<br />
file with the author).<br />
95 Notably, Minneapolis, Austin and Portland have relatively high black-to-white drug arrest<br />
ratios for drug sales arrests, but significantly lower black drug sales arrest rates than Seattle.<br />
In other words, the volume of arrests of black suspects in those cities is considerably smaller<br />
than in Seattle relative to the size of the black population of those cities. None of the nine<br />
larger cities had greater black-to-white arrest ratios than Seattle.<br />
96 These calculations assume that each arrest involved a person who had not previously been<br />
arrested that year, an assumption that may not be accurate.<br />
55
Table 10. Racial Disparity in Drug Arrests in Mid-Sized U.S. Cities, 2006<br />
White Drug<br />
Arrest Rate<br />
Black Drug<br />
Arrest Rate<br />
Black/<br />
White Drug<br />
Arrest Rate<br />
Ratio<br />
White Serious<br />
Drug Sales<br />
Arrest Rate<br />
Black Serious<br />
Drug Sales<br />
Arrest Rate<br />
Black/White<br />
Serious Drug<br />
Sales Arrest<br />
Rate Ratio<br />
Minneapolis, MN 2.07 41.75 20.16 0.03 2.28 71.06<br />
Seattle, WA 4.03* 54.69* 13.57* 0.77 16.34 21.30<br />
Austin, TX 2.94 11.61 3.96 0.07 1.43 20.39<br />
Portland, OR 7.05 50.26 7.13 0.38 6.09 16.21<br />
Aurora, CO 3.29 20.11 6.11 0.36 4.26 11.74<br />
Pittsburgh, PA 5.45 26.35 4.84 0.86 9.92 11.51<br />
Columbus, OH 0.09 1.14 13.16 0.01 0.13 10.18<br />
Fort Worth, TX 5.51 16.34 2.96 0.43 4.33 10.09<br />
Baltimore, MD 20.18 58.72 2.91 1.61 16.15 10.02<br />
San Francisco, CA 9.83 66.31 6.75 2.64 24.90 9.43<br />
St. Louis, MO 3.95 19.58 4.96 0.24 2.19 9.30<br />
Milwaukee, WI 3.54 16.29 4.61 0.37 3.46 9.30<br />
Kansas City, MO 8.87 33.20 3.74 0.55 4.83 8.74<br />
Oklahoma City, OK 1.96 12.46 6.35 0.37 3.18 8.57<br />
Omaha, NE 5.51 20.72 3.76 0.04 0.36 8.31<br />
Nashville, TN 5.19 34.44 6.63 0.42 3.49 8.26<br />
Raleigh, NC 4.16 20.41 4.91 0.50 4.06 8.21<br />
Denver, CO 3.76 26.84 7.13 0.77 5.73 7.48<br />
Oakland, CA 4.85 14.16 2.92 0.39 2.73 6.90<br />
Virginia Beach, VA 4.02 14.36 3.57 0.60 3.83 6.38<br />
Mesa, AZ 4.53 13.31 2.94 0.31 1.92 6.15<br />
Colorado Springs, CO 5.94 17.84 3.01 0.19 1.10 5.76<br />
Cleveland, OH 4.07 14.32 3.51 0.44 2.45 5.61<br />
Memphis, TN 5.66 19.86 3.51 0.38 1.96 5.11<br />
Albuquerque, NM 2.05 4.42 2.16 0.44 2.17 4.90<br />
Long Beach, CA 3.85 19.27 5.00 2.98 14.36 4.83<br />
Wichita, KS 17.30 39.95 2.31 1.31 6.12 4.67<br />
Sacramento, CA 4.08 18.92 4.64 0.15 0.71 4.61<br />
Tulsa, OK 17.50 56.68 3.24 1.58 7.23 4.58<br />
Louisville, KY 5.57 18.90 3.39 0.86 3.83 4.46<br />
Boston, MA 28.63 54.43 1.90 1.57 6.73 4.29<br />
Atlanta, GA 5.60 19.45 3.47 1.70 7.27 4.27<br />
Arlington, TX 7.05 45.32 6.42 0.94 3.70 3.94<br />
San Jose, CA 5.18 14.72 2.84 0.50 1.86 3.71<br />
Tucson, AZ 12.74 30.43 2.39 1.34 4.34 3.23<br />
El Paso, TX 17.04 48.63 2.85 1.50 4.46 2.98<br />
Santa Ana, CA 5.25 9.95 1.90 0.13 0.23 1.77<br />
Fresno, CA 15.47 39.31 2.54 1.78 2.96 1.66<br />
Anaheim, CA 23.63 34.11 1.44 2.29 3.58 1.56<br />
Sources: FBI Uniform Crime Reporting Program; Seattle Police Department; U.S. Census<br />
Bureau.<br />
Notes: The mid-sized cities included here are those with populations of 300,000–800,000 in<br />
order to maximize comparability with Seattle. Seattle figures marked with an asterisk are<br />
based on figures reported by the SPD to the FBI; other figures are based on the analysis of<br />
the four-month sample and extrapolated to 2006. “Sales” arrests include drug delivery, sales<br />
and manufacturing arrests that result from any type of operation. If only purposeful arrests<br />
are included, Seattle’s black-to-white ratio for delivery arrests involving serious drugs rises<br />
to 24.2. Arrest rates were calculated using 2000 U.S. Census figures. If 2006 American<br />
Community Survey figures are used instead, Seattle’s total black-white drug arrest ratio<br />
rises to 13.9 (using SPD figures); the arrest ratio for serious drug sales arrests based on the<br />
four-month sample rises to 21.8.<br />
56
In sum, Seattle drug arrests are characterized by a high degree of racial<br />
disproportionality. More than two-thirds of those arrested for delivering a<br />
serious drug were black in 2005–2006, and the black delivery arrest rate is more<br />
than 20 times higher than the white delivery arrest rate. The percentage of drug<br />
delivery arrests that involved black suspects in 1999–2001 (64.2 percent) is nearly<br />
identical to the percentage of delivery arrests that involve black suspects in 2005–<br />
2006 (67 percent). As in 1999–2001, approximately three-quarters of all arrests for<br />
delivery of a serious drug involve crack cocaine. The majority of Seattle’s drug<br />
delivery arrests were the result of a “buy-bust” operation; about a quarter<br />
resulted from “see-pops.” The vast majority of Seattle’s drug delivery arrests<br />
took place outdoors. The majority of those arrested indoors as well as outdoors<br />
were black. Serious drug delivery arrests were concentrated in the West Precinct<br />
and particularly in the downtown area.<br />
The analysis presented above provides descriptive information about Seattle<br />
drug arrests and compares the magnitude of the racial disproportionality in<br />
those arrests with that found in comparable cities. The results indicate that more<br />
than two-thirds of those arrested for delivery of a serious drug in Seattle are<br />
black, and that the degree to which blacks are over-represented among drug<br />
arrestees in Seattle is comparatively large. The remainder of this report compares<br />
Seattle drug arrest outcomes against those who actually deliver serious drugs in<br />
Seattle and considers a number of explanations for the fact that the black drug<br />
arrest rate is 21 times higher than the white drug arrest rate.<br />
57
PART III: EXPLA<strong>IN</strong><strong>IN</strong>G RACIAL DISPARITY <strong>IN</strong><br />
SEATTLE <strong>DRUG</strong> ARRESTS<br />
The data discussed in the previous section indicate that Seattle drug delivery<br />
arrests continue to be characterized by a high degree of racial disproportionality.<br />
The following section considers various explanations for Seattle’s racially<br />
disparate arrest outcomes. Some of these explanations identify “race-neutral”<br />
factors that may account for racial disproportionality in Seattle drug arrests. For<br />
example, it is conceivable that racial disparity in Seattle drug arrests stems from<br />
race differences in involvement in drug delivery. In other cases, however, the<br />
potential explanatory factor may or may not be considered race-neutral. In<br />
particular, the SPD’s focus on outdoor drug markets, the downtown area, and/or<br />
the crack cocaine market may explain racial disparity in arrest outcomes, but<br />
may or may not be best understood as race-neutral practices. Below, the<br />
empirical validity of these explanations of racially disparate arrest outcomes is<br />
assessed. To the extent that each of these factors is identified as a fundamental<br />
cause of racial disparity in drug arrests, the analysis then considers whether the<br />
explanatory practice identified is a function of race-neutral policy considerations.<br />
The results of this analysis indicate that race differences in involvement in drug<br />
delivery explain a relatively small proportion of the disparity in drug delivery<br />
arrests. That is, even if a “conservative” benchmark that excludes those who<br />
deliver drugs indoors is used, the black downtown drug arrest rate is 13.6 times<br />
higher than the white downtown drug arrest rate. Moreover, both the underrepresentation<br />
of whites and over-representation of blacks among drug delivery<br />
arrestees (relative to those observed delivering drugs) downtown and elsewhere<br />
are highly statistically significant. 97<br />
Attention therefore turns to other factors that may explain racially disparate<br />
arrest outcomes. The evidence suggests that although the focus on outdoor drug<br />
venues and the downtown area contribute modestly to racial disproportionality<br />
in drug arrests, neither of these is a fundamental cause of racial disparity in<br />
arrest outcomes. By contrast, the racial composition of those arrested for delivery<br />
of crack cocaine is markedly different than the racial composition of those<br />
arrested for delivery of other serious drugs. It thus appears that either the focus<br />
97 The evidence also indicates that blacks are over-represented among Capitol Hill and University<br />
District arrestees.<br />
59
on black suspects leads to the predominance of crack cocaine deliverers among<br />
arrestees or that the focus on crack cocaine deliverers leads to an overrepresentation<br />
of blacks among delivery arrestees. If the former is the case, then<br />
the SPD is engaging in racial profiling. For the sake of caution, the subsequent<br />
discussion assumes that the focus on crack cocaine explains the overrepresentation<br />
of blacks among delivery arrestees, and considers whether the<br />
focus on this particular drug is justified by race-neutral policy considerations<br />
such as public health, public safety or citizen complaints. The findings indicate<br />
that the focus on crack cocaine is not a function of these race-neutral factors. This<br />
finding supports an alternative explanation: that the focus on crack cocaine<br />
reflects the association of that particular substance with blacks.<br />
HYPO<strong>THE</strong>SIS 1: RACIAL DISPARITY <strong>IN</strong> <strong>DRUG</strong> ARRESTS IS A FUNCTION <strong>OF</strong> <strong>RACE</strong> DIFFERENCES<br />
<strong>IN</strong> <strong>IN</strong>VOLVEMENT <strong>IN</strong> <strong>DRUG</strong> <strong>DELIVERY</strong><br />
Racially disparate arrest rates in Seattle may or may not reflect race differences in<br />
drug law offending. In the context of Seattle, the question is whether the black<br />
serious drug delivery arrest rate is more than 21 times higher than the white<br />
serious drug delivery rate because blacks are close to 21 times more likely to<br />
deliver serious drugs than whites.<br />
The data presented in Part I of this report indicates that the majority of those<br />
who use and deliver serious drugs in Seattle are white. This appears to be true<br />
for all serious drugs with the probable exception of crack cocaine. At the same<br />
time, two of the three data sources that shed light on the racial composition of<br />
those who deliver drugs in Seattle suggest that black involvement in the delivery<br />
of serious drugs is greater than what would be expected on the basis of<br />
demographic information. 98 That is, Seattle’s population is approximately 8<br />
percent black, but 14 percent of the drug providers identified by needle<br />
exchangers, and 28 percent of those observed delivering drugs downtown or in<br />
Capitol Hill, were black (see Table 11). These figures suggest that black drug<br />
delivery rates are roughly two to three times what would be expected on the<br />
basis of Seattle demographics (although the SAMHSA survey results indicate<br />
98 The SAMHSA survey results indicate that 76.1 percent of those who sold drugs in Seattle in the<br />
past month were white. However, these data include marijuana and do not specify the<br />
prevalence of drug sales for other racial and ethnic groups. They are therefore not utilized in<br />
this analysis.<br />
60
that a higher percentage of whites than of all Seattle residents report having sold<br />
an illegal drug in the previous year). 99<br />
Table 11. Comparison of Racial/Ethnic Composition of Drug Deliverers and<br />
Drug Delivery Arrestees<br />
White<br />
Black/<br />
African<br />
American<br />
Latino/<br />
Hispanic<br />
Seattle Serious Drug Deliverers<br />
American<br />
Indian/<br />
Alaska<br />
Native<br />
Asian<br />
Needle Exchange<br />
Survey<br />
Ethnographic<br />
Observations<br />
52.7% 14.3% 24.7% 1.6% 1.1%<br />
56.8% 28.2% 12% .8% .8%<br />
Seattle Serious Drug Delivery Arrestees<br />
SPD Incident<br />
Reports<br />
23.3% 65.6% 6.1% 1.4% 2.9%<br />
Sources: 2007–2008 Seattle-King County Needle Exchange Survey; Nyrop, Demographic<br />
Comparisons of Two Public Venue Drug Markets in Seattle; Seattle Police Department.<br />
Note: As noted previously, it is likely that the figures shown over-estimate white<br />
representation among drug arrestees, as some of those classified as white are likely<br />
Hispanic. Based on patterns previously identified when Hispanic Surname Analysis was<br />
utilized, we can estimate based on the previous pattern that roughly 12 percent of the<br />
delivery arrestees in 2005–2006 were Hispanic and 17 percent were white.<br />
As discussed previously, each of these data sources possesses limitations. The<br />
needle exchange survey primarily provides information about the drugs used by<br />
injecting drug users who exchange needles, most of whom obtain their drugs<br />
outdoors. It largely omits recreational drug users, especially the over 40,000<br />
Seattle residents estimated (based on the SAMHSA survey results) to have used<br />
ecstasy and/or powder cocaine in the previous 30 days. It also omits those who<br />
primarily use crack cocaine and do not inject drugs. Although there is some<br />
overlap between crack cocaine users and injection drug users—more than 10<br />
percent of the needle exchange clients surveyed reported recently obtaining<br />
crack cocaine—it is likely that many crack cocaine users do not also inject drugs;<br />
such individuals are not included in the needle exchange survey. The needle<br />
exchange survey thus provides useful information about serious drug users who<br />
inject drugs and exchange needles, but not about those who inject but do not<br />
99 This survey question did not specify which drug was sold and undoubtedly included marijuana<br />
sales.<br />
61
exchange needles, recreational drug users, who are more likely not to inject, or<br />
those who primarily use crack cocaine.<br />
The observational study conducted in Capitol Hill and downtown compensates<br />
for the omission of information about those who provide crack cocaine to crack<br />
cocaine users who do not also inject drugs by including all of those who deliver<br />
drugs outdoors in two particular locales. Insofar as the observational study<br />
captures only those who deliver drugs outdoors, it may over-state the<br />
involvement of people of color in drug delivery all location types.<br />
The most comprehensive and reliable way to assess whether the racial<br />
composition of drug arrestees reflects the racial composition of those actually<br />
delivering drugs is to focus on the particular neighborhoods for which both<br />
observational and needle exchange survey data are available. Both the needle<br />
exchange survey and the observational study provide information about<br />
downtown and Capitol Hill drug transactions, and enable comparison of the<br />
racial composition of those arrested and the racial composition of those actually<br />
delivering drugs in these areas. It is important to note that the unit of analysis in<br />
both the needle exchange survey and the observational study is drug<br />
transactions rather than individuals who deliver drugs. If members of a<br />
particular racial/ethnic group deliver drugs more or less frequently than others,<br />
this will be captured in the results of both the needle exchange survey and the<br />
observational study.<br />
The “second wave” of the needle exchange survey was designed primarily to<br />
obtain more detailed information about the geographic location of reported drug<br />
transactions. Specifically, the survey asked needle exchangers to identify the<br />
neighborhood in which they last obtained a drug, the type of location (indoor,<br />
outdoor, vehicle) in which that transaction occurred, and the race/ethnicity of the<br />
person from whom they obtained that substance. 100 101 Second-wave surveys were<br />
conducted at three locations: downtown, in Capitol Hill and in the University<br />
District. 102<br />
100<br />
The “first wave” of the survey asked respondents whether they had obtained their drugs in<br />
Seattle, but did not provide detailed geographic information about Seattle drug transactions.<br />
101 This survey was designed by Kris Nyrop in conjunction with Public Health—Seattle & King<br />
County. Thanks again to Michael Hanrahan for his participation and cooperation.<br />
102<br />
The latter facility is operated by the People’s Harm Reduction Alliance; the first two by Public<br />
Health— Seattle & King County. Interviews were conducted for six consecutive days (3/31–4/5,<br />
2008) at both the downtown and Capitol Hill locations. Interviews were conducted for 15<br />
consecutive days at the University District location, where fewer numbers of exchangers tend<br />
to exchange larger numbers of needles.<br />
62
After clients had completed their syringe exchange activities they were<br />
approached by an interviewer and asked if they were willing to do a very brief<br />
anonymous and confidential survey that was being done for the local public<br />
defender’s office. The survey response rate in the “second wave” was very<br />
similar to that obtained in the first wave: 68.8 percent of those exchanging<br />
needles took the survey. The racial/ethnic composition of those who took the<br />
survey was similar to the racial/ethnic composition of those who declined to do<br />
so. 103<br />
The results of this survey provide information about 307 drug transactions that<br />
occurred downtown. 104 Of those who last obtained a drug downtown, the<br />
majority (70.4 percent) reported last obtaining heroin, 11.7 percent last obtained<br />
heroin and cocaine (together), 10.7 percent last obtained crack cocaine and 5.5<br />
percent last obtained powder cocaine. More than three-fourths (78.5 percent) of<br />
these transactions were reported to have occurred outdoors, 16 percent took<br />
place indoors and another 5.2 percent took place in vehicles. The results of this<br />
survey thus indicate that needle exchangers most often obtain heroin in the<br />
downtown area, and that the majority of these transactions occur outdoors. The<br />
results also indicate that a clear majority of those selling the drugs used by<br />
needle exchangers (mostly heroin) are white; only 12 percent of the downtown<br />
transactions involved a black drug supplier. This pattern remains consistent even<br />
if we limit our attention to outdoor transactions (see Table 12).<br />
103<br />
Specifically, those surveyed were 10.3 percent black, 79.6 percent white, 5.6 percent Latino,<br />
and 2.9 percent American Indian/Alaska Native. Those who declined to take a survey were<br />
11.4 percent black, 72.8 percent white, 9.2 percent Latino and 5.4 percent American<br />
Indian/Alaska Native. Although the overall response rate for blacks (66.7 percent) was slightly<br />
lower than for whites (70.7 percent) downtown, the response rate for blacks and whites was<br />
nearly identical (66 percent and 65.3 percent respectively). Moreover, over 90 percent of all<br />
blacks who exchanged needles and completed the survey did so downtown.<br />
104 Two of those surveyed reported last obtaining marijuana downtown; these transactions are<br />
not included in order to ensure comparability with arrest outcomes.<br />
63
Table 12. Racial and Ethnic Composition of Downtown Drug Deliverers,<br />
Seattle-King County Needle Exchange Survey Results<br />
Outdoor<br />
Transactions<br />
(n=241)<br />
Indoor<br />
Transactions<br />
(n=49)<br />
All Transactions<br />
(n= 307)<br />
White<br />
Black<br />
Hispanic/<br />
Latino<br />
Native American/<br />
Alaska Native<br />
Asian<br />
49.8% 12.9% 25.7% 1.2% 3.7%<br />
53.1% 10.2% 10.2% 4.1% 6.1%<br />
51.5% 12.1% 22.8% 1.6% 3.9%<br />
Source: 2007–2008 Seattle-King County Needle Exchange Survey, Second Wave.<br />
Note: 16 transactions took place in a vehicle and another 1 occurred in an unidentified location.<br />
Analyzing the results by drug type makes evident that a clear majority of the<br />
needle exchangers who last obtained heroin downtown were supplied it by a<br />
white person. Transactions involving cocaine and heroin together or crack<br />
cocaine were more likely to involve a black or Latino supplier. A plurality of<br />
those who last obtained powder cocaine got it from a person they identified as<br />
Latino or Hispanic (see Table 13). In short, the needle exchange survey data thus<br />
provide additional evidence that the majority of needle exchangers who last<br />
obtained drugs downtown primarily abuse heroin, and that the majority of those<br />
who provide them with that drug are white.<br />
The observational study also provides information about the racial composition<br />
of those delivering drugs outdoors downtown, and specifically in the area<br />
surrounding the Pike-Pine corridor west of Fifth Avenue (census tract 81). This<br />
area is unusually important, as over one-fourth of all the purposeful delivery<br />
arrests involving serious drugs took place in this one census tract. Unlike the<br />
needle exchange survey, the observational study captures information about<br />
those who supply crack cocaine users (who do not also inject drugs) with crack<br />
cocaine. Moreover, the observational study captures only those who deliver<br />
drugs outdoors, and therefore likely underestimates white involvement in drug<br />
delivery. However, because the observers were not always able to identify the<br />
substance being sold, the results cannot be analyzed by drug.<br />
64
Table 13. Racial and Ethnic Composition of Downtown Drug Deliverers by<br />
Drug, Seattle-King County Needle Exchange Survey Results<br />
Heroin<br />
(n= 216)<br />
Heroin and<br />
Cocaine<br />
(n=36)<br />
Crack<br />
Cocaine<br />
(n=33)<br />
Powder<br />
Cocaine<br />
(n=17)<br />
All<br />
Transactions<br />
(n= 307)<br />
White<br />
Black<br />
Hispanic/<br />
Latino<br />
Native<br />
American/<br />
Alaska<br />
Native<br />
Asian<br />
61.1% 5.6% 19.4% .9% 5.1%<br />
30.6% 22.2% 25% 5.6% 2.8%<br />
27.3% 33.3% 33.3% 3% 0<br />
11.8% 35.3% 47.1% 0 0<br />
51.5% 12.1% 22.8% 1.6% 3.9%<br />
Source: 2007–2008 Seattle-King County Needle Exchange Survey, Second Wave.<br />
According to the needle exchange survey results, just over half of those who<br />
recently supplied needle exchangers with drugs last obtained downtown were<br />
white; another one-fourth were Latino/Hispanic. The observational study yielded<br />
similar findings with respect to whites: half of those observed delivering drugs in<br />
the downtown area were white. Thus, both of these data sources indicate that<br />
about half of those delivering drugs downtown are white. The main difference<br />
between the two data sources centers on the relative involvement of blacks and<br />
Latinos. Whereas the needle exchange survey suggests higher levels of<br />
involvement among Latinos, the observational study suggests higher levels of<br />
black involvement. This difference likely reflects higher levels of black<br />
involvement in the delivery of crack cocaine and greater Latino involvement in<br />
heroin delivery.<br />
Although both the needle exchange survey results and the observational study<br />
suggest that about half of those delivering drugs downtown are white, fewer<br />
than one in ten of those purposefully arrested for delivery of a serious drug<br />
65
downtown (e.g. in census tract 81) were white. 105 Thus, whites appear to be<br />
dramatically under-represented among those arrested downtown. Conversely,<br />
although the evidence indicates that between 12 and 33 percent of the downtown<br />
drug transactions involve black drug deliverers, 85 percent of those arrested for<br />
drug delivery downtown are black (see Table 14).<br />
Table 14. Racial and Ethnic Composition of Downtown Drug Deliverers<br />
Downtown<br />
Transactions<br />
(Needle<br />
Exchange<br />
Survey, Second<br />
Wave ) (n=307)<br />
Downtown<br />
Transactions<br />
(Observational<br />
Study)<br />
(n=204)<br />
Downtown<br />
(Census Tract<br />
81) Delivery<br />
Arrestees<br />
(SPD) (n=75)<br />
White<br />
Black<br />
Hispanic/<br />
Latino<br />
Native<br />
American/<br />
Alaska Native<br />
Asian<br />
51.5% 12.1%* 22.8% 1.6% 3.9%<br />
49.5% 33.3% 14.2% 1% .5%<br />
9.3% 85.3% 1.3% 2.7% 1.3%<br />
Sources: 2007–2008 Seattle-King County Needle Exchange Survey; Nyrop, Demographic<br />
Comparisons of Two Public Venue Drug Markets in Seattle; Seattle Police Department<br />
incident reports.<br />
Note: *Approximately 2 percent of the transactions described by needle exchangers involved<br />
a mixed race person identified as “black and white.” These drug deliverers have been<br />
combined with deliverers identified as black or African American. Approximately 8 percent of<br />
the drug deliverers were identified as “other” or race was unknown. As noted earlier, the fact<br />
that Latinos are sometimes identified by SPD officers by race means that the white figure of<br />
9.3 percent is likely inflated.<br />
If the higher estimate of black involvement reported in the observational study<br />
(33 percent) is used as the measure (i.e. benchmark) of black involvement in drug<br />
delivery, and this figure is compared with arrest outcomes, the results indicate<br />
that blacks delivering drugs downtown are 13.6 times more likely to be arrested than<br />
105 Insofar as some of those identified as “white” are Hispanic/Latino, this figure may over-state<br />
white representation among downtown drug delivery arrestees.<br />
66
whites engaging in the same behavior in the same geographic area. 106 This calculation<br />
likely understates the actual disparity between black involvement in drug<br />
delivery and black representation among arrestees because the observational<br />
study includes only those who deliver drugs outdoors and because some of the<br />
arrestees classified by SPD officers as white were likely Latino/Hispanic. Still, if<br />
the 33 percent figure is treated as the “benchmark” against which arrest statistics<br />
are compared, very large racial disparities remain after race differences in<br />
involvement in drug delivery are taken into account.<br />
In what follows, the statistical significance of the difference between the share of<br />
downtown deliverers who are black or white and the share of delivery arrestees<br />
who are black or white is evaluated. Tests of statistical significance allow us to<br />
assess whether, for example, the fact that the proportion of arrestees who are<br />
black is greater than the proportion of deliverers who are black may be due to<br />
the fact that we only have samples of these two groups. Social scientists conclude<br />
that an observed difference between two sample proportions is statistically<br />
significant if it is very unlikely to be the result of chance. Conventionally, social<br />
scientists consider a difference between two proportions to be statistically<br />
significant if there is a 5 percent or smaller probability that the observed<br />
difference is the result of chance.<br />
In this case, we are comparing the estimated proportion of observed downtown<br />
deliverers who are black or white with the proportion of purposeful downtown<br />
delivery arrestees who are black or white. 107 To measure the statistical<br />
significance of such differences, researchers calculate a Z score that can be<br />
translated into a probability. 108 Z scores with an absolute value of 2 or more are<br />
106 Whites were 9.3 percent of those arrested, but 49.5 percent of those observed delivering<br />
drugs. Dividing the former by the latter yields a ratio of .187. Conversely, blacks were 85.3<br />
percent of those arrested, but 33.3 percent of those observed delivering drugs, a ratio of 2.56.<br />
The result of dividing 2.56 divided by .187 is 13.6 equals 13.6.<br />
107 Insofar as some Latinos/Hispanics are classified as whites, tests of the statistical significance<br />
of white under-representation among arrestees will be based on an inflated estimate of white<br />
representation among arrestees and are therefore conservative. Conversely, any tests of the<br />
significance of Latino under-representation among arrestees would rest on deflated<br />
estimates of Latino representation among arrestees, and would therefore exaggerate Latino<br />
under-representation. Z scores are therefore not used to test the significance of Latino underrepresented<br />
among arrestees.<br />
108<br />
The Z score for each comparison is calculated according to the following formula:<br />
( ˆ π ˆ<br />
2<br />
−π1)<br />
z =<br />
ˆ<br />
σ π<br />
π<br />
ˆ2 − ˆ1<br />
67
considered statistically significant, and indicate that there is at most a 5 percent<br />
chance of observing a given difference in sample proportions if in fact there is no<br />
difference between the population proportions. Z scores with an absolute value<br />
of 4 or above mean that there is at most a .01 percent chance of observing a given<br />
difference in sample proportions if, in fact, there is no difference between the<br />
population proportions. To be concrete, a .01 percent chance means that the<br />
likelihood that the discrepancy is the result of chance is 1 out of 10,000.<br />
The Z score that measures the significance of the difference between the<br />
proportion of downtown deliverers who are black (according to the<br />
observational study, 33 percent) and the proportion of downtown delivery<br />
arrestees who are black (85 percent) is 9.9 (see Table 15). The Z score measuring<br />
the significance of the difference between percentage of observed downtown<br />
deliverers and downtown delivery arrestees who are black is very highly<br />
statistically significant. In fact, the Z score is so high that the likelihood that this<br />
difference could be due to chance is close to zero. The under-representation of<br />
whites among downtown arrestees is also highly statistically significant and very<br />
unlikely to be the result of chance. 109<br />
Table 15. Statistical Significance of the Difference between the Racial/Ethnic<br />
Composition of Observed Downtown Drug Deliverers and<br />
Downtown Drug Delivery Arrestees<br />
Observed Delivery Difference<br />
Z Score<br />
Deliverers (A) Arrestees (B) (B-A)<br />
Black 33.3% 85.3% +52% 9.9*<br />
White 49.5% 9.3% -40.2% -8.3*<br />
Sources: Nyrop, Demographic Comparisons of Two Public Venue Drug Markets in Seattle;<br />
Seattle Police Department incident reports.<br />
Note: *Indicates a statistically significant disparity (Z>2).<br />
where ˆ π<br />
2<br />
is the black (or white) proportion of arrestees and ˆ π<br />
1<br />
is the black (or white)<br />
proportion of drug deliverers. The standard error shown in the denominator is the pooled<br />
estimate of the two samples (arrestees and sources).<br />
109 It is conceivable that some of the observed drug transactions involved marijuana. In this case,<br />
the percentage of observed drug exchanges involving black drug deliverers should be<br />
compared with the percentage of all purposeful drug delivery arrests, including marijuana<br />
delivery arrests, that involved black suspects. There were an additional 10 purposeful delivery<br />
arrests in census tract 81 that involved only marijuana; three of these arrests involved black<br />
suspects and four involved white suspects. If marijuana arrestees are combined with the 75<br />
suspects arrested for delivery of a serious drug, the results indicate that 78.8 percent of those<br />
arrested in census tract 81 were black and 12.9 percent were white. If Z scores are calculated<br />
using these figures instead, black over-representation and white under-representation among<br />
drug arrestees remains highly significant (Z = 8.2 and -7.2 respectively).<br />
68
Analysis of the patterns found in the Capitol Hill area also indicates that blacks<br />
are over-represented among drug delivery arrestees, although if Capitol Hill<br />
data are analyzed separately the observed differences do not achieve<br />
conventional levels of statistical significance. According to the results of the<br />
second wave of the needle exchange survey, 60 percent of the needle exchangers<br />
who last obtained a serious drug in Capitol Hill got it from a white person, 24.4<br />
percent from a Latino person and only 5.9 percent from a black person. The<br />
observational study found higher levels of white involvement and lower levels of<br />
Latino involvement, but similar (and relatively low) levels of black involvement<br />
in drug delivery. Specifically, the observational study indicates that 83.6 percent<br />
of those delivering drugs in Capitol Hill were white, 9.1 percent were black, and<br />
3.6 percent Hispanic (see Figure 13).<br />
Figure 13. Capitol Hill Deliverers and Delivery Arrestees<br />
100%<br />
80%<br />
60%<br />
40%<br />
20%<br />
Deliverers- Needle<br />
Exchange Survey<br />
Deliverers-<br />
Observational Study<br />
Delivery Arrestees<br />
0%<br />
White Black Latino<br />
Sources: Nyrop, Demographic Comparisons of Two Public Venue Drug Markets in Seattle;<br />
2007-2008 Seattle-King County Needle Exchange Survey, Second Wave; Seattle Police<br />
Department incident reports.<br />
Because it captures information about those who sell crack cocaine to users who<br />
do not also inject drugs, and because it focuses solely on outdoor drug activity,<br />
the observational study yields slightly higher estimates of black involvement in<br />
drug delivery than the needle exchange survey. Comparison of this data source<br />
with arrest outcomes indicates that blacks are also over-represented among<br />
Capitol Hill arrestees (although there were only 10 purposeful delivery arrests in<br />
69
Capitol Hill—e.g. census tracts 74 and 75—during the four-month sampling<br />
period 110 ). 111<br />
Specifically, the results of the observational study indicate that 9.1 percent of the<br />
observed deliverers were black, but 30 percent of the delivery arrestees were<br />
black. Thus, blacks were over-represented by about threefold relative to the black<br />
share of those observed engaging in drug delivery in Capitol Hill. Expressed<br />
differently, this comparison indicates that blacks are 3.9 times more likely to be<br />
arrested for delivery of a serious drug in Capitol Hill than whites engaging in the<br />
same behavior.<br />
Because the number of both transactions and especially arrests are smaller in<br />
Capitol Hill than downtown, the Z scores that measure the significance of this<br />
discrepancy did not achieve conventional levels of statistical significance. 112<br />
However, if we combine observational and arrest data from Capitol Hill and<br />
downtown, the results indicate that blacks are highly significantly overrepresented<br />
among those arrested in these two neighborhoods as compared to<br />
those who were observed delivering drugs in same locales (see Table 16).<br />
110 The results of the observational study indicate that observed drug transactions in the<br />
downtown area (census tract 81) outnumber those in Capitol Hill’s Broadway corridor (census<br />
tracts 74/75) per hour of observation by a ratio of 3.5 to 1. However, delivery arrests in the<br />
downtown area outnumbered drug delivery arrests in the Capitol Hill area by 6.8 to 1. Thus,<br />
there is evidence that the SPD concentrates its drug enforcement resources in the downtown<br />
area, and under-emphasizes the Capitol Hill neighborhood, in a way that is incommensurate<br />
with the distribution of even outdoor drug activity. If indoor drug activity were also considered,<br />
it is likely that this estimate of the over-representation of downtown drug delivery arrests<br />
(relative to the frequency of drug transactions) would likely be even larger: The results of the<br />
second wave of the needle exchange survey suggest that a larger share of the drug activity<br />
that takes place in Capitol Hill occurs indoors. Specifically, 26.7 percent of those who last<br />
obtained a drug in Capitol Hill got it indoors; 15.9 percent of those who last obtained a drug<br />
downtown acquired it indoors.<br />
111 There were no purposeful drug delivery arrests involving marijuana in census tracts 74 and 75<br />
during the four-month sampling period.<br />
112 Z scores are based, in part, on sample size, and reflect the fact that larger sample sizes<br />
ensure greater reliability.<br />
70
Table 16. Statistical Significance of the Difference between the Racial/Ethnic<br />
Composition of Observed Drug Deliverers and Drug Delivery Arrestees<br />
Observed<br />
Deliverers (A)<br />
Delivery<br />
Arrestees (B)<br />
Downtown<br />
Difference<br />
(B-A)<br />
Z Score<br />
Black 33.3% 85.3% +52% 9.9*<br />
White 49.5% 9.3% -40.2% -8.3*<br />
Capitol Hill<br />
Black 9.1% 27.2% 18.1% 1.4<br />
White 83.6% 72.7% -10.9% -1<br />
Downtown and Capitol Hill combined<br />
Black 28.2% 77.9% 49.7% 9.6*<br />
White 57.1% 17.4% -40% -8*<br />
Sources: Nyrop, Demographic Comparisons of Two Public Venue Drug Markets in Seattle;<br />
Seattle Police Department incident reports.<br />
Note: *Indicates a statistically significant disparity (Z>2).<br />
In sum, comparisons of the black share of those observed delivering drugs<br />
downtown and in Capitol Hill indicates that blacks are over-represented among<br />
drug delivery arrestees relative to those who are actually (and visibly) engaging<br />
in drug delivery. Downtown, blacks are more than 13 times more likely to be<br />
arrested than whites engaging in the same behavior; in Capitol Hill, blacks are<br />
nearly four times more likely than whites engaging in the same behavior to be<br />
arrested. The disparity found downtown and in downtown/Capitol Hill<br />
(combined) is highly statistically significant—that is, extremely unlikely to be the<br />
result of chance.<br />
Although the observational study was conducted only downtown and in Capitol<br />
Hill, the second wave of the needle exchange survey also provides information<br />
about drug transactions that occurred in the University District. In the second<br />
wave of the needle exchange survey, needle exchange clients described 70 drug<br />
transactions that took place in the University District. Of these transactions, 22.9<br />
percent involved a black drug deliverer, 65.7 percent involved a white drug<br />
deliverer and 7.1 percent a Latino drug deliverer. By contrast, 71.4 percent of<br />
those purposefully arrested for delivery of a serious drug in the University<br />
71
District were black; only 19 percent were white. This pattern remains consistent<br />
even if we limit our attention to outdoor drug transactions (see Table 17).<br />
Table 17. The Racial/Ethnic Composition of Drug Deliverers and Drug<br />
Delivery Arrestees, University District<br />
Indoor<br />
Deliveries<br />
(n=17)<br />
Vehicle<br />
Deliveries<br />
(n=31)<br />
Outdoor<br />
Deliveries<br />
(n=21)<br />
All<br />
Deliveries<br />
(n=70)<br />
Delivery<br />
Arrestees<br />
(n=20)<br />
Black 11.8% 19.1% 38.1% 22.9% 70%<br />
White 76.5% 71% 47.6% 65.7% 20%<br />
Latino 6.5% 9.7% 4.8% 7.1% 0<br />
Source: 2007–2008 Seattle-King County Needle Exchange Survey, Second Wave; Seattle<br />
Police Department incident reports.<br />
Note: Location type was unidentified in one case.<br />
Z scores measuring the difference between involvement in drug delivery in the<br />
University District and University District delivery arrestees also indicate that<br />
the over-representation of blacks, and under-representation of whites, is highly<br />
statistically significant. Specifically, the Z score that measures black overrepresentation<br />
is 4.1; for white under-representation, it is -4.3. 113 Although it is<br />
possible that the omission of crack cocaine users who do not also inject drugs<br />
from the needle exchange survey results is leading to an underestimate of black<br />
involvement in drug delivery in the University District, needle exchangers who<br />
last obtained a drug in the University District were more likely than those who<br />
last obtained a drug either downtown or in Capitol Hill to report that their last<br />
drug acquisition involved crack cocaine. Specifically, 3.7 percent of those who<br />
last obtained a drug in Capitol Hill, 10.7 percent of those who last obtained a<br />
drug downtown, and 17.1 percent of those who last obtained a drug in the<br />
University District last acquired crack cocaine. Thus, there appears to be less<br />
differentiation between needle exchangers and crack cocaine users among those<br />
obtaining drugs in the University District than is the case in either Capitol Hill or<br />
downtown.<br />
113<br />
There were an additional four purposeful marijuana delivery arrests in census tract 53 during<br />
the four month sampling period. Because arrests are compared with needle exchange survey<br />
information for the University District, and marijuana transactions were omitted from the<br />
analysis of the survey results, it is not necessary to combine marijuana delivery arrests with<br />
delivery arrests involving serious drugs for the University District.<br />
72
In sum, the evidence shows that racial disproportionality in downtown, Capitol<br />
Hill, and University District drug delivery arrests remains even after levels of<br />
involvement in drug delivery are taken into account. Statistical analysis indicates<br />
that the over-representation of blacks among downtown arrestees, downtown<br />
and Capitol Hill arrestees combined, and the University District is highly<br />
statistically significant. Thus, although levels of black involvement in drug<br />
delivery are greater than what would be expected on the basis of general<br />
population statistics, blacks are very significantly over-represented among drug<br />
arrestees relative to those who deliver serious drugs. The following discussion<br />
explores other factors that may explain the over-representation of blacks among<br />
drug delivery arrestees. These include the focus on outdoor (as opposed to<br />
indoor) drug activity, the focus on the downtown area and the focus on those<br />
who deliver crack cocaine.<br />
HYPO<strong>THE</strong>SIS 2: <strong>THE</strong> SPD FOCUS ON OUTDOOR <strong>DRUG</strong> MARKETS EXPLA<strong>IN</strong>S RACIAL<br />
DISPROPORTIONALITY <strong>IN</strong> <strong>DRUG</strong> ARRESTS<br />
It is conceivable that racial disparity in Seattle drug arrests stems principally<br />
from the SPD focus on outdoor drug venues. Some analysts have suggested that<br />
access to private space is differentially distributed across socio-economic (and<br />
hence racial and ethnic) groups; those who engage in illicit conduct in public<br />
places are more visible to the police and therefore more likely to be arrested<br />
(Blumstein 1993; Duster 1997; Goode 2002; Johnson et al. 1977; Sterling 1997;<br />
Tonry 1995). This argument often rests on the assumption that law enforcement’s<br />
proclivity to focus on outdoor drug venues is a (racially neutral) organizational<br />
necessity (but see Duster 1997). Whether law enforcement’s focus on outdoor<br />
drug venues is best understood as a race-neutral state practice is debatable. 114 As<br />
114<br />
Chambliss and Seidman 1971; Goode 2002. In these discussions, law enforcement’s tendency<br />
to focus on outdoor venues is sometimes treated as a racially neutral organizational and/or<br />
legal necessity. This assumption appears to be unwarranted. Although the need to obtain a<br />
search warrant is often cited as an obstacle to indoor narcotics operations, warrants are not<br />
required for entry to commercial establishments. Furthermore, it is not clear that obtaining a<br />
search warrant should be considered an insurmountable barrier, especially in light of the<br />
tremendous effort and resources expended to conduct outdoor narcotics operations—<br />
particularly buy-bust operations—that yield relatively small amounts of drugs. Previously<br />
analyzed evidence from Seattle indicates that each buy-bust arrest yielded an average of .1<br />
grams of drugs and 30 cents (in funds recovered) per officer hour spent on the operation. By<br />
contrast, search warrant arrests yielded an average of 29 grams of drugs and $289 per officer<br />
hour invested (see Beckett 2004; Beckett et al. 2005; Beckett et al. 2006). In short, the police<br />
focus on outdoor venues may be better understood as an organizational and policy choice than<br />
an institutional or legal necessity—one that potentially has important racial consequences.<br />
73
an empirical matter, however, it does not appear that the focus on outdoor drug<br />
venues explains much of the observed racial disparity in Seattle’s arrest<br />
outcomes.<br />
It is clearly the case that the SPD focuses on outdoor drug markets: over threefourths<br />
(78 percent) of the delivery arrests took place outdoors, only 15.6 percent<br />
took place indoors (in either a public or private place) and another 6.4 percent in<br />
occurred in vehicles. Most (70.5 percent) of those arrested outdoors were black.<br />
There is also evidence that blacks are somewhat more likely to deliver drugs<br />
outdoors than indoors. For example, the results of the needle exchange survey<br />
indicate that 9.9 percent of those who provided drugs to needle exchangers<br />
indoors, but 17.7 percent of those who provided drugs to needle exchangers<br />
outdoors, were black. Conversely, 57.5 percent of those who provided narcotics<br />
to needle exchangers indoors, but 48.5 percent of those who provided needle<br />
exchangers with narcotics outdoors, were white. Thus, the evidence indicates<br />
that blacks are more involved in outdoor drug delivery than indoor drug<br />
delivery, and that the SPD concentrates on the former.<br />
However, it is not the case that the racial composition of those arrested indoors<br />
was markedly different than the racial composition of those arrested outdoors.<br />
Indeed, a majority of those arrested indoors (52.3 percent) and in vehicles (61.1<br />
percent) were black. Although the share of outdoor arrestees who were black<br />
was even larger than the black share of indoor and vehicle arrestees, a majority of<br />
those arrested indoors, outdoors, and in vehicles were black. Thus, if the SPD shifted its<br />
focus to indoor drug venues but held all other priorities and practices constant,<br />
the racial composition of Seattle drug delivery arrestees would change somewhat<br />
(from 70 to 52 percent black), but significant racial disparity would remain.<br />
Specifically, if we assume that the racial composition of those arrested indoors<br />
was the racial composition of all drug arrestees, the black serious drug delivery<br />
arrest rate would still be more than 16 times higher than the white serious drug<br />
delivery arrest rate. Thus, while the SPD’s focus on outdoor markets exacerbates<br />
racial disparity in drug arrests, it is not a fundamental cause of that disparity.<br />
HYPO<strong>THE</strong>SIS 3: RACIAL DISPROPORTIONALITY <strong>IN</strong> <strong>DRUG</strong> ARRESTS STEMS<br />
FROM CONCENTRATION <strong>OF</strong> <strong>DRUG</strong> LAW <strong>ENFORCEMENT</strong> RESOURCES DOWNTOWN<br />
It is conceivable that racially disparate arrest outcomes are a function of the<br />
concentration of drug law enforcement resources downtown. Specifically, it<br />
might be argued that the concentration of drug law enforcement resources<br />
downtown leads to racial disparity in drug arrests if a significant majority of<br />
74
those delivering drugs downtown were black, and blacks were less likely to<br />
deliver drugs in other parts of the city. Yet the evidence provided in the<br />
discussion of Hypothesis 1 is also inconsistent with this hypothesis. Although 12<br />
percent of needle exchange clients surveyed who last obtained a serious drug<br />
downtown identified the deliverer of that drug as black, and 33 percent of those<br />
observed exchanging drugs downtown were black, over 85 percent of those<br />
arrested for drug delivery downtown were black. As was discussed previously,<br />
this disparity is highly statistically significant. The evidence thus strongly<br />
indicates the racial composition of those arrested downtown is primarily not a<br />
function of the racial composition of those who deliver drugs in that area.<br />
In addition, there is no reason to suspect that racial disparity in drug arrests<br />
would decrease simply if drug arrests were less geographically concentrated in<br />
the downtown area. That is, if all other practices and priorities were held<br />
constant, and drug delivery arrests took place only in the four precincts other<br />
than the West Precinct, we could expect that 61.3 percent of those arrested for<br />
delivering serious drugs would be black. In this scenario, the black-to-white drug<br />
arrest rate ratio drops only moderately, from 21 to 17. Similarly, if all other<br />
practices and priorities were held constant and the racial composition of Seattle<br />
drug delivery arrestees mirrored that in all census tracts other than census tract<br />
81, the percentage of arrestees who are black drops only to 60.4 percent and the<br />
black-to-white drug arrest rate ratio drops only to 18.7. Thus, it does not appear<br />
that the focus on the downtown area is a fundamental cause of racial disparity in<br />
Seattle narcotics delivery arrests.<br />
In sum, the evidence supports two conclusions. First, blacks are significantly<br />
over-represented among those arrested downtown as compared with those who<br />
deliver serious drugs in that area. Second, if drug law enforcement resources<br />
were reallocated such that no drug arrests took place in the West Precinct or<br />
census tract 81, but all other practices and priorities remained unchanged, racial<br />
disproportionality would be reduced only slightly. The evidence thus indicates<br />
that the focus on the downtown area exacerbates racial disproportionality in<br />
Seattle drug delivery arrests, but is not the primary cause of that disparity.<br />
HYPO<strong>THE</strong>SIS 4: <strong>THE</strong> FOCUS ON CRACK COCA<strong>IN</strong>E EXPLA<strong>IN</strong>S RACIAL DISPROPORTIONALITY <strong>IN</strong><br />
SEATTLE <strong>DRUG</strong> ARRESTS<br />
A final hypothesis suggests that the SPD’s focus on crack cocaine is an important<br />
cause of racial disparity in drug delivery arrests. It is not possible to determine<br />
with certainty whether the over-representation of blacks among drug delivery<br />
75
arrestees is a consequence of law enforcement’s focus on crack cocaine, or<br />
whether a focus on black suspects leads to over-representation of crack<br />
cocaine. 115<br />
There is some evidence of a general focus on those who deliver crack cocaine. In<br />
particular, 55.6 percent of the white delivery arrestees, and 62.5 percent of the<br />
Hispanic/Latino delivery arrestees, were arrested for delivering crack cocaine.<br />
These findings are unexpected given evidence (reviewed in Part I of the report)<br />
that whites are more likely to be identified as users and deliverers of heroin,<br />
powder cocaine, ecstasy and methamphetamine than of crack cocaine. In light of<br />
this surprising finding, and in order to be as comprehensive as possible, the<br />
following discussion assumes that the SPD focuses on deliverers of crack cocaine,<br />
and therefore disproportionately arrests blacks, rather than vice versa.<br />
The evidence presented in Part I of this report indicated that the majority of those<br />
who use and deliver all serious drugs except possibly crack cocaine are white.<br />
Although data regarding the racial composition of those who deliver crack<br />
cocaine is limited, the results of the needle exchange survey indicate that 49.4<br />
percent of those who recently obtained crack cocaine got it from a black<br />
deliverer, 20 percent from a Latino deliverer, and 17.6 percent from a white<br />
deliverer. As previously noted, these data are based on the reports of injection<br />
drug users who, as a group, predominantly use heroin and powder cocaine.<br />
Insofar as the majority of the users of these substances are whites who typically<br />
obtain those substances from white or Latino dealers, the needle exchange<br />
survey results may under-estimate the involvement of blacks in the delivery of<br />
crack cocaine to persons who use crack cocaine but do not also inject drugs. To<br />
the extent that this is the case, the needle exchange survey results underestimate<br />
black involvement in the delivery of crack. This implies that more than half of<br />
those who deliver crack cocaine in Seattle are black (although blacks may be<br />
over-represented among those arrested for delivery of crack cocaine). It thus<br />
appears that the SPD is concentrating its attention on the one serious drug that is<br />
most likely to be used and delivered by blacks—crack cocaine.<br />
Blacks comprise a much larger share of those arrested for delivery of crack<br />
cocaine than any other drug. Over three-quarters of those purposefully arrested<br />
115<br />
Although statistical regression methods allow researchers to assess the degree to which two<br />
or more variables are correlated, such techniques cannot identify whether two or more<br />
correlated variables are causally related; even if a causal relationship between two variables<br />
exists, these techniques do not identify which of two correlated variables is the cause of the<br />
correlation.<br />
76
for delivering a serious drug in Seattle were arrested for delivering crack cocaine,<br />
and roughly the same proportion of those arrested for delivering crack cocaine<br />
were black. Comparing the racial composition of those arrested for crack cocaine<br />
alone or crack cocaine in combination with that of those arrested for all other<br />
serious drugs (heroin, powder cocaine, ecstasy, methamphetamine, ecstasy<br />
and/or prescription drugs) indicates that the focus on crack cocaine is a<br />
fundamental cause of racial disparity in drug arrests. Specifically, these figures<br />
indicate that if the SPD were to stop arresting people for delivering crack<br />
cocaine, but keep all other priorities and practices constant, the racial<br />
composition of those arrested for delivering serious drugs in Seattle would be<br />
significantly altered. In this hypothetical scenario, the share of all purposeful<br />
delivery arrests involving a serious drug that involved black suspects drops<br />
sharply, from 67 percent to 19.4 percent (see Figure 14).<br />
Figure 14. Percentage of Purposeful Seattle Drug Delivery<br />
Arrests Involving Blacks, 2005-2006<br />
80%<br />
60%<br />
40%<br />
20%<br />
0%<br />
Crack Cocaine No Crack Cocaine All Arrests<br />
Source: Seattle Police Department incident reports.<br />
Note: The “no crack cocaine” category includes those arrested for powder cocaine,<br />
methamphetamine, ecstasy, heroin, prescription drugs or any combination of these. It does<br />
not include those arrested for crack cocaine, multiple drugs including crack cocaine,<br />
unspecified cocaine or unspecified drug (which may be crack cocaine).<br />
77
As shown in Figure 15, the impact of the focus on crack cocaine is far greater<br />
than the impact of the focus on the downtown market or outdoor markets<br />
generally (see Figure 15).<br />
Figure 15. Percentage of Purposeful Delivery Arrests<br />
Involving Black Suspects by Arrest Type, 2005-2006<br />
90%<br />
80%<br />
70%<br />
60%<br />
50%<br />
40%<br />
30%<br />
20%<br />
10%<br />
0%<br />
Outdoor Indoor Downtown Not<br />
Downtown<br />
Crack<br />
Cocaine<br />
No Crack<br />
Cocaine<br />
Source: Seattle Police Department incident reports.<br />
As shown above, the only hypothetical scenario in which the black share of<br />
delivery arrestees diminishes sharply is the “no crack cocaine arrests” scenario.<br />
This counterfactual analysis thus indicates that the SPD’s focus on crack cocaine<br />
is the fundamental cause of racial disparity in arrest outcomes. Based on these<br />
figures, we can calculate that, holding all other practices and priorities constant,<br />
the black to white drug arrest ratio would drop from 21 to 2.8 were the SPD to<br />
cease making arrests for delivery of crack cocaine. That is, rather than being 21<br />
times higher than the white drug delivery arrest rate, the black drug delivery<br />
arrest rate would be 2.8 times higher than the white drug delivery arrest rate.<br />
The evidence thus indicates that the SPD’s concentration on crack cocaine<br />
deliverers is a fundamental cause of racial disparity in drug arrests.<br />
Of all the serious drugs considered in this report, crack cocaine is the one that is<br />
most strongly associated with blacks. This association is grounded in empirical<br />
evidence, which, as seen in Part I of this report, shows that a larger share of those<br />
who use and deliver crack cocaine are black than is the case for any other serious<br />
drug. It is also the case that crack cocaine has been linked not just to blacks, but<br />
78
to danger, instantaneous addiction and violence in popular and media imagery.<br />
Studies of media representations of crack cocaine suggest that these images have<br />
been highly racialized and linked to danger. 116 For example, Jimmie L. Reeves<br />
and Richard Campbell (1994) showed that the media imagery surrounding<br />
cocaine changed as the practice of smoking cocaine spread to the poor and<br />
nonwhite. Early in the 1980s, they suggest, the typical cocaine-related story<br />
focused on white recreational users who snorted the drug in its powder form,<br />
relied on news sources associated with the drug treatment industry and<br />
emphasized the possibility of recovery. By late 1985, however, this theme was<br />
supplanted by a new "siege paradigm” in which transgressors were poor,<br />
nonwhite and often violent users and dealers of crack cocaine, while law<br />
enforcement officials emphasizing the need for law-and-order responses to the<br />
drug problem replaced treatment specialists in the role of drug “experts.”<br />
There is abundant evidence that many of the images, associations and claims<br />
made about crack cocaine in the popular media in the 1980s and 1990s were false<br />
or misleading. For example, media claims about the addictiveness of crack<br />
cocaine were clearly exaggerated: in fact, many crack cocaine users are not<br />
instantly or inevitably addicted. 117 Similarly, as is discussed below, the adverse<br />
health consequences associated with crack cocaine use have been exaggerated,<br />
and there no longer appears to be a particular association between the crack<br />
cocaine market and violence. 118 These misrepresentations notwithstanding, drug<br />
policies and enforcement practices may be influenced by the cultural<br />
construction and racial coding of drugs. That is, ostensibly race-neutral practices<br />
(such as sentencing policies that treat users of crack cocaine more harshly than<br />
users of powder cocaine) may reflect the association of certain substances or<br />
modes of ingestion with racially or ethnically stigmatized groups rather than<br />
objective criteria. 119 To the extent that the focus on crack cocaine is not a function<br />
of race-neutral considerations, confidence in this conclusion is bolstered. Below,<br />
various race-neutral explanations for the focus on this particular substance are<br />
considered.<br />
116 Beckett 1995; Beckett and Sasson 1998; Reeves and Campbell 1994; Reinarman and Levine<br />
1997.<br />
117<br />
Morgan and Zimmer 1997; Reinarman et al. 1997; Reinarman and Levine, 1995; Reinarman,<br />
Murphy and Waldorf, 1994; Waldorf, Murphy and Reinarman, 1991.<br />
118<br />
See also U.S. Sentencing Commission 2007.<br />
119 Beckett 1997; Duster 1997; Manderson 1997; Musto 1973; Reinarman and Levine 1997;<br />
Steiner 2001; Tonry 1995.<br />
79
HYPO<strong>THE</strong>SIS 4A: <strong>THE</strong> FOCUS ON CRACK COCA<strong>IN</strong>E IS A FUNCTION <strong>OF</strong> <strong>THE</strong> FREQUENCY WITH<br />
WHICH CRACK COCA<strong>IN</strong>E IS EXCHANGED<br />
Some observers have suggested that tends to be exchanged more frequently than<br />
other drugs, and that, as a result, crack cocaine users and dealers are at greater<br />
risk of arrest than those who use and deliver other illegal substances. 120<br />
Evaluating this hypothesis requires taking two things into account: the number<br />
of users of each serious drug (which primarily include heroin, powder cocaine,<br />
ecstasy, methamphetamine, crack cocaine and prescription drugs when used<br />
without a prescription) and the frequency with which each drug is exchanged.<br />
Unfortunately, no reliable estimates of the number of Seattle residents who<br />
primarily use each serious drug, including crack cocaine, exist. However,<br />
SAMHSA survey data provide reasonably reliable information about drug use<br />
among the stably housed, while the TARGET treatment admission data and<br />
needle exchange survey results provide some information regarding the drugs<br />
abused by lower income Seattle residents.<br />
As was discussed in Part I, the results of the SAMHSA Survey on Drug Use and<br />
Health indicate that powder cocaine and ecstasy are most widely used by Seattle<br />
residents. Specifically, 5.1 percent of all Seattle residents reported using ecstasy<br />
in the past month, and another 3.4 percent reported using powder cocaine. If<br />
these numbers are extrapolated to the Seattle population, the results indicate that<br />
over 26,000 Seattle residents recently used (and obtained) ecstasy, and 170,000<br />
recently used (and obtained) powder cocaine, at least once in the previous<br />
month. Unfortunately, these surveys provide less reliable figures for other, more<br />
stigmatized drugs, partially because they depend upon self-reporting and<br />
partially because they tend to miss the unstably housed and homeless.<br />
To some extent, these gaps can be filled by TARGET treatment admission data,<br />
which provide information about the substances primarily abused by lowincome<br />
Seattle residents admitted to public drug treatment programs. According<br />
to these data, 39 percent of those admitted to public drug treatment programs in<br />
2005–2007 primarily abused cocaine of an unspecified form, 34.8 percent<br />
primarily abused heroin, 16.6 percent primarily abused methamphetamine and<br />
120<br />
See Riley 1997; Sterling 1997. The conjecture that crack is exchanged more frequently than<br />
other serious drugs is based on the idea that since crack is metabolized relatively quickly,<br />
users of it will need/wish to obtain the drug relatively frequently. Although this idea is<br />
intuitively plausible, it ignores the fact that most long-term crack users tend to “binge” rather<br />
than use crack constantly (Reinarman et al. 1997). It also ignores evidence that heroin users<br />
report making more frequent purchases than crack users in some locales, including Seattle.<br />
80
9.6 percent primarily abused other serious drugs. Because the cocaine category in<br />
the 2005–2007 data includes all forms and modes of administration (e.g. smoked,<br />
injected and inhaled cocaine), the proportion of persons admitted to public<br />
treatment programs that primarily abused crack cocaine for that time period<br />
cannot be determined. However, data regarding mode of administration among<br />
Seattle residents who abused cocaine and were admitted to public treatment<br />
programs in the year 2000 121 indicate that 57.3 percent of those who primarily<br />
abused cocaine and were admitted to public treatment programs primarily<br />
abused smoked cocaine (i.e. crack cocaine); the remainder either injected or<br />
inhaled their cocaine. 122<br />
Using this figure, we can estimate that 57.3 percent of those admitted to a public<br />
treatment program who primarily abused cocaine abused crack cocaine. If this<br />
figure is applied to current treatment admission data, the results indicate that a<br />
plurality (34.8 percent) of the Seattle residents admitted to public drug treatment<br />
programs primarily abused heroin, 22.4 percent primarily abused crack cocaine<br />
(i.e. smoked cocaine), 16.7 percent primarily abused injected or inhaled cocaine,<br />
16.6 percent primarily abused methamphetamine and 9.6 percent primarily<br />
abused another unidentified serious drug (see Figure 16).<br />
40%<br />
Figure 16. Seattle Treatment Admissions by Primary<br />
Drug of Abuse, 2005-2007<br />
30%<br />
20%<br />
10%<br />
Heroin<br />
Smoked cocaine<br />
Other cocaine<br />
Methamphetamine<br />
Other Serious Drug<br />
0%<br />
Sources: 2005–2007 TARGET data provided by Caleb-Banta, Research Scientist, Alcohol and<br />
Drug Abuse Institute, University of Washington. Data regarding route of administration were<br />
provided by Fritz Wrede, Division of Alcohol and Drug Abuse of Washington’s Department of<br />
Social and Health Services.<br />
121<br />
Mode-of-administration data are for the year 2000 and were provided by Fritz Wrede, Division<br />
of Alcohol and Drug Abuse of Washington’s Department of Social and Health Services.<br />
122<br />
Of the remainder, 30 percent injected cocaine and 12 percent inhaled it.<br />
81
In short, even if we limit our attention to more serious and low-income drug<br />
abusers, and ignore recreational (and mostly white) users such as the 26,000<br />
Seattle residents who report recently using ecstasy, it appears that crack cocaine<br />
is the drug of choice among less than one-fourth of Seattle’s poor drug abusers. A<br />
larger proportion—about one-third—of those admitted to public treatment<br />
programs primarily abused heroin.<br />
Still, if it were true that crack cocaine users made far more frequent purchases<br />
than users of other serious drugs, this might mean that a majority of Seattle drug<br />
transactions involve crack cocaine. However, the evidence does not support this<br />
conjecture. According to the best available data, crack cocaine users do make<br />
more frequent monthly purchases than methamphetamine and powder cocaine<br />
users, but fewer average monthly purchases than heroin users. Specifically,<br />
ADAM survey data indicate that powder cocaine users typically made 4<br />
purchases of that substance per month, methamphetamine users made 3<br />
purchases per month, crack cocaine users made 15 monthly purchases and<br />
heroin users made 20.5 purchases per month. 123<br />
In sum, the best available data indicate that recreational users of powder cocaine<br />
and ecstasy significantly outnumber more serious abusers of heroin, crack<br />
cocaine and other serious drugs. Even if we focus solely on low-income drug<br />
abusers, treatment admission data indicate that there are more heroin abusers<br />
than crack cocaine abusers in Seattle. The evidence also indicates that those who<br />
use heroin make more frequent purchases than those who use crack cocaine.<br />
When combined with the fact that there are also many recreational users and<br />
abusers of ecstasy, powder cocaine, methamphetamine and prescription drugs, it<br />
becomes clear that a significant majority of the serious drug transactions that<br />
take place in Seattle involve a drug other than crack cocaine. Thus, it does not<br />
appear that the frequency with which crack cocaine is exchanged explains the<br />
preponderance of crack cocaine delivery arrests.<br />
Moreover, the analysis of the downtown market casts doubt on the frequency<br />
hypothesis. Recall that the needle exchange survey results indicate that 12<br />
123 Data regarding the number of past-month acquisitions and location of last drug transaction<br />
are based on the results of ADAM surveys with King County respondents arrested by the SPD<br />
between January 2000 and September 2001. (Ad-hoc analysis of Seattle ADAM data by Joe<br />
Kabel, Ph.D., Seattle ADAM Site Director, Looking Glass Analytics, and Michael Gilson, Ph.D.,<br />
Research Analyst, Looking Glass Analytics). The median number of past month acquisitions is<br />
presented in the text above. Unfortunately, Seattle-King County is no longer included in the<br />
ADAM survey so these figures cannot be updated.<br />
82
percent of those delivering drugs downtown to needle exchangers were black,<br />
but the observational study indicates that one-third of those delivering drugs<br />
downtown were black. As was discussed previously, this difference likely<br />
reflects the fact that the observational study captures information about those<br />
who sell crack cocaine to users who do not inject drugs and are therefore left out<br />
of the needle exchange survey (and the fact that the observational study omits<br />
those who deliver drugs indoors). The unit of analysis in the observational study<br />
is a drug transaction, not individuals who deliver drugs. If crack cocaine sellers<br />
were delivering that substance more frequently than people who deliver heroin,<br />
this difference would be captured by the results of the observational study. That<br />
is, insofar as the observational study treats transactions as the unit of analysis<br />
and captures crack cocaine deliverers who deliver to non-injection drug users,<br />
the results “control for” the frequency with which crack cocaine is exchanged<br />
downtown. Although 33 percent of the observed downtown drug deliveries<br />
involved black deliverers, the vast majority of downtown delivery arrests (85.3<br />
percent) involved black suspects, 80 percent of whom were arrested for selling<br />
crack cocaine.<br />
In addition to this lack of empirical support, there is another potential problem<br />
with the hypothesis that crack cocaine is disproportionately represented among<br />
arrests because crack cocaine users tend to make comparatively frequent<br />
purchases. This hypothesis assumes that arrests result from police observations<br />
and on-the-spot detection. Yet the majority (52.1 percent) of the purposeful<br />
delivery arrests resulted from a buy-bust operation, where the crime is initiated<br />
by a law enforcement officer; only 23.8 percent were the result of purposeful<br />
observation (i.e. see-pop). A buy-bust arrest is the product of a single drug<br />
transaction rather than observations of a single seller making repeated<br />
transactions. To the extent that officers do not target particular individuals based<br />
on prior observations of involvement in drug activity, there is no necessary<br />
connection between the frequency with which any particular substance is<br />
exchanged and the nature of the drug requested in a buy-bust operation.<br />
In sum, the evidence indicates that most users of serious drugs in Seattle use a<br />
drug other than crack cocaine, and that heroin users tend to make more frequent<br />
purchases than crack cocaine users. In addition, the observational study captures<br />
information about the frequency with which all drugs, including crack cocaine,<br />
are exchanged; even when this information is included, blacks are significantly<br />
over-represented among downtown delivery arrestees. In short, the evidence<br />
indicates that the frequency with which crack cocaine is exchanged does not<br />
explain the over-representation of blacks among drug delivery arrestees.<br />
83
HYPO<strong>THE</strong>SIS 4B: <strong>THE</strong> FOCUS ON CRACK COCA<strong>IN</strong>E REFLECTS RESIDENT COMPLA<strong>IN</strong>TS ABOUT<br />
NARCOTICS ACTIVITY<br />
When asked to explain drug law enforcement patterns in Seattle, police and city<br />
officials have suggested that SPD deployment decisions are driven primarily by<br />
public complaints. 124 Civilians may register complaints regarding drug activity in<br />
two ways. First, a civilian complaint regarding narcotics activity is sometimes<br />
recorded by SPD personnel as a “Narcotics Activity Report” (NAR).<br />
Alternatively, civilians may call 9-1-1 to report perceived and ongoing drug<br />
activity. In the previous analysis of civilian complaints about drug activity, 125<br />
only NARs were made available by the Seattle Police Department for analysis.<br />
For the 2005–2006 time period, however, both NARs and civilian 9-1-1 calls<br />
initially coded as narcotics-related by the 9-1-1 dispatcher received in April and<br />
May 2005 and May 2006 were made available for analysis.<br />
It is important to note at the outset that civilian reports of drug activity may or<br />
not be accurate. Indeed, civilian complaints registered via 9-1-1 calls were not<br />
infrequently determined by police officers to have been incorrect and/or<br />
unreliable. For example, some 9-1-1 callers reported what they perceived to be a<br />
large group of black teenagers smoking crack cocaine; when the police arrived,<br />
they found instead a few youths, some of whom were smoking cigarettes (see<br />
Appendix B for this and other examples of unreliable civilian reports of drug<br />
activity). 126 Because officers are often unable to locate suspects upon arrival, and<br />
because this failure to locate suspects may or may not mean that the call was<br />
unreliable, it is not possible to determine the relative frequency of accurate and<br />
inaccurate reports. 127 Nonetheless, it is noteworthy that officers responding to 9-<br />
1-1 calls about perceived narcotics activity typically responded in a timely<br />
fashion: the average (mean) number of minutes lapsed between the time the call<br />
was received by 9-1-1 dispatchers and the time officers arrived on the scene was<br />
less than 26; officers arrived at the scene within 15 minutes half of the time. Still,<br />
124 See Klement and Siggins 2001: 26; Deposition of Robert Scales in State of Washington v.<br />
Richard Nelson, March 12, 2008, at p. 185; on file with author.<br />
125<br />
Beckett 2004.<br />
126 An emerging body of research suggests that racial stereotypes shape perceptions of the<br />
seriousness and/or dangerousness of potentially crime-related situations, particularly when<br />
information about those situations is limited (Quillian and Pager 2001; Sampson and<br />
Raudenbush 2004).<br />
127 Although officers may enter a disposition code that signifies the determination that the call<br />
was unfounded, officers do not always clear the call with this code even when they indicate in<br />
their response to dispatcher that the call was unreliable, unfounded or “bogus.” It is therefore<br />
not possible to count the number of unfounded or false complaints.<br />
84
officers made a drug arrest, issued a narcotics warrant or recovered narcotics in<br />
only 4 percent of their responses to civilian complaints about perceived drug<br />
activity. 128<br />
Setting aside concerns about the accuracy of civilian complaints, it is conceivable<br />
that the disproportionate representation of crack cocaine deliverers among<br />
Seattle delivery arrestees is a function of civilian complaints about perceived<br />
drug activity. One variant of this hypothesis suggests that the majority of<br />
complainants who call 9-1-1 about drug activity identify the problematic drug as<br />
crack cocaine, and in responding to these calls, officers disproportionately locate<br />
and arrest suspected crack cocaine deliverers. The evidence does not support this<br />
idea, for several reasons. First, the evidence indicates that there is very little<br />
geographic correspondence between civilian complaints about drug activity and<br />
purposeful drug delivery arrests involving serious drugs. This is true for both<br />
NARs and civilian 9-1-1 calls. The perceived drug activity identified in the 334<br />
complaints memorialized in NARs by the SPD in April and May of 2005 and<br />
2006 was dispersed throughout the city, with the North Precinct registering the<br />
largest share of NAR complaints. Only 21 percent of the NARs identified<br />
problematic drug activity in the West Precinct (see Figure 17).<br />
Yet, as noted previously, 57.7 percent of all purposeful drug delivery arrests took<br />
place in the West Precinct. Similarly, 5.1 percent of the NARs, but 26.3 percent of<br />
the delivery arrests, reflected drug activity occurring in census tract 81. Thus, the<br />
location of the drug activity described in the majority of NARs shows little<br />
correspondence to arrest patterns. Similarly, the geographic distribution of 9-1-1<br />
calls shows little relationship to the geographic distribution of arrests. During the<br />
four month sampling period, civilians made 2,240 9-1-1 calls that were classified<br />
by dispatchers as narcotics-related. 129 Like the NARs, 9-1-1 complaints about<br />
narcotics activity were fairly dispersed throughout the city, with the largest<br />
shares found in the East Precinct (32.4 percent), West Precinct (30.5 percent) and<br />
North Precinct (19.7 percent) (see Figure 18).<br />
128 These figures are based on the number of civilian complaints classified by dispatchers as<br />
narcotics related that were cleared with MIR and disposition codes indicating that one of these<br />
three things occurred.<br />
129<br />
The CAD data provided by the SPD also include entries from SPD officers; only civilian calls<br />
are included in this analysis. Census tract was derived through a geo-coding process on the<br />
basis of the incident location identified by callers. Precinct was derived on the basis of<br />
reported beat or, when beat was unidentified or visibly incorrect, on the basis of the incident<br />
address. Both NARs and 9-1-1 calls are sometimes repeat complaints.<br />
85
Figure 17. Geographic Distribution of Narcotics Activity Reports, 2005–2006<br />
Source: Seattle Police Department Narcotics Activity Reports.<br />
86
Figure 18. Geographic Distribution of Civilian Narcotics 9-1-1 Calls<br />
Source: Seattle Police Department CAD Database.<br />
87
Comparison of the 9-1-1 calls and arrest outcomes shows little congruence<br />
between the two. Specifically, civilian 9-1-1 callers who complained about drug<br />
activity located that activity in the West Precinct 30.4 percent of the time. By<br />
contrast, 57.7 percent of the purposeful delivery arrests occurred in that precinct.<br />
Similarly, 5.9 percent of the 9-1-1 callers complained about perceived drug<br />
activity in census tract 81, but 26.3 percent of the arrests took place in that census<br />
tract. As Figure 19 shows, the East Precinct, South Precinct and Southwest<br />
Precinct were the site of fewer purposeful delivery arrests than would be<br />
expected on the basis of NARs and 9-1-1 calls. By contrast, the West Precinct and<br />
census tract 81 were the site of far more delivery arrests than would be predicted<br />
on the basis of civilian complaints about drugs (see Figure 19).<br />
60%<br />
Figure 19. Geographic Distribution of Civilian Complaints about<br />
Drug Activity and Drug Delivery Arrests, April and May<br />
2005–2006<br />
50%<br />
40%<br />
30%<br />
20%<br />
10%<br />
NARs<br />
9-1-1 Calls<br />
Delivery Arrests<br />
0%<br />
East<br />
Precinct<br />
North<br />
Precinct<br />
South<br />
Precinct<br />
SW<br />
Precinct<br />
West<br />
Precinct<br />
Census<br />
Tract 81<br />
Source: Seattle Police Department Narcotics Activity Reports, CAD data and incident reports.<br />
This lack of congruence becomes even more evident if NARs and 9-1-1 calls are<br />
combined (see Figures 20 and 21).<br />
88
Figure 20. Geographic Distribution of Civilian Drug Complaints<br />
Source: Seattle Police Department Narcotics Activity Reports and CAD Data<br />
89
Figure 21. Geographic Distribution of Seattle Drug Delivery Arrests<br />
Source: Seattle Police Department Incident Reports.<br />
90
As these maps illustrate, civilian complaints about perceived narcotics activity<br />
are far less concentrated in the downtown area than are purposeful drug<br />
delivery arrests. In fact, the difference between the proportion of complaints and<br />
proportion of arrests located in the West Precinct and in census tract 81 is highly<br />
statistically significant (Z scores equal 9.3 and 7.8 respectively). In short, the<br />
SPD’s disproportionate focus on the downtown area appears not to reflect<br />
civilian complaints about perceived drug activity as measured by NARs or<br />
civilian narcotics-related 9-1-1 calls. Moreover, only 4 percent of all 9-1-1 calls<br />
regarding suspected narcotics activity result in a narcotics arrest, warrant service<br />
or recovered narcotics. Similarly, analysis of the arrest records indicates that very<br />
few of the purposeful delivery arrests involved a civilian complainant: 96.5<br />
percent of all SPD arrests did not involve a civilian complainant. Thus, the<br />
evidence indicates that most arrests, and crack cocaine arrests in particular, are<br />
not the result of a police response to civilian complainants who, when<br />
complaining about drug activity, ostensibly complain about crack cocaine.<br />
An alternative version of the complaint hypothesis suggests merely that the<br />
SPD’s apparent concern about crack cocaine is generally shared by those who<br />
complain about drug activity. This proposition is difficult to assess empirically. It<br />
is true that when civilian callers identify the drug they believe is being used or<br />
sold they most commonly identify the substance in question as crack cocaine.<br />
Specifically, civilians who complained about perceived drug activity taking place<br />
in Seattle during the four-month sampling period via 9-1-1 made 684<br />
identifications of illicit substances. 130 Of these drug “mentions,” 53.1 percent<br />
identified crack or rock cocaine. However, no specific drug is identified in the<br />
majority (68.8 percent) of civilian 9-1-1 calls about perceived drug activity or<br />
NARs (see Table 18).<br />
Table 18. Comparison of Civilian Narcotics<br />
Complaints and Drug Delivery Arrests<br />
NARs<br />
(n=334)<br />
911 calls<br />
(n=2,242)<br />
911+NARs<br />
(n=2,576)<br />
Arrests<br />
(n=282)<br />
Crack Cocaine 20.2% 16.2% 16.7% 74.1%<br />
Drug Unknown 50.6% 68.8% 67.5% 4.7%<br />
Sources: Seattle Police Department Narcotics Activity Reports, CAD Database and incident<br />
reports.<br />
Note: Complaints are included in crack cocaine category even if crack cocaine was just one of<br />
the drugs mentioned.<br />
130<br />
In some cases, civilian complainants identified more than one illicit substance.<br />
91
Given the lack of information about the drug involved in the majority of civilian<br />
complaints about perceived narcotics activity, it is not possible to determine if<br />
the preponderance of crack cocaine among drug arrestees mirrors resident<br />
concern. 131 The fact that some civilian complainants make inaccurate reports<br />
when they do identify a drug (see Appendix B) renders this issue even more<br />
opaque.<br />
In sum, the evidence indicates there is little correspondence between the<br />
geographic distribution of civilian complaints about drug activity and<br />
purposeful drug delivery arrests. Moreover, most (96 percent) civilian<br />
complaints about suspected narcotics activity do not trigger an arrest or warrant<br />
or lead to recovered narcotics, and over 95 percent of all arrests do not involve a<br />
civilian complainant. Thus, the evidence does not support the hypothesis that<br />
crack cocaine arrestees significantly outnumber other serious drug arrestees<br />
because in the course of responding to civilian complaints police officers<br />
overwhelmingly locate crack cocaine. The evidence needed to assess a softer<br />
version of this hypothesis——that the SPD’s apparent concern about the crack<br />
cocaine market mirrors greater concern among civilian complainants about crack<br />
cocaine—is not available, as most civilian complainants do not identify the drug<br />
they believe to be involved in the perceived drug activity, and there is reason to<br />
doubt the accuracy of their reports when they do. Moreover, the nature of the<br />
drug activity identified by civilian complainants is similarly unavailable to SPD,<br />
and thus cannot be a basis for deployment decisions.<br />
HYPO<strong>THE</strong>SIS 4C: <strong>THE</strong> FOCUS ON CRACK COCA<strong>IN</strong>E REFLECTS PUBLIC HEALTH CONSIDERATIONS<br />
An alternative explanation for law enforcement’s focus on crack cocaine<br />
emphasizes the adverse health consequences of that particular substance. While<br />
such adverse effects surely exist, the evidence from the Seattle area indicates that<br />
the extent of the focus on crack cocaine is difficult to justify in public health<br />
terms. As is well known among social scientists and public health professionals,<br />
early claims regarding crack cocaine’s propensity to cause addiction were<br />
exaggerated. 132 For example, the vast majority of those who try crack cocaine do<br />
not go on to be regular users of crack cocaine. 133 Similarly, the harm posed to fetal<br />
131<br />
Moreover, there is reason to suspect that cigarettes are sometimes mistaken for crack (see<br />
Appendix B).<br />
132<br />
See Morgan and Zimmer 1997; Reinarman and Levine 1997; Waldorf, Murphy and Reinarman<br />
1991.<br />
133<br />
Morgan and Zimmer 1997: 143-4.<br />
92
and infant health by crack cocaine use has been exaggerated. 134 Specifically,<br />
researchers have found that more than two-thirds of crack-exposed infants suffer<br />
no adverse consequences at birth, and that both prenatal and postnatal<br />
interventions may prevent or ameliorate developmental problems for those<br />
infants who are harmed as a result of their prenatal exposure to drugs. 135<br />
Although efforts to reduce drug use among pregnant women are clearly<br />
warranted, there is no reason to single out those who use crack cocaine versus<br />
those who use other potentially dangerous substances such as heroin,<br />
methamphetamine, tobacco or alcohol. 136<br />
Similarly, mortality data indicate that drug-related deaths are relatively common<br />
in the Seattle-King County area, but that crack cocaine is not the main cause of<br />
this problem. According to the Centers for Disease Control, an estimated 10.2 of<br />
every 100,000 U.S. residents died of an unintentional drug overdose in 2005. 137 In<br />
King County, however, the estimated drug-involved mortality rate for that year<br />
was 13.4, and rose to 15.1 in 2006. 138 As is the case across the nation and the state,<br />
the primary cause of the increase in drug-involved deaths in King County is the<br />
growing use and abuse of prescription opiates. 139 Of the illicit drugs detected in<br />
drug-related deaths involving King County residents, 54.8 percent were opiates,<br />
27.6 percent were derivatives of cocaine, 13 percent were sedatives and 4 percent<br />
were amphetamines. 140<br />
Data pertaining to drug-related deaths among Seattle residents also only indicate<br />
that opiates are most strongly linked to drug-related deaths. The figures shown<br />
below include only drug-related deaths involving persons living in one of the 37<br />
zip codes that fall exclusively within Seattle; 141 the data cover the period from<br />
July 2005 through June 2007. Because multiple drugs are sometimes detected in<br />
cases of overdose, the number of drugs detected (341) exceeds the number of<br />
Seattle residents who died as a result of a drug overdose. As is true nationally<br />
134 Inciardi 2003.<br />
135 Chasnoff et al. 1992; Humphries 1993; Mathias 1992.<br />
136 Ibid.<br />
137<br />
National Center for Health Statistics, Deaths: Preliminary Data for 2005, Table 2.<br />
138 http://ww2.doh.wa.gov/ehsphl/chs/chs-data/death/htmltables/e7.htm.<br />
139 See Paulozzi et al. 2006; Paulozzi 2008. For a more local perspective, see Banta-Green et al.<br />
2007; Davidow 2005; Roe 2008.<br />
140<br />
Computations based on data provided in CEWG, “Recent Drug Abuse Trends in the Seattle-<br />
King County Area,” June 2007, Exhibits 1 and 2. The figures shown in the text include deaths<br />
caused by single or multiple drugs.<br />
141 Data provided by Caleb Banta-Green, Research Scientist, Alcohol and Drug Abuse Institute,<br />
University of Washington.<br />
93
and in King County, these data indicate that opiates are most commonly detected<br />
in drug-related deaths involving Seattle residents: opiates including heroin,<br />
prescription opiates or both were detected in 49.9 percent of all drug-related<br />
deaths involving Seattle residents. Cocaine (of any sort) was detected in 34.9<br />
percent of these deaths, sedatives in 9.1 percent and methamphetamine in 6.2<br />
percent. Thus, opiates are more consistently involved in drug-related deaths<br />
among Seattle residents than all forms of cocaine.<br />
Finally, there is abundant evidence that injection drug use, which<br />
overwhelmingly involves heroin, is linked to very particular and pronounced<br />
health risks, including HIV/AIDS and hepatitis C. Nationally, about one-third of<br />
all new HIV cases and 60 percent of hepatitis C infections stem from injection<br />
drug use. 142 In King County, it is estimated that just under 10 percent of injection<br />
drug users are HIV positive, but 80 percent have hepatitis C. 143 The particular<br />
association of injection drug use with heightened risk of serious infectious<br />
disease makes it difficult to justify the focus on crack cocaine in public health<br />
terms. Additionally, injection drug users are prone to a wide array of soft tissue<br />
and bacterial infections (including MRSA, necrotizing fascitis and endocarditis,<br />
which are enormously difficult and expensive to treat). 144 In short, the focus on<br />
crack cocaine does not appear to be justifiable in public health terms.<br />
HYPO<strong>THE</strong>SIS 4D: <strong>THE</strong> FOCUS ON CRACK COCA<strong>IN</strong>E REFLECTS PUBLIC SAFETY CONSIDERATIONS<br />
Even if the focus on crack cocaine users is not a function of the frequency with<br />
which it is exchanged in Seattle, citizen complaints or public health<br />
considerations, any association of the crack market with an unusual degree of<br />
violence could arguably justify law enforcement’s focus on crack cocaine users. 145<br />
142<br />
Deibert et al. 2006: 1347; Lee and Sharpe 2003.<br />
143 Of the estimated 15,000 IDUs living in King County, there are an estimated 3,150 IDUs who are<br />
also men who have sex with men. Of these, 24.8 percent have HIV/AIDS (Public Health -<br />
Seattle & King County n.d.). When combined with information regarding the prevalence of<br />
HIV/AIDS among other injection drug users (Kent 2003), the results indicate that 9.3 percent of<br />
injection drug users have HIV/AIDS.<br />
144<br />
Ciccarone et al. 2001.<br />
145 This logic is contestable, however. Even if there were more violence associated with the crack<br />
trade than with other drug markets, there is evidence that most of those involved in that trade<br />
do not resort to violence, and it is arguable that a more individualized approach to the problem<br />
of violence is warranted (USSC 2002). In addition, although some studies have found that<br />
aggressive drug enforcement can reduce violence (NIJ 1995,; 1996; Sherman, Shaw and<br />
Rogan 1995), other studies have found that intensified anti-drug enforcement efforts may<br />
actually increase the violence associated with the drug trade (Montalvo-Barbot 1997; Shepard<br />
and Blackley 2005; Sherman 1995).<br />
94
Although the crack trade has been associated with high levels of systemic<br />
violence (that is, violence that results from the unregulated nature of the illegal<br />
drug market) in some cities during some time periods, 146 Seattle police officials<br />
have noted that this association does not appear to exist in Seattle. According to<br />
these officials, “There has not been a significant level of violence associated with<br />
crack.” 147<br />
More generally, there is evidence that the association between the crack cocaine<br />
market and systemic violence in the 1980s and early 1990s in some urban areas<br />
was a function of the novelty of the drug and resulting instability of the crack<br />
market. 148 As the crack market stabilized, the connection between the crack<br />
market and violence, as well as the difference between the crack market and<br />
other drug markets, diminished. For example, the Sentencing Commission<br />
recently reported that a minority of federal-level crack offenders possessed a<br />
weapon at the time of their arrest, and that powder cocaine offenders were only<br />
very slightly less likely than crack offenders to possess a weapon when<br />
arrested. 149<br />
The evidence from Seattle actually indicates that here, crack cocaine arrestees are<br />
less likely to carry dangerous weapons than any other type of serious drug<br />
arrestee. 150 This weapons analysis utilized data that included all arrests for all<br />
drug offenses that resulted from any operation type. 151 Although 56.4 percent of<br />
all drug arrests involved (only) crack cocaine, 26.2 percent of arrests in which<br />
dangerous weapons were seized involved crack cocaine alone. By contrast, the<br />
percentage of arrests involving only heroin or methamphetamine that involved a<br />
dangerous weapon was significantly greater than the proportion of arrests that<br />
involved those narcotics (see the third and fourth columns of Table 19).<br />
Expressed differently, these figures indicate that crack cocaine arrestees were the<br />
least likely to have a dangerous weapon in their possession at the time of arrest.<br />
146 Blumstein 1995; Brownstein et al. 1992; Goldstein et al. 1997.<br />
147 Quoted in Klement and Siggins 2001: 37.<br />
148 Blumstein 1995; Taylor and Brownstein 2003.<br />
149 USSC 2002; 2007.<br />
150<br />
In this analysis, all firearms, any fixed blade knife, and any type of knife with a blade of 3.5<br />
inches in length or more are considered dangerous weapons, per Seattle, Wa. Mun. Code §<br />
12A.14.010 (defining, inter alia, “dangerous knife,” “fixed-blade knife,” and “firearm” for the<br />
purposes of the Code provisions regulating the use of weapons).<br />
151<br />
Of the purposeful serious drug delivery arrests made by the SPD in the four-month sampling<br />
period, only five involved weapons. To obtain a more meaningful understanding of the<br />
relationship between drug markets and weapons, this analysis therefore includes all drug<br />
arrests. Overall, 42 of the 1282 drug arrests (3.2 percent) made by the SPD in April and May<br />
2005 and April and May2006 led to the seizure of a dangerous weapon.<br />
95
Specifically, 1.4 percent of crack cocaine arrestees, 2.9 percent of powder cocaine<br />
arrestees, 8.3 percent of heroin arrestees, 12.1 percent of all methamphetamine<br />
arrestees, and 23.1 percent of all ecstasy arrestees possessed a dangerous weapon<br />
at the time of their arrest (see the far right column of Table 19).<br />
Table 19. Weapons Found in Seattle Drug Arrests, 2005–2006<br />
Arrests<br />
with<br />
Dangerous<br />
Knives<br />
(n=16)<br />
Arrests<br />
with<br />
Firearms<br />
(n=26)<br />
Arrests<br />
with Any<br />
Dangerous<br />
Weapon<br />
(n=42)<br />
All Drug<br />
Arrests<br />
(n=1,282)<br />
Percentage of<br />
Arrests with<br />
a Dangerous<br />
Weapon<br />
Drug<br />
Crack<br />
Cocaine<br />
37.5% 19.2% 26.2% 56.4% 1.4%<br />
Methamphetamine<br />
25% 23% 23.8% 6.5% 12.1%<br />
Heroin 12.5% 11.5% 11.9% 4.7% 8.3%<br />
Ecstasy 0 11.5% 7.1% 1% 23.1%<br />
Powder<br />
Cocaine<br />
6.3% 0 2.4% 2.7% 2.9%<br />
Race of Suspect<br />
White 81.3% 34.6% 52.4% 40% 4.8%<br />
Black 12.5% 46.1% 33.3% 52.4% 2.1%<br />
Asian 6.3% 19.2% 14.3% 5.5% 8.5%<br />
Type of Location<br />
Indoor 25% 23.1% 23.8% 17.4% 4.5%<br />
Outdoor 56.3% 26.9% 38.1% 62.8% 2%<br />
Vehicle 18.8% 50% 38.1% 19.3% 6.5%<br />
Source: Seattle Police Department incident reports.<br />
Note: Includes all drug arrests made during April or May of 2005 and April or May of 2006.<br />
96
Weapons were more likely to be seized in indoor arrests and in arrests involving<br />
white suspects than in outdoor arrests or arrests involving black suspects. 152<br />
These data thus suggest that neither the SPD focus on the crack cocaine market<br />
nor its focus on outdoor markets nor its focus on black drug suspects are<br />
justifiable in terms of safety concerns as measured by weapon seizures.<br />
152 This analysis thus indicates that the weapon “hit rate” is lower for whites and non-crack<br />
arrestees than for black and/or crack arrestees. Similarly, there is evidence that a higher<br />
percentage of white motorists had drugs in their possession when their car was searched by<br />
Washington State Patrol than did black motorists (Lovrich et al. 2003).<br />
97
CONCLUSION<br />
The policies associated with the war on drugs are an important cause of the<br />
expansion of the U.S. criminal justice system and of growing racial disparities<br />
within it. Although racial disproportionality in drug arrests is a concern across<br />
the nation, the over-representation of blacks among drug arrestees is especially<br />
pronounced in Seattle. Indeed, only one of the other 39 mid-sized cities for which<br />
data are available has a higher black-to-white drug arrest rate ratio than that<br />
found in Seattle. Although a majority of Seattle residents who use and deliver all<br />
serious drugs (with the possible exception of crack cocaine) are white, more than<br />
two-thirds of those purposefully arrested for delivery of any serious drug in<br />
2005–2006 were black. In 2006, the black drug arrest rate was more than 13 times<br />
higher than the white drug arrest rate; for drug delivery arrests involving serious<br />
drugs, the black arrest rate was 21 times higher and for purposeful drug delivery<br />
arrests, the black arrest rate was more than 24 times higher. Moreover, the overrepresentation<br />
of blacks among drug delivery arrestees remains large even after<br />
taking potential differences in involvement in drug delivery into account.<br />
The SPD’s focus on outdoor markets in general and the downtown area in<br />
particular modestly exacerbate racial disproportionality in drug arrests.<br />
However, the racial composition of those arrested indoors and outside of<br />
downtown is not markedly different than of those arrested outdoors and<br />
downtown. Thus, neither the focus on outdoor markets in general nor on the<br />
downtown area in particular is a fundamental cause of black over-representation<br />
among drug delivery arrestees. By contrast, the racial composition of those<br />
arrested for delivering crack cocaine is markedly different than the racial<br />
composition of those arrested for delivery of a serious drug other than crack<br />
cocaine.<br />
It is not possible to determine whether the SPD’s focus on black suspects explains<br />
the preponderance of crack cocaine deliverers among delivery arrestees, or<br />
whether its focus on crack cocaine deliverers leads to the over-representation of<br />
blacks. For the sake of caution, this analysis has assumed that the latter is the<br />
case: the SPD’s focus on those who deliver crack cocaine is a fundamental cause<br />
of the over-representation of blacks among Seattle drug delivery arrestees. Yet<br />
the focus on crack cocaine—the serious drug that is most strongly associated<br />
with blacks—does not appear to be attributable to race-neutral factors, including<br />
the frequency with which crack cocaine is exchanged, the distribution of civilian<br />
complaints, public health considerations or public safety concerns. This finding<br />
99
supports an alternative explanation—namely, that the focus on crack cocaine<br />
reflects the association of that particular substance with blacks. Moreover, the<br />
arrest patterns documented here are highly consistent with those reported in a<br />
previous analysis. 153 The consistency of Seattle’s arrest pattern over time suggests<br />
that the SPD has been unwilling to alter the practices that have been shown to<br />
produce an usually high degree of racial disproportionality. Although colorblind<br />
on its face, the focus on crack cocaine does not appear to be a function of raceneutral<br />
considerations, and continues to produce an extraordinarily high degree<br />
of racial disparity in Seattle drug arrests. The harm associated with felony<br />
conviction and incarceration is surely exacerbated to the extent that those costs<br />
are imposed on black Seattle residents in ways that are not explained by either<br />
levels of involvement in drug delivery or other race-neutral policy<br />
considerations.<br />
153<br />
Beckett 2004.<br />
100
REFERENCES<br />
Adler, Patricia. 1985. Wheeling and Dealing: An Ethnography of an Upper-Level Drug<br />
Dealing and Smuggling Community. New York: Columbia University Press.<br />
Banta-Green, Caleb, Gary Goldbaum, Susan Kingston, Matthew Golden, Richard<br />
Harruff, and Barry K. Logan. 2005. “Epidemiology of MDMA and Associated<br />
Club Drugs in the Seattle Area.” Substance Use and Misuse 40: 1295-1315.<br />
Banta-Green, Caleb, T. Ron Jackson, Michael Hanrahan, Steve Freng, Susan<br />
Kingston, David H. Albert, Ann Forbes, Richard Haruff, and Sara Miller. 2006.<br />
“Recent Drug Abuse Trends in the Seattle-King County Area.” Epidemiologic<br />
Trends in Drug Abuse, June 2006.<br />
Banta-Green, Caleb, Joseph Merrill, T. Ron Jackson, and Michael Hanrahan. 2007.<br />
ADAI Research Brief: The Use and Abuse of Prescription Type Opiates in Washington<br />
State (March 30).<br />
Beckett, Katherine. 1995. “Media Depictions of Drug Abuse: The Impact of<br />
Official Sources.” Journal of Research in Political Sociology 7:11-182.<br />
Beckett, Katherine, Kris Nyrop, Lori Pfingst, and Melissa Bowen. 2005. “Drug<br />
Use, Drug Arrests, and the Question of Race: Lessons from Seattle.” Social<br />
Problems 52, no. 3 (August 2005): 419-41.<br />
Beckett, Katherine, Kris Nyrop, and Lori Pfingst. 2006. “Race, Drugs and<br />
Policing: Understanding Disparities in Drug Delivery Arrests.” Criminology 44,<br />
no. 1 (February 2006): 105-137.<br />
Beckett, Katherine and Theodore Sasson. 1998. “The Media and the Construction<br />
of the Drug Crisis in America.” In The New War on Drugs: Symbolic Politics and<br />
Criminal Justice Policy. Eds Eric Jensen and Jurg Gerber. Anderson Publishers.<br />
Brownstein, Henry H., H.R.S. Baxi, P.J. Goldstein, and P.J. Ryan. 1992. “The<br />
Relationship of Drugs, Drug Trafficking, and Drug Traffickers to Homicide.”<br />
Journal of Crime and Justice 15:25 -44.<br />
101
Buckman, Charles, and John Lamberth. 1999. “Challenging Racial Profiles:<br />
Attacking Jim Crow on the Inter-State.” The Champion (National Association of<br />
Criminal Defense Lawyers), September-October.<br />
Bureau of Justice Statistics n.d. “Correction Statistics.”<br />
http://www.ojp.usdoj.gov/bjs/correct.htm (accessed May 20, 2008).<br />
Centers for Disease Control and Prevention. 2001. National Hepatitis C Prevention<br />
Strategy. Atlanta, Georgia: Centers for Disease Control and Prevention.<br />
Chen, Wei J., Cheng-Chung Fang, Ren-Shi Shyu, and Kuo-Chien Lin. 2006.<br />
“Underreporting of illicit drug use by patients at emergency departments as<br />
revealed by two-tiered urinalysis.” Addictive Behaviors 31, 12: 2304-2308.<br />
Chiricos, Ted, Kelle Barrick, William Bales, and Stephanie Bontrager. 2007. “The<br />
Labeling of Convicted Felons and its Consequences for Recidivism.” Criminology<br />
45, no. 3:547-571.<br />
Ciccarone, D. 2001. “Soft Tissue Infections Among Injection Drug Users -- San<br />
Francisco, California, 1996 - 2000.” Morbidity and Mortality Week in Review 50(19):<br />
381-4.<br />
Clear, Todd R., Dina R. Rose and Judith Ryder. 2001. “Incarceration and the<br />
Community: The Problem of Removing and Returning Offenders.” Crime and<br />
Delinquency, 47(3): 335-351.<br />
Cornelius, Diana. Nd. Demographic Snapshots: Seattle Poverty Rates Vary Widely.<br />
City of Seattle, Population and Demographics Division.<br />
Darke, Shane, Sharlene Kaye, and Libby Topp. 2002. “Cocaine use in New South<br />
Wales, Australia, 1996-2000.” Drug and Alcohol Dependence 67, no. 1:81-88.<br />
Davidow, Julie. 2005. “Opiate Misuse Takes a Lethal Toll: Deaths from<br />
Prescription Painkiller Overdoses on the Rise in King County.” Seattle Post-<br />
Intelligencer, July 15, 2005.<br />
Davis C.S., S. Burris, J. Kraut-Becher, K.G. Lynch, and D. Metzger. 2005. “Effects<br />
of an Intensive Street-level Police Intervention on Syringe Exchange Program use<br />
in Philadelphia, PA.” American Journal of Public Health 95, no. 2:233-36.<br />
102
Deibert, Ryan J., Gary Goldbaum, Theodore R. Parker, Holly Hagan, Robert<br />
Marks, Michael Hanrahan, and Hanna Thiede. 2006. “Increased Access to<br />
Unrestricted Pharmacy Sales of Syringes in Seattle-King County, Washington:<br />
Structural and Individual-level Changes, 1996 versus 2003.” American Journal of<br />
Public Health 96, no. 8:1347-1353.<br />
Donziger, Steven R., ed. 1996. The Real War on Crime: The Report of the National<br />
Crime Commission. New York: HarperPerennial.<br />
Duster, Troy. 1997. “Pattern, Purpose and Race in the Drug War.” In Crack in<br />
America: Demon Drugs and Social Justice. Ed Craig Reinarman and Harry G.<br />
Levine, 260-87. Berkeley: University of California Press.<br />
Eckholm, Erik. 2008. “Racial Disparities Found to Persist as Drug Arrests Rise.”<br />
New York Times, May 8, 2008.<br />
Engel, Robin Shepard and Jennifer Calnon. 2004. “Comparing Benchmark<br />
Methodologies for Police-Citizen Contacts.” Police Quarterly 7, no. 1: 97-125.<br />
Faupel, Charles E. and Carl B. Klockars. 1990. “Drugs-Crime Connections:<br />
Elaborations from the Life Histories of Hard-Core Heroin Addicts.” Chapter 25<br />
in Criminal Behavior: Text and Readings in Criminology. 2 nd edition. Ed Delos H.<br />
Kelly. New York: St. Martin’s Press.<br />
Friedman, Samuel R., Tim F. Chapman, Theresa E. Perlis, Russell Rockwell,<br />
Denise Paone, Jo L. Sotheran, and Don C. Des Jarlais. 1999. “Similarities and<br />
Differences by Race/Ethnicity in Changes of HIV Seroprevalence and Related<br />
Behaviors Among Drug Injectors in New York City, 1991–1996.” Journal of<br />
Acquired Immune Deficiency Syndromes 22, no. 1 (September):82-91.<br />
Garland, David, ed. 2001. Mass Imprisonment: Its Causes and Consequences. Beverly<br />
Hills, CA: Sage Publications.<br />
Goode, Erich. 2002. “Drug Arrests at the Millennium.” Society 39, 5 (259): 41-5.<br />
Hagan, John and Juleigh Petty Coleman. 2001. “Returning Captives of the<br />
American War on Drugs: Issues of Community and Family Re-entry.” Crime and<br />
Delinquency 47, no. 3):352-367.<br />
103
Hagedorn, John M. 1994. “Homeboys, Dope Fiends, Legits, and New Jacks.”<br />
Criminology 32, no. 2:197-219.<br />
Huizinga, David, Terence P. Thornberry, Kelly E. Knight, Peter J. Lovegrove,<br />
Rolf Loeber, Karl Hill, and David P. Farrington. 2006. Disproportionate<br />
Minority Contact in the Juvenile Justice System: A Study of Differential Minority<br />
Arrest/ Referral to Court in Three Cities. (A Report to the Office of Juvenile Justice<br />
and Delinquency Prevention).<br />
Human Rights Watch. 2008. Targeting Blacks: Drug Law Enforcement and Race in the<br />
United States. New York: Human Rights Watch.<br />
Hunt, Dana E. 1990. “Drugs and Consensual Crimes: Drug Dealing and<br />
Prostitution.” In Volume 13 of Drugs and Crime, ed Michael Tonry and James Q.<br />
Wilson.. Chicago: University of Chicago Press.<br />
Jick, Todd D. 1979. “Mixing Qualitative and Quantitative Methods: Triangulation<br />
in Action.” Administrative Science Quarterly 24, no. 4:602-22.<br />
Kent, Jim ed. 2003. 2003 HIV/AIDS Epidemiology Profile For Community Planning.<br />
Public Health - Seattle and King County.<br />
King, Ryan S. 2008. Disparity by Geography: The War on Drugs in America’s Cities.<br />
Washington DC: The Sentencing Project.<br />
Klement, Tal and Elizabeth Siggins. 2001. A Window of Opportunity: Addressing the<br />
Complexities of the Relationship between Drug Enforcement and Racial Disparity in<br />
Seattle. http://www.defender.org/racial-disparity.html.<br />
Lee, L.M. and T.T. Sharpe. 2003. “HIV Diagnosis among Injection Drug Users in<br />
States with HIV Surveillance. MMWR 52:634-6.<br />
Liptak, Adam. 2008. “Inmate Count in U.S. Dwarfs Other Nations.” New York<br />
Times, April 23, 2008: A1.<br />
Lovrich, Nicholas, Michael Gaffney, Clay Mosher, Mitchell Pickerill, and Michael<br />
Smith. 2003. WSP Traffic Stop Data Analysis Project: Data Analysis Project Report.<br />
http://www.wsp.wa.gov/reports/wsptraff.pdf.<br />
104
Lu, Natalie T., Bruce G. Taylor, and K. Jack Riley. 2001. “The Validity of Adult<br />
Arrestee Self-Reports of Crack Cocaine Use.” American Journal of Drug and Alcohol<br />
Abuse 27, no. 3.<br />
Manderson, Desmond. 1997. “Substances as Symbols: Race Rhetoric and the<br />
Tropes of Australian Drug History.” Social and Legal Studies 6, no. 3:383-400.<br />
Manza, Jeff and Christopher Uggen. 2006. Locked Out: Felon Disenfranchisement<br />
and American Democracy. New York: Oxford University Press.<br />
Marijuana Policy Review Panel. 2007. Final Report of the Marijuana Policy Review<br />
Panel on the Implementation of Initiative 75.<br />
http://www.cityofseattle.net/council/attachments/2008mprp_final_report.pdf.<br />
Mauer, Marc and Meda Chesney-Lind, eds. 2003. Invisible Punishment: The<br />
Collateral Consequences of Mass Imprisonment. New York: The New Press.<br />
Millman, Robert B. and Ann Bordwine Beeder. 1998. “The New Psychedelic<br />
Culture: LSD, Ecstasy, ‘Rave’ Parties, and the Grateful Dead.” Chapter 21 in The<br />
American Drug Scene: An Anthology. Ed. James A. Inciardi and Karen McElrath.<br />
Beverly Hills: Roxbury Publishing.<br />
Minority and Justice Commission, Washington State Supreme Court. 1999. The<br />
Impact of Race and Ethnicity on Charging and Sentencing Processes for Drug Offenders<br />
in Three Counties in Washington State.<br />
Montalvo-Barbot, Alfredo. 1997. “Crime in Puerto Rico: Drug Trafficking,<br />
Money Laundering, and the Poor.” Crime and Delinquency 43, no. 4:533-48.<br />
Morgan, John P. and Lynn Zimmer. 1997. “The Social Pharmacology of Smokable<br />
Cocaine: Not All Its Cracked Up To Be.” Chapter 7 in Crack in America: Demon<br />
Drugs and Social Justice. Ed Craig Reinarman and Harry G. Levine. Berkeley:<br />
University of California Press.<br />
Murphy, Sheigla and Marsha Rosenbaum. 1997. “Two Women Who Used<br />
Cocaine Too Much: Class, Race, Gender, Crack, and Coke.” Chapter 4 in Crack in<br />
America: Demon Drugs and Social Justice. Ed Craig Reinarman and Harry G.<br />
Levine. Berkeley, CA: University of California Press.<br />
105
Murphy, Sheigla and Dan Waldorf. 1998. “Kickin’ Down to the Street Doc:<br />
Shooting Galleries in the San Francisco Bay Area.” Chapter 15 in The American<br />
Drug Scene: An Anthology. Ed James A. Inciardi and Karen McElrath. Roxbury<br />
Publishing.<br />
Musto, David F. 1973. The American Disease: Origins of Narcotics Control. Oxford<br />
University Press.<br />
New York Times. 2008. Editorial: “Racial Inequity and Drug Arrests.” New York<br />
Times, May 10, 2008.<br />
Nyrop, Kris. 2008. Demographic Comparisons of Two Public Venue Drug Markets in<br />
Seattle. May 20, 2008. Report and data on file with the author.<br />
Pager, Devah. 2003. “The Mark of a Criminal Record.” American Journal of<br />
Sociology 108: 937-975.<br />
___________. 2007. Marked: Race, Crime and Finding Work in an Era of Mass<br />
Incarceration. Chicago: University of Chicago Press.<br />
Paulozzi, Leonard J. M.D., M.P.H. 2008. Medical Epidemiologist, Division of<br />
Unintentional Injury Prevention, National Center for Injury Prevention and<br />
Control, Centers for Disease Control and Prevention, U.S. Department of Health<br />
and Human Services. Congressional Testimony, Trends in Unintentional Drug<br />
Overdose Deaths. Presented to the Subcommittee on Crime and Drugs Committee<br />
on the Judiciary and the Caucus on International Narcotics Control United States<br />
Senate, Wednesday, March 12, 2008.<br />
Paulozzi, Leonard J., Daniel S. Budnitz and Yongli Xi. 2006. “Increasing Deaths<br />
from Opioid Analgesics in the United States.” Pharmacoepidemiology and Drug<br />
Safety 15:618-27.<br />
Perdue, Thomas, Holly Hagan, Hanne Thiede and Linda Valleroy. 2003.<br />
“Depression and HIV Risk Behavior among Seattle-Area Injection Drug Users<br />
and Young Men who Have Sex with Men.” AIDS Education and Prevention 15(1):<br />
81-92.<br />
106
Patillo, Mary, David Weiman, and Bruce Western (eds.). 2004. Imprisoning<br />
America: The Social Effects of Mass Incarceration. New York: Russell Sage<br />
Foundation.<br />
Pettit, Becky and Bruce Western. 2004. “Mass Imprisonment and the Life Course:<br />
Race and Class Inequality in U.S. Incarceration.” American Sociological Review<br />
69:151-169.<br />
Preble, Edward and John J. Casey. 1998. “Taking Care of Business—The Heroin<br />
Addict’s Life on the Street.” Chapter 13 in The American Drug Scene: An<br />
Anthology. Ed James A. Inciardi and Karen McElrath. Roxbury Publishing.<br />
Public Health - Seattle and King County. 2005. Facts about HIV Infection in King<br />
County. http://www.metrokc.gov/health/apu/epi/hivkc.pdf.<br />
Quillian, Lincoln and Devah Pager. 2001. “Black Neighbors, Higher Crime? The<br />
Role of Racial Stereotypes in Evaluations of Neighborhood Crime.” American<br />
Journal of Sociology 107, no. 3:717-67.<br />
Reeves, Jimmie L. and Richard Cambell. 1994. Cracked Coverage: Television<br />
News, the Anti-Cocaine Crusade, and the Reagan Legacy. Durham, NC: Duke<br />
University Press.<br />
Reinarman, Craig and Harry G. Levine. 1997. Crack in America: Demon Drugs<br />
and Social Justice. Berkeley: University of California Press.<br />
Reinarman, Craig, Dan Waldorf, Sheigla B. Murphy, and Harry G. Levine. 1997.<br />
“The Contingent Call of the Pipe: Bingeing and Addiction among Heavy Cocaine<br />
Smokers.” Chapter 4 in Crack in America: Demon Drugs and Social Justice. Ed Craig<br />
Reinarman and Harry G. Levine. Berkeley: University of California Press).<br />
Rich, Josiah D., Larkin Strong, Christopher W. Towe, Michelle McKenzie. 1999.<br />
“Obstacles to Needle Exchange Participation in Rhode Island.” Journal of Acquired<br />
Immune Deficiencies 21, no. 5:396-400.<br />
Riley, Jack K. 1997. Crack, Powder Cocaine, and Heroin: Purchase and Use Patterns in<br />
Six Cities. National Institute of Justice and Office of National Drug Control<br />
Policy.<br />
107
Ritter, Alison. 2005. A Review of Approaches to Studying Illicit Drug Markets. Drug<br />
Policy Modeling Project, Monograph 08.<br />
Roe, Amy. 2008. “Prescription painkiller deaths in state surpass deaths from<br />
illegal drugs.” Seattle Times, March 28, 2008.<br />
Rosenbaum, Marsha, Patricia Morgan, and Jerome E. Beck. 1998. “Ethnographic<br />
Notes on Ecstasy Use among Professionals.” Chapter 22 in The American Drug<br />
Scene: An Anthology. Ed James A. Inciardi and Karen McElrath. Roxbury<br />
Publishing.<br />
Sampson, Robert J. and Stephen W. Raudenbush. 2004. “Seeing Disorder:<br />
Neighborhood Stigma and the Social Construction of “Broken Windows.” Social<br />
Psychology Quarterly 67, no. 4:319-42.<br />
Schutt, Russell K. 1996. Investigating the Social World: The Process and Practice of<br />
Research. Thousand Oaks, CA: Pine Forge Press.<br />
Shedlin, Michele G., Rebecca Ramos, and Maria Elena Ramos. In progress.<br />
Methamphetamine Use on the U.S.-Mexico Border. Center for Border Health<br />
Research.<br />
Shepard, E.M. and P.R. Blackley. 2005. “Drug Enforcement and Crime: Recent<br />
Evidence from New York State.” Social Science Quarterly 86, no. 2:323–342.<br />
Sherman, Lawrence. 1995. “The Police.” In Crime. Ed J.Q. Wilson and J.<br />
Petersilia, 159-202. San Francisco: ICS Press.<br />
Soldbergsdottir, Elisabet, Gudbjorn Bjornsson, Larus S. Gudmundsson, Torarinn<br />
Tyrfingsson, and Jakob Kristinsson. 2004. “Validity of Self-Reports and Drug use<br />
among Young People Seeking Treatment for Substance Abuse or Dependence.”<br />
Journal of Addictive Diseases 23, no. 1.<br />
Steiner, Benjamin D. 2001. “The Consciousness of Crime and Punishment:<br />
Reflections on Identity Politics and Lawmaking in the War on Drugs.” Studies in<br />
Law, Politics and Society 23:185-212.<br />
Sterling, Eric. 1997. “Drug Policy: A Smorgasbord of Conundrums Spiced by<br />
Emotions Around Children and Violence.” Valparaiso University Law Review 31, 2:<br />
597-645.<br />
108
Substance Abuse and Mental Health Services Administration (SAMHSA). 2007).<br />
Results from the 2006 National Survey on Drug Use and Health: National Findings.<br />
Office of Applied Studies, NSDUH Series H-32, DHHS Publication No. SMA 07-<br />
4293. Rockville, MD: National Institute of Health.<br />
Taylor, Bruce and Henry H. Brownstein. 2003. “Toward the Operationalization of<br />
Drug Market Stability.” Journal of Drug Issues 33, no. 1:73-98.<br />
Tonry, Michael. 1995. Malign Neglect: Race, Crime, and Punishment in America.<br />
New York: Oxford University Press.<br />
Topp, L., C. Breen, S. Kaye, and S. Darke. 2004. “Adapting the Illicit Drug<br />
Reporting System to Examine the Feasibility of Monitoring Trends in the Markets<br />
for ‘Party Drugs.” Drug and Alcohol Dependence 7, 73, no. 2:189-97.<br />
Travis, Jeremy and Michelle Waul, eds. 2004. Prisoners Once Removed: The Impact<br />
of Incarceration and Re-entry on Children, Families and Communities. Washington,<br />
DC: Urban Institute Press.<br />
Wagner, Lisa Smith, Linda Carlin, Ana Mari Cauce, and Adam Tenner. 2001. “A<br />
Snapshot of Homeless Youth in Seattle: Their Characteristics, Behaviors, and<br />
Beliefs about HIV Protective Strategies.” Journal of Community Health 26, no.<br />
3:219-232.<br />
Waldorf, Dan, Craig Reinarman, and Sheigla Murphy. 1991. Cocaine Changes: The<br />
Experience of Using and Quitting. Temple University Press.<br />
Western, Bruce. 2006. Punishment and Inequality in America. New York:<br />
Russell Sage Foundation.<br />
Western, Bruce and Sara McLanahan. 2000. “Fathers in Fragile Families: The<br />
Impact of Incarceration on Family Formation.” In Families and Crime. Ed G.L. Fox.<br />
London: Oxford University Press.<br />
Western, Bruce and Becky Pettit. 2005. “Black-White Wage Inequality,<br />
Employment Rates, and Incarceration.” American Journal of Sociology 111:553–578.<br />
Wilkins, C., M. Girling, P. Sweetsur, and R. Butler. 2005. Hallucinogens and Other<br />
Illicit Drug Trends in New Zealand, 2005. Center for Social and Health Outcomes<br />
Research and Evaluation, Massey University, New Zealand.<br />
109
United Nations International Drug Control Programme, Regional Centre for East<br />
Asia and the Pacific. 2000. Reducing Illicit Drug Use in the Highlands of East Asia:<br />
External Sub-Regional Appraisal Report.<br />
United States Sentencing Commission. 2007. Report to Congress: Cocaine and<br />
Federal Sentencing Policy. Washington DC.<br />
World Health Organization, UNHCR: The UN Refugee Agency. 2008. Rapid<br />
Assessment of Alcohol and Other Substance Use in Conflict-Affected and Displaced<br />
Populations: A Field Guide.<br />
110
APPENDIX A: PUBLIC <strong>DRUG</strong> TREATMENT<br />
ADMISSIONS AMONG SEATTLE RESIDENTS<br />
Table A1. Racial/Ethnic Composition of Seattle Residents Admitted to Public<br />
Drug Treatment Programs by Primary Drug of Abuse and Referral Source, 2006<br />
Primary Drug<br />
of Abuse<br />
Cocaine (all<br />
types)<br />
(n=1,921)<br />
Heroin<br />
(n=1,855)<br />
Meth<br />
(n=833)<br />
Other Serious<br />
Drugs<br />
(n=102)<br />
All Serious<br />
Drugs<br />
(n=5,136)<br />
Referral<br />
Source<br />
Criminal<br />
Justice<br />
White<br />
Black/<br />
African<br />
American<br />
American<br />
Indian/<br />
Alaska<br />
Native<br />
Hispanic<br />
/ Latino<br />
Asian/<br />
Pacific<br />
Islander<br />
27.8% 55.7% 1% 3.2% 2.9%<br />
Other 32.9% 49.3% 2.5% 4% 1.1%<br />
All<br />
Referrals<br />
Criminal<br />
Justice<br />
31.1% 51.6% 2% 3.7% 1.8%<br />
56.6% 19.6% 3.5% 7.1% .3%<br />
Other 63.6% 16.9% 2.7% 6.5% .5%<br />
All<br />
Referrals<br />
Criminal<br />
Justice<br />
62.4% 17.4% 2.9% 6.6% .5%<br />
80.3% 2% 1.7% 2% 3.5%<br />
Other 71.5% 8.1% 2.6% 5.8% 3%<br />
All<br />
Referrals<br />
Criminal<br />
Justice<br />
Other<br />
Referrals<br />
All<br />
Referrals<br />
Criminal<br />
Justice<br />
Other<br />
Referrals<br />
All<br />
Referrals<br />
75.8% 5.2% 2.2% 4% 3.2%<br />
52% 20.6% 3.9% 4.9% 2%<br />
68% 11.8% 2.4% 2.6% 3.8%<br />
64.9% 13.5% 2.7% 3% 3.4%<br />
49.4% 31.6% 1.9% 3.8% 2.5%<br />
54.7% 26.2% 2.6% 4.7% 1.4%<br />
53.1% 27.8% 2.4% 4.7% 1.7%<br />
Source: Caleb Banta-Green, Research Scientist, Alcohol and Drug Abuse Institute<br />
University of Washington.<br />
Note: The results shown here include residents living in all zip codes which are entirely or<br />
partly inside Seattle. Thirty-seven of these zip codes fall exclusively within Seattle; four span<br />
the city boundary. The numbers shown here are smaller than those shown in the main body<br />
of the report because they are based on data received as of November 2007.<br />
111
APPENDIX B: UNRELIABLE 9-1-1 CALL EXAMPLES<br />
Event 06-187267<br />
Complaint: “People lined up in front smoking crack…. 12 black males, 1<br />
white male with long blond hair… .”<br />
Arrival:<br />
One minute later.<br />
Officer Update: “[I] was sitting in front of the location when the subject<br />
called and it is a bogus call.”<br />
Complaint:<br />
Arrival:<br />
Officer Update:<br />
Complaint:<br />
Arrival:<br />
Officer Update:<br />
Complaint:<br />
Arrival:<br />
Officer Update:<br />
Complaint:<br />
Arrival:<br />
Officer Update:<br />
Event 06-131429<br />
“Out front, remove group of males selling narcotics which is<br />
making it difficult for customers to get in; 9 black males.”<br />
Two minutes later.<br />
“Pretty quiet out here.”<br />
Event 06-132028<br />
“Complainant says there are 20 subjects smoking crack just<br />
inside main entrance… .”<br />
Three minutes later.<br />
“Bogus call. Business is very good about no drugs. No crack<br />
smokers located.”<br />
Event 05-177474<br />
“Check for drug dealer at car wash. Selling drugs out of<br />
vehicle…. .”<br />
16 minutes later.<br />
“The owner of the blue caddy is drying cars for a few dollars<br />
and not dealing dope as the ‘too sacred to leave my name’<br />
caller said. He is trying his hand at entrepreneurship and I<br />
don’t have a problem with him. I wonder what the caller<br />
does for a living, or maybe they were tooooo cheeeap to pay<br />
for his services…. No Po-Po services needed here.”<br />
Event 06-219635<br />
“SB Bus Stop, 3 people smoking crack, black male, white<br />
female, black female.”<br />
36 seconds later.<br />
“No one here smoking crack.”<br />
112
Complaint:<br />
Arrival:<br />
Officer Update:<br />
Event 06-210126<br />
“SE Corner in front of Lazarus Day Center. 5 BMs and 1 BF<br />
smoking crack… .”<br />
Three minutes later.<br />
“Only three people and it’s nicotine.”<br />
Event 06-210002<br />
Complainant: “Check for 9 people in front of Lazarus Day Center drinking<br />
and using drugs.”<br />
Arrival:<br />
55 minutes later.<br />
Officer: “Only smoking cigarettes…. .”<br />
Event 06-179969<br />
Complaint: “Behind in the alley, 2 white males smoking narcotics… .”<br />
Arrival:<br />
Six minutes later<br />
Officer:<br />
“Cigarettes, not drugs.”<br />
Complaint:<br />
Arrival:<br />
Officer Update:<br />
Event 06-174227<br />
“At least 15 males and females smoking crack and<br />
drinking… would like them moved on…. 3 white males, 8<br />
black males, 3 black females….”<br />
Three minutes later.<br />
“No one around.”<br />
Event 06-196952<br />
Complaint: “Check area for approximately 6–9 juveniles smoking<br />
marijuana… 8–9 black males and black females, teens… .<br />
Arrival: 14 minutes later… .”<br />
Officer Update: “Small group of kids scattered as I drove up, smoking<br />
cigarettes.”<br />
Complaint:<br />
Arrival:<br />
Officer Update:<br />
Event 05-173573<br />
“SW corner, check for several males that were smoking<br />
drugs… last saw about 6 black males…. .”<br />
15 minutes later.<br />
“Area check made. No groups found loitering in the<br />
area…. 2 persons not matching the description were sitting<br />
in front of the Rite Aid across the street… Asked them if<br />
they’d seen anything... negative.”<br />
113
Complaint:<br />
Arrival:<br />
Officer Update:<br />
Event 06-136374<br />
“Check for small group of drug purveyors. Says at least 2 are<br />
selling something… approximately 5–7 black males, black<br />
females… couple of small kids with them.”<br />
Four minutes later.<br />
“I asked several young men sitting within the block if they<br />
had seen drug dealing and/or gangsters. They replied that<br />
they had not.”<br />
Event 05-140423<br />
Complaint: “On NE Corner, check for two males selling drugs… .”<br />
Arrival:<br />
Three minutes later.<br />
Officer Update: “Subjects gone on arrival. Spoke to nearby resident. Resident<br />
observed no such activity in last 20 minutes.”<br />
Complaint:<br />
Arrival:<br />
Officer Update:<br />
Complaint:<br />
Arrival:<br />
Officer Update:<br />
Complaint:<br />
Arrival:<br />
Officer Update:<br />
Complaint:<br />
Arrival:<br />
Event 05-155152<br />
“In front, check for 2 males smoking narcotics. Both black<br />
males, 30s.”<br />
Five minutes later.<br />
“Not seeing anything criminal going on… just a lot of people<br />
wasting time.”<br />
Event 05-199962<br />
“4 males in front smoking pot… black males, 22, unknown<br />
clothing.”<br />
Six minutes later.<br />
“There are 6 people hanging outside of the residence. While<br />
speaking with them, I had no indication that anyone was<br />
smoking marijuana. I advised them of the complaint. They<br />
said the only thing being smoked was cigarettes.”<br />
Event 06-160693<br />
“Check for 6 males using drugs, 6 black males.”<br />
Five minutes later<br />
“Several people in area. No narcotics activity observed.”<br />
Event 05-161713<br />
“In the alley… 4 males and 1 female smoking drugs. 1 black<br />
male in his twenties; 3 white males, teens.”<br />
Four minutes later.<br />
114
Officer Update:<br />
Complaint:<br />
Arrival:<br />
Officer:<br />
“Couple OK kids going back to school after their lunch<br />
break and one smoking a cigarette.”<br />
Event 05-185960<br />
“In front of house south of above address, 2 males inside<br />
vehicle waiting for drugs in dark color jeep, license plate<br />
unknown. Male walks from 16 Ave SW with the narcotics.<br />
This is chronic.”<br />
Two minutes later.<br />
“Contacted subject in question. Said his car wasn’t working<br />
and he was waiting for friends. Was clear.”<br />
Event 06-143416<br />
Complaint: “Behind in alley, area check, 6 males selling narcotics… 3<br />
Indian males, 3 white males, 30s.”<br />
Arrival:<br />
Four minutes later.<br />
Officer:<br />
“Exhaustive area check by three alert and dedicated officers<br />
revealed that the alleged neredowells and their associated<br />
activity had probably been thwarted by the quick and<br />
courageous actions of the responsible citizen caller.<br />
Sometimes I just love this job.”<br />
115
ABOUT <strong>THE</strong> AUTHOR<br />
Katherine Beckett is an Associate Professor in the Department of Sociology and<br />
the Law, Societies & Justice Program at the University of Washington in Seattle.<br />
Katherine received her Ph.D. from UCLA’s Department of Sociology in 1994. Her<br />
research interests include policy responses to crime and drug use, socio-legal<br />
studies, punishment, and social control. She has published numerous articles and<br />
book chapters on these topics, including several articles analyzing the politicaleconomic<br />
causes and consequences of the expansion of the social control<br />
apparatus in industrialized democracies. She is the author of two books: The<br />
Politics of Injustice: Crime and Punishment in America (with Theodore Sasson, Sage<br />
Publications) and Making Crime Pay: Law and Order in Contemporary American<br />
Politics (Oxford University Press) on these topics.
NOTES
<strong>THE</strong> DEFENDER ASSOCIATION