Stata Quick Reference and Index
Stata Quick Reference and Index
Stata Quick Reference and Index
You also want an ePaper? Increase the reach of your titles
YUMPU automatically turns print PDFs into web optimized ePapers that Google loves.
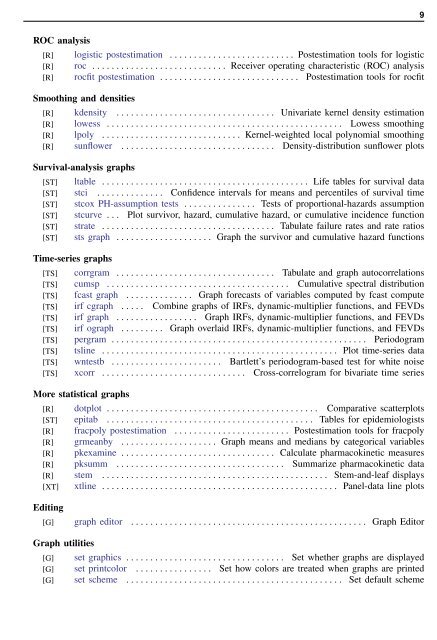
9<br />
ROC analysis<br />
[R] logistic postestimation . . . . . . . . . . . . . . . . . . . . . . . . . . Postestimation tools for logistic<br />
[R] roc . . . . . . . . . . . . . . . . . . . . . . . . . . . . Receiver operating characteristic (ROC) analysis<br />
[R] rocfit postestimation . . . . . . . . . . . . . . . . . . . . . . . . . . . . . Postestimation tools for rocfit<br />
Smoothing <strong>and</strong> densities<br />
[R] kdensity . . . . . . . . . . . . . . . . . . . . . . . . . . . . . . . . . Univariate kernel density estimation<br />
[R] lowess . . . . . . . . . . . . . . . . . . . . . . . . . . . . . . . . . . . . . . . . . . . . . . . . . Lowess smoothing<br />
[R] lpoly . . . . . . . . . . . . . . . . . . . . . . . . . . . . . Kernel-weighted local polynomial smoothing<br />
[R] sunflower . . . . . . . . . . . . . . . . . . . . . . . . . . . . . . . . Density-distribution sunflower plots<br />
Survival-analysis graphs<br />
[ST] ltable . . . . . . . . . . . . . . . . . . . . . . . . . . . . . . . . . . . . . . . . . . . Life tables for survival data<br />
[ST] stci . . . . . . . . . . . . . . Confidence intervals for means <strong>and</strong> percentiles of survival time<br />
[ST] stcox PH-assumption tests . . . . . . . . . . . . . . . Tests of proportional-hazards assumption<br />
[ST] stcurve . . . Plot survivor, hazard, cumulative hazard, or cumulative incidence function<br />
[ST] strate . . . . . . . . . . . . . . . . . . . . . . . . . . . . . . . . . . . . Tabulate failure rates <strong>and</strong> rate ratios<br />
[ST] sts graph . . . . . . . . . . . . . . . . . . . . Graph the survivor <strong>and</strong> cumulative hazard functions<br />
Time-series graphs<br />
[TS] corrgram . . . . . . . . . . . . . . . . . . . . . . . . . . . . . . . . . Tabulate <strong>and</strong> graph autocorrelations<br />
[TS] cumsp . . . . . . . . . . . . . . . . . . . . . . . . . . . . . . . . . . . . . . Cumulative spectral distribution<br />
[TS] fcast graph . . . . . . . . . . . . . . Graph forecasts of variables computed by fcast compute<br />
[TS] irf cgraph . . . . . Combine graphs of IRFs, dynamic-multiplier functions, <strong>and</strong> FEVDs<br />
[TS] irf graph . . . . . . . . . . . . . . . . . Graph IRFs, dynamic-multiplier functions, <strong>and</strong> FEVDs<br />
[TS] irf ograph . . . . . . . . . Graph overlaid IRFs, dynamic-multiplier functions, <strong>and</strong> FEVDs<br />
[TS] pergram . . . . . . . . . . . . . . . . . . . . . . . . . . . . . . . . . . . . . . . . . . . . . . . . . . . . . Periodogram<br />
[TS] tsline . . . . . . . . . . . . . . . . . . . . . . . . . . . . . . . . . . . . . . . . . . . . . . . . . Plot time-series data<br />
[TS] wntestb . . . . . . . . . . . . . . . . . . . . . . . Bartlett’s periodogram-based test for white noise<br />
[TS] xcorr . . . . . . . . . . . . . . . . . . . . . . . . . . . . . . Cross-correlogram for bivariate time series<br />
More statistical graphs<br />
[R] dotplot . . . . . . . . . . . . . . . . . . . . . . . . . . . . . . . . . . . . . . . . . . . . Comparative scatterplots<br />
[ST] epitab . . . . . . . . . . . . . . . . . . . . . . . . . . . . . . . . . . . . . . . . . . . Tables for epidemiologists<br />
[R] fracpoly postestimation . . . . . . . . . . . . . . . . . . . . . . . . Postestimation tools for fracpoly<br />
[R] grmeanby . . . . . . . . . . . . . . . . . . . . Graph means <strong>and</strong> medians by categorical variables<br />
[R] pkexamine . . . . . . . . . . . . . . . . . . . . . . . . . . . . . . . . Calculate pharmacokinetic measures<br />
[R] pksumm . . . . . . . . . . . . . . . . . . . . . . . . . . . . . . . . . . . Summarize pharmacokinetic data<br />
[R] stem . . . . . . . . . . . . . . . . . . . . . . . . . . . . . . . . . . . . . . . . . . . . . . . Stem-<strong>and</strong>-leaf displays<br />
[XT] xtline . . . . . . . . . . . . . . . . . . . . . . . . . . . . . . . . . . . . . . . . . . . . . . . . . Panel-data line plots<br />
Editing<br />
[G] graph editor . . . . . . . . . . . . . . . . . . . . . . . . . . . . . . . . . . . . . . . . . . . . . . . . . Graph Editor<br />
Graph utilities<br />
[G] set graphics . . . . . . . . . . . . . . . . . . . . . . . . . . . . . . . . . Set whether graphs are displayed<br />
[G] set printcolor . . . . . . . . . . . . . . . . Set how colors are treated when graphs are printed<br />
[G] set scheme . . . . . . . . . . . . . . . . . . . . . . . . . . . . . . . . . . . . . . . . . . . . . Set default scheme


![[U] User's Guide](https://img.yumpu.com/43415728/1/178x260/u-users-guide.jpg?quality=85)


![[P] Programming](https://img.yumpu.com/13808921/1/177x260/p-programming.jpg?quality=85)