

Stata Quick Reference and Index
Stata Quick Reference and Index
Stata Quick Reference and Index

You also want an ePaper? Increase the reach of your titles
YUMPU automatically turns print PDFs into web optimized ePapers that Google loves.
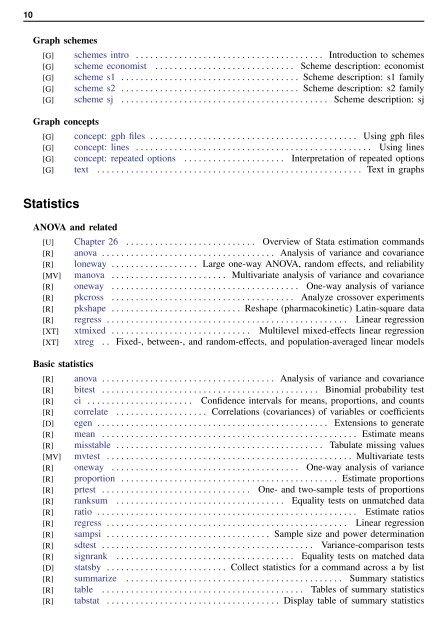
10<br />
Graph schemes<br />
[G] schemes intro . . . . . . . . . . . . . . . . . . . . . . . . . . . . . . . . . . . . . . . Introduction to schemes<br />
[G] scheme economist . . . . . . . . . . . . . . . . . . . . . . . . . . . . . Scheme description: economist<br />
[G] scheme s1 . . . . . . . . . . . . . . . . . . . . . . . . . . . . . . . . . . . . . Scheme description: s1 family<br />
[G] scheme s2 . . . . . . . . . . . . . . . . . . . . . . . . . . . . . . . . . . . . . Scheme description: s2 family<br />
[G] scheme sj . . . . . . . . . . . . . . . . . . . . . . . . . . . . . . . . . . . . . . . . . . . Scheme description: sj<br />
Graph concepts<br />
[G] concept: gph files . . . . . . . . . . . . . . . . . . . . . . . . . . . . . . . . . . . . . . . . . . . Using gph files<br />
[G] concept: lines . . . . . . . . . . . . . . . . . . . . . . . . . . . . . . . . . . . . . . . . . . . . . . . . . Using lines<br />
[G] concept: repeated options . . . . . . . . . . . . . . . . . . . . . Interpretation of repeated options<br />
[G] text . . . . . . . . . . . . . . . . . . . . . . . . . . . . . . . . . . . . . . . . . . . . . . . . . . . . . . . Text in graphs<br />
Statistics<br />
ANOVA <strong>and</strong> related<br />
[U] Chapter 26 . . . . . . . . . . . . . . . . . . . . . . . . . . . Overview of <strong>Stata</strong> estimation comm<strong>and</strong>s<br />
[R] anova . . . . . . . . . . . . . . . . . . . . . . . . . . . . . . . . . . . . Analysis of variance <strong>and</strong> covariance<br />
[R] loneway . . . . . . . . . . . . . . . . . . Large one-way ANOVA, r<strong>and</strong>om effects, <strong>and</strong> reliability<br />
[MV] manova . . . . . . . . . . . . . . . . . . . . . . . . Multivariate analysis of variance <strong>and</strong> covariance<br />
[R] oneway . . . . . . . . . . . . . . . . . . . . . . . . . . . . . . . . . . . . . . . One-way analysis of variance<br />
[R] pkcross . . . . . . . . . . . . . . . . . . . . . . . . . . . . . . . . . . . . . . Analyze crossover experiments<br />
[R] pkshape . . . . . . . . . . . . . . . . . . . . . . . . . . . Reshape (pharmacokinetic) Latin-square data<br />
[R] regress . . . . . . . . . . . . . . . . . . . . . . . . . . . . . . . . . . . . . . . . . . . . . . . . . . Linear regression<br />
[XT] xtmixed . . . . . . . . . . . . . . . . . . . . . . . . . . . . . Multilevel mixed-effects linear regression<br />
[XT] xtreg . . Fixed-, between-, <strong>and</strong> r<strong>and</strong>om-effects, <strong>and</strong> population-averaged linear models<br />
Basic statistics<br />
[R] anova . . . . . . . . . . . . . . . . . . . . . . . . . . . . . . . . . . . . Analysis of variance <strong>and</strong> covariance<br />
[R] bitest . . . . . . . . . . . . . . . . . . . . . . . . . . . . . . . . . . . . . . . . . . . . . Binomial probability test<br />
[R] ci . . . . . . . . . . . . . . . . . . . . . . Confidence intervals for means, proportions, <strong>and</strong> counts<br />
[R] correlate . . . . . . . . . . . . . . . . . . . Correlations (covariances) of variables or coefficients<br />
[D] egen . . . . . . . . . . . . . . . . . . . . . . . . . . . . . . . . . . . . . . . . . . . . . . . . Extensions to generate<br />
[R] mean . . . . . . . . . . . . . . . . . . . . . . . . . . . . . . . . . . . . . . . . . . . . . . . . . . . . . Estimate means<br />
[R] misstable . . . . . . . . . . . . . . . . . . . . . . . . . . . . . . . . . . . . . . . . . . . Tabulate missing values<br />
[MV] mvtest . . . . . . . . . . . . . . . . . . . . . . . . . . . . . . . . . . . . . . . . . . . . . . . . . . . Multivariate tests<br />
[R] oneway . . . . . . . . . . . . . . . . . . . . . . . . . . . . . . . . . . . . . . . One-way analysis of variance<br />
[R] proportion . . . . . . . . . . . . . . . . . . . . . . . . . . . . . . . . . . . . . . . . . . . . . Estimate proportions<br />
[R] prtest . . . . . . . . . . . . . . . . . . . . . . . . . . . . . . . One- <strong>and</strong> two-sample tests of proportions<br />
[R] ranksum . . . . . . . . . . . . . . . . . . . . . . . . . . . . . . . . . . . Equality tests on unmatched data<br />
[R] ratio . . . . . . . . . . . . . . . . . . . . . . . . . . . . . . . . . . . . . . . . . . . . . . . . . . . . . . Estimate ratios<br />
[R] regress . . . . . . . . . . . . . . . . . . . . . . . . . . . . . . . . . . . . . . . . . . . . . . . . . . Linear regression<br />
[R] sampsi . . . . . . . . . . . . . . . . . . . . . . . . . . . . . . . . . . Sample size <strong>and</strong> power determination<br />
[R] sdtest . . . . . . . . . . . . . . . . . . . . . . . . . . . . . . . . . . . . . . . . . . . . Variance-comparison tests<br />
[R] signrank . . . . . . . . . . . . . . . . . . . . . . . . . . . . . . . . . . . . . Equality tests on matched data<br />
[D] statsby . . . . . . . . . . . . . . . . . . . . . . . . . Collect statistics for a comm<strong>and</strong> across a by list<br />
[R] summarize . . . . . . . . . . . . . . . . . . . . . . . . . . . . . . . . . . . . . . . . . . . . . Summary statistics<br />
[R] table . . . . . . . . . . . . . . . . . . . . . . . . . . . . . . . . . . . . . . . . . . Tables of summary statistics<br />
[R] tabstat . . . . . . . . . . . . . . . . . . . . . . . . . . . . . . . . . . . . Display table of summary statistics
![[U] User's Guide](https://img.yumpu.com/43415728/1/178x260/u-users-guide.jpg?quality=85)

![[P] Programming](https://img.yumpu.com/13808921/1/177x260/p-programming.jpg?quality=85)