

Stata Quick Reference and Index
Stata Quick Reference and Index
Stata Quick Reference and Index

Create successful ePaper yourself
Turn your PDF publications into a flip-book with our unique Google optimized e-Paper software.
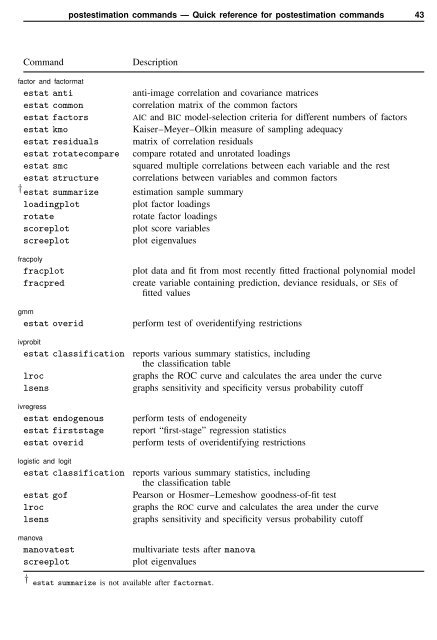
postestimation comm<strong>and</strong>s — <strong>Quick</strong> reference for postestimation comm<strong>and</strong>s 43<br />
Comm<strong>and</strong><br />
Description<br />
factor <strong>and</strong> factormat<br />
estat anti<br />
anti-image correlation <strong>and</strong> covariance matrices<br />
estat common<br />
correlation matrix of the common factors<br />
estat factors<br />
AIC <strong>and</strong> BIC model-selection criteria for different numbers of factors<br />
estat kmo<br />
Kaiser–Meyer–Olkin measure of sampling adequacy<br />
estat residuals matrix of correlation residuals<br />
estat rotatecompare compare rotated <strong>and</strong> unrotated loadings<br />
estat smc<br />
squared multiple correlations between each variable <strong>and</strong> the rest<br />
estat structure correlations between variables <strong>and</strong> common factors<br />
† estat summarize estimation sample summary<br />
loadingplot<br />
plot factor loadings<br />
rotate<br />
rotate factor loadings<br />
scoreplot<br />
plot score variables<br />
screeplot<br />
plot eigenvalues<br />
fracpoly<br />
fracplot<br />
fracpred<br />
gmm<br />
estat overid<br />
ivprobit<br />
estat classification<br />
lroc<br />
lsens<br />
ivregress<br />
estat endogenous<br />
estat firststage<br />
estat overid<br />
logistic <strong>and</strong> logit<br />
estat classification<br />
estat gof<br />
lroc<br />
lsens<br />
manova<br />
manovatest<br />
screeplot<br />
plot data <strong>and</strong> fit from most recently fitted fractional polynomial model<br />
create variable containing prediction, deviance residuals, or SEs of<br />
fitted values<br />
perform test of overidentifying restrictions<br />
reports various summary statistics, including<br />
the classification table<br />
graphs the ROC curve <strong>and</strong> calculates the area under the curve<br />
graphs sensitivity <strong>and</strong> specificity versus probability cutoff<br />
perform tests of endogeneity<br />
report “first-stage” regression statistics<br />
perform tests of overidentifying restrictions<br />
reports various summary statistics, including<br />
the classification table<br />
Pearson or Hosmer–Lemeshow goodness-of-fit test<br />
graphs the ROC curve <strong>and</strong> calculates the area under the curve<br />
graphs sensitivity <strong>and</strong> specificity versus probability cutoff<br />
multivariate tests after manova<br />
plot eigenvalues<br />
† estat summarize is not available after factormat.
![[U] User's Guide](https://img.yumpu.com/43415728/1/178x260/u-users-guide.jpg?quality=85)


![[P] Programming](https://img.yumpu.com/13808921/1/177x260/p-programming.jpg?quality=85)