PDF - John Wayne Airport
PDF - John Wayne Airport
PDF - John Wayne Airport

You also want an ePaper? Increase the reach of your titles
YUMPU automatically turns print PDFs into web optimized ePapers that Google loves.
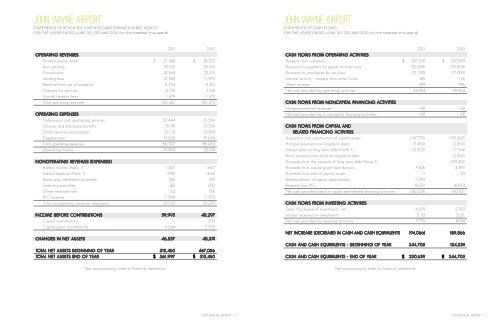
JOHN WAYNE AIRPORT<br />
Statements of revenues, Expenses and changes in net assets<br />
For the Years Ended June 30, 2011 and 2010 (to the nearest thousand)<br />
JOHN WAYNE AIRPORT<br />
Statements of cash flows<br />
For the Years Ended June 30, 2011 and 2010 (to the nearest thousand)<br />
2011 2010<br />
OPERATING REVENUES<br />
Terminal space rental $ 21,562 $ 24,572<br />
Auto parking 35,512 35,516<br />
Concessions 24,268 23,515<br />
Landing fees 12,369 11,970<br />
Revenue from use of property 8,554 8,410<br />
Charges for services 2,718 3,018<br />
Aircraft tiedown fees 1,479 1,472<br />
Total operating revenues 106,462 108,473<br />
OPERATING EXPENSES<br />
Professional and specialized services 33,444 31,564<br />
Salaries and employee benefits 18,118 17,334<br />
Other services and supplies 19,110 19,873<br />
Depreciation 15,830 19,684<br />
Total operating expenses 86,502 88,455<br />
Operating income 19,960 20,018<br />
NONOPERATING REVENUES (EXPENSES)<br />
Interest income (Note 1) 1,857 1,667<br />
Interest expense (Note 1) (292) (344)<br />
Bankruptcy settlement proceeds 562 619<br />
Fines and penalties 242 200<br />
Other revenues (net) 65 158<br />
PFC revenue 17,599 17,979<br />
Total nonoperating revenues (expenses) 20,033 20,279<br />
INCOME BEFORE CONTRIBUTIONS 39,993 40,297<br />
Capital contributions -- 370<br />
Capital grant contributions 6,544 7,707<br />
CHANGES IN NET ASSETS 46,537 48,374<br />
TOTAL NET ASSETS BEGINNING OF YEAR 515,460 467,086<br />
TOTAL NET ASSETS END OF YEAR $ 561,997 $ 515,460<br />
2011 2010<br />
CASH FLOWS FROM OPERATING ACTIVITIES<br />
Receipts from customers $ 107,268 $ 107,083<br />
Payments to suppliers for goods and services (52,208) (50,808)<br />
Payments to employees for services (21,130) (17,095)<br />
Internal activity - receipts from other funds 185 (13)<br />
Other receipts 789 796<br />
Net cash provided by operating activities 34,904 39,963<br />
CASH FLOWS FROM NONCAPITAL FINANCING ACTIVITIES<br />
Intergovernmental revenues 68 68<br />
Net cash provided by in noncapital financing activities 68 68<br />
CASH FLOWS FROM CAPITAL AND<br />
RELATED FINANCING ACTIVITIES<br />
Acquisition and construction of capital assets (147,725) (101,862)<br />
Principal payments on long-term debt (7,460) (2,865)<br />
Interest paid on long-term debt (Note 1) (12,905) (7,164)<br />
Bond issuance costs paid on long-term debt -- (2,060)<br />
Proceeds from the issuance of long-term debt (Note 5) -- 233,402<br />
Proceeds from capital grant contributions 7,626 3,397<br />
Proceeds from sale of capital assets 11 20<br />
Reimbursement of capital expenditures 5,593 --<br />
Receipts from PFC 18,031 18,053<br />
Net cash provided (used) in capital and related financing activities (136,829) 140,921<br />
CASH FLOWS FROM INVESTING ACTIVITIES<br />
Sales (Purchases) of investments, net 4,679 5,393<br />
Interest received on investments 3,112 3,521<br />
Net cash provided by investing activities 7,791 8,914<br />
NET INCREASE (DECREASE) IN CASH AND CASH EQUIVALENTS (94,066) 189,866<br />
CASH AND CASH EQUIVALENTS - BEGINNING OF YEAR 344,705 154,839<br />
CASH AND CASH EQUIVALENTS - END OF YEAR $ 250,639 $ 344,705<br />
See accompanying notes to financial statements.<br />
See accompanying notes to financial statements.<br />
2011 ANNUAL REPORT > 6 2011 ANNUAL REPORT > 7