Agriculture and Farmland Protection Plan - Town of Liberty
Agriculture and Farmland Protection Plan - Town of Liberty
Agriculture and Farmland Protection Plan - Town of Liberty
You also want an ePaper? Increase the reach of your titles
YUMPU automatically turns print PDFs into web optimized ePapers that Google loves.
Draft <strong>Town</strong> <strong>of</strong> <strong>Liberty</strong> <strong>Agriculture</strong> <strong>and</strong> Farml<strong>and</strong> <strong>Protection</strong> <strong>Plan</strong><br />
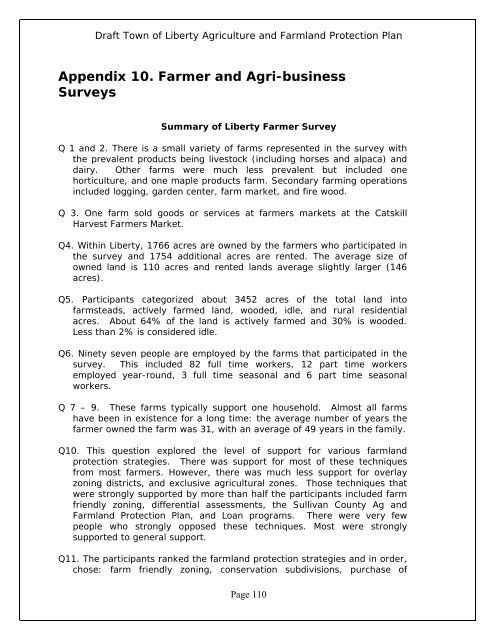
Appendix 10. Farmer <strong>and</strong> Agri-business<br />
Surveys<br />
Summary <strong>of</strong> <strong>Liberty</strong> Farmer Survey<br />
Q 1 <strong>and</strong> 2. There is a small variety <strong>of</strong> farms represented in the survey with<br />
the prevalent products being livestock (including horses <strong>and</strong> alpaca) <strong>and</strong><br />
dairy. Other farms were much less prevalent but included one<br />
horticulture, <strong>and</strong> one maple products farm. Secondary farming operations<br />
included logging, garden center, farm market, <strong>and</strong> fire wood.<br />
Q 3. One farm sold goods or services at farmers markets at the Catskill<br />
Harvest Farmers Market.<br />
Q4. Within <strong>Liberty</strong>, 1766 acres are owned by the farmers who participated in<br />
the survey <strong>and</strong> 1754 additional acres are rented. The average size <strong>of</strong><br />
owned l<strong>and</strong> is 110 acres <strong>and</strong> rented l<strong>and</strong>s average slightly larger (146<br />
acres).<br />
Q5. Participants categorized about 3452 acres <strong>of</strong> the total l<strong>and</strong> into<br />
farmsteads, actively farmed l<strong>and</strong>, wooded, idle, <strong>and</strong> rural residential<br />
acres. About 64% <strong>of</strong> the l<strong>and</strong> is actively farmed <strong>and</strong> 30% is wooded.<br />
Less than 2% is considered idle.<br />
Q6. Ninety seven people are employed by the farms that participated in the<br />
survey. This included 82 full time workers, 12 part time workers<br />
employed year-round, 3 full time seasonal <strong>and</strong> 6 part time seasonal<br />
workers.<br />
Q 7 – 9. These farms typically support one household. Almost all farms<br />
have been in existence for a long time: the average number <strong>of</strong> years the<br />
farmer owned the farm was 31, with an average <strong>of</strong> 49 years in the family.<br />
Q10. This question explored the level <strong>of</strong> support for various farml<strong>and</strong><br />
protection strategies. There was support for most <strong>of</strong> these techniques<br />
from most farmers. However, there was much less support for overlay<br />
zoning districts, <strong>and</strong> exclusive agricultural zones. Those techniques that<br />
were strongly supported by more than half the participants included farm<br />
friendly zoning, differential assessments, the Sullivan County Ag <strong>and</strong><br />
Farml<strong>and</strong> <strong>Protection</strong> <strong>Plan</strong>, <strong>and</strong> Loan programs. There were very few<br />
people who strongly opposed these techniques. Most were strongly<br />
supported to general support.<br />
Q11. The participants ranked the farml<strong>and</strong> protection strategies <strong>and</strong> in order,<br />
chose: farm friendly zoning, conservation subdivisions, purchase <strong>of</strong><br />
Page 110


