posudzovanie vplyvu automobilovej dopravy na ... - Žilinská univerzita
posudzovanie vplyvu automobilovej dopravy na ... - Žilinská univerzita
posudzovanie vplyvu automobilovej dopravy na ... - Žilinská univerzita

Create successful ePaper yourself
Turn your PDF publications into a flip-book with our unique Google optimized e-Paper software.
C O M M U N I C A T I O N S<br />
I S<br />
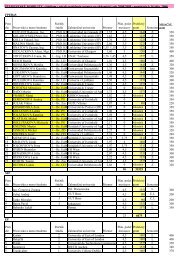
Priemerná častosť smerov vetrov za rok v % Tab. 3<br />
Stanica S SV V JV J JZ Z SZ Rých. vetra<br />
Dolný Hričov 14,9 10,4 9,7 11,1 13,4 13,9 13,1 13,5 0,9 m/s<br />
Očakávané vplyvy <strong>dopravy</strong> v meste<br />
Pri modelovaní znečistenia ovzdušia boli posudzované množstvá<br />
celkovej produkcie znečisťujúcich látok do ovzdušia (t/rok)<br />
od celodennej 24-hodinovej <strong>dopravy</strong>, taktiež boli porovnávané koncentrácie<br />
oxidov dusíka NO x (g/m 3 ) <strong>na</strong> jednotlivých <strong>na</strong>jviac zaťažených<br />
úsekoch komunikačného systému mesta, vznikajúce od<br />
priemernej dennej intenzity <strong>dopravy</strong> a boli porov<strong>na</strong>né s prípustnou<br />
priemernou dennou koncentráciou NO x , ktorá je 100 g/m 3 .<br />
Na základe matematického modelovania [8] pre roky 2000<br />
a 2015 bolo, zistené, že v meste Žili<strong>na</strong> sa od <strong>automobilovej</strong> <strong>dopravy</strong><br />
pre rok 2000 vyprodukovalo v priemere 660,01 kg NO x za deň, čo je<br />
v prepočte 240 t/rok. Z toho 132,9 t/rok (55 %) vyprodukovala osobná<br />
doprava. Pre rok 2015 sa predpokladá, že automobilová doprava<br />
vyprodukuje 575,45kg NO x za deň, čo je v prepočte 210 t/rok.<br />
Z toho 107 t/rok (51 %) vyprodukuje osobná doprava. Maximál<strong>na</strong><br />
predpokladaná denná koncentrácia NO x v roku 2015 by po dobudovaní<br />
plánovaných komunikácií nemala prekročiť 15 g/m 3 .<br />
Average frequency of wind direction in one year [%] Table 3<br />
Station N NE E SE S SW W NW Wind veloc.<br />
Dolný Hričov 14.9 10.4 9.7 11.1 13.4 13.9 13.1 13.5 0.9 m/s<br />
Expected Effects of the Traffic in the City<br />
In the air pollution modeling, the amounts of the total production<br />
of pollutants into the air (t/year) were evaluated as based<br />
on the all-day long 24-hour traffic, and concentrations of nitrogen<br />
oxides NO x (g/m 3 ) at the sections with the highest traffic<br />
volumes that origi<strong>na</strong>te from the average daily traffic were compared<br />
and these were compared to the permitted daily concentration of<br />
NOx, which is 100 g/m 3 .<br />
Based on the mathematical modeling [8] for 2000 and 2015,<br />
it was found out that in the city of Žili<strong>na</strong> the traffic produced<br />
660.01 kg of NO x per day in 2000, equal to 240 t/year. Out of this<br />
volume 132.9 t/year (55 %) was produced by individual traffic. In<br />
2015 it is expected that vehicles will produce 575.45 kg of NO x per<br />
day, what equals to 210 t/year. Out of this volume 107 t/year (51 %)<br />
will be produced by individual traffic. Maximal assumed daily<br />
concentration of NO x in 2015 after the planned communications<br />
are constructed should not exceed 15 g/m 3 .<br />
Obr. 15 Znázornenie priemernej dennej koncentrácie NO x<br />
v meste Žili<strong>na</strong> pre rok 2000<br />
Fig. 15 Average daily concentrations of NO x in Žili<strong>na</strong> in 2000<br />
Obr. 16 Znázornenie priemernej dennej koncentrácie NO x<br />
v meste Žili<strong>na</strong> pre rok 2015<br />
Fig. 16 Average daily concentrations of NO x in Žili<strong>na</strong> in 2015<br />
7. Záver<br />
Ukážkou výsledkov pomocou matematického modelu chceme<br />
<strong>na</strong>z<strong>na</strong>čiť široké možnosti využitia.<br />
V príspevku nie je priestor <strong>na</strong> prezentovanie celej šírky získaných<br />
údajov z alter<strong>na</strong>tívnych riešení modelu.<br />
Kvalita a čistota ovzdušia sa stali vážnym problémom pri <strong>na</strong>vrhovaní<br />
dopravných sietí v regiónoch i mimo nich, pri organizovaní<br />
<strong>dopravy</strong> aj územnom plánovaní.<br />
7. Conclusion<br />
The demonstration of the results obtained through the mathematical<br />
model is meant to indicate a wide range of its utilization.<br />
The length of the article does not allow us to present the whole<br />
scope of the data acquired from alter<strong>na</strong>tive model solutions.<br />
Quality and cleanliness of the air have become a serious<br />
problem in projecting transport networks within and beyond regions,<br />
in transport organization and territorial planning.<br />
14 ● KOMUNIKÁCIE / COMMUNICATIONS 1/2003