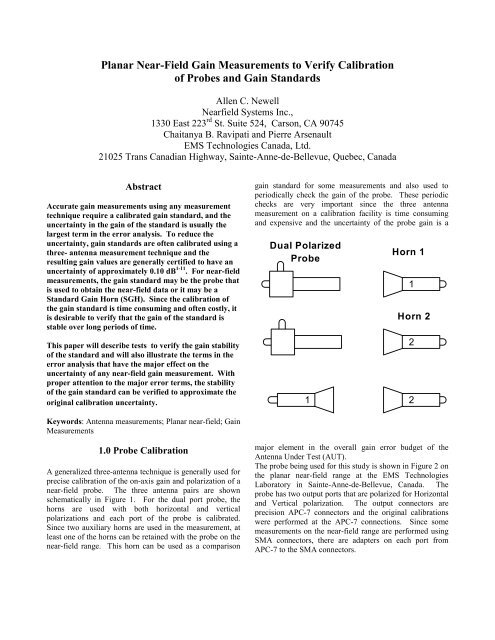
Planar Near-Field Gain Measurements to Verify Calibration of ...
Planar Near-Field Gain Measurements to Verify Calibration of ...
Planar Near-Field Gain Measurements to Verify Calibration of ...

You also want an ePaper? Increase the reach of your titles
YUMPU automatically turns print PDFs into web optimized ePapers that Google loves.
<strong>Planar</strong> <strong>Near</strong>-<strong>Field</strong> <strong>Gain</strong> <strong>Measurements</strong> <strong>to</strong> <strong>Verify</strong> <strong>Calibration</strong><br />
<strong>of</strong> Probes and <strong>Gain</strong> Standards<br />
Allen C. Newell<br />
<strong>Near</strong>field Systems Inc.,<br />
1330 East 223 rd St. Suite 524, Carson, CA 90745<br />
Chaitanya B. Ravipati and Pierre Arsenault<br />
EMS Technologies Canada, Ltd.<br />
21025 Trans Canadian Highway, Sainte-Anne-de-Bellevue, Quebec, Canada<br />
Abstract<br />
Accurate gain measurements using any measurement<br />
technique require a calibrated gain standard, and the<br />
uncertainty in the gain <strong>of</strong> the standard is usually the<br />
largest term in the error analysis. To reduce the<br />
uncertainty, gain standards are <strong>of</strong>ten calibrated using a<br />
three- antenna measurement technique and the<br />
resulting gain values are generally certified <strong>to</strong> have an<br />
uncertainty <strong>of</strong> approximately 0.10 dB 1-11 . For near-field<br />
measurements, the gain standard may be the probe that<br />
is used <strong>to</strong> obtain the near-field data or it may be a<br />
Standard <strong>Gain</strong> Horn (SGH). Since the calibration <strong>of</strong><br />
the gain standard is time consuming and <strong>of</strong>ten costly, it<br />
is desirable <strong>to</strong> verify that the gain <strong>of</strong> the standard is<br />
stable over long periods <strong>of</strong> time.<br />
This paper will describe tests <strong>to</strong> verify the gain stability<br />
<strong>of</strong> the standard and will also illustrate the terms in the<br />
error analysis that have the major effect on the<br />
uncertainty <strong>of</strong> any near-field gain measurement. With<br />
proper attention <strong>to</strong> the major error terms, the stability<br />
<strong>of</strong> the gain standard can be verified <strong>to</strong> approximate the<br />
original calibration uncertainty.<br />
Keywords: Antenna measurements; <strong>Planar</strong> near-field; <strong>Gain</strong><br />
<strong>Measurements</strong><br />
1.0 Probe <strong>Calibration</strong><br />
A generalized three-antenna technique is generally used for<br />
precise calibration <strong>of</strong> the on-axis gain and polarization <strong>of</strong> a<br />
near-field probe. The three antenna pairs are shown<br />
schematically in Figure 1. For the dual port probe, the<br />
horns are used with both horizontal and vertical<br />
polarizations and each port <strong>of</strong> the probe is calibrated.<br />
Since two auxiliary horns are used in the measurement, at<br />
least one <strong>of</strong> the horns can be retained with the probe on the<br />
near-field range. This horn can be used as a comparison<br />
gain standard for some measurements and also used <strong>to</strong><br />
periodically check the gain <strong>of</strong> the probe. These periodic<br />
checks are very important since the three antenna<br />
measurement on a calibration facility is time consuming<br />
and expensive and the uncertainty <strong>of</strong> the probe gain is a<br />
Dual Polarized<br />
Probe<br />
1<br />
Horn 1<br />
Horn 2<br />
Figure 1 Schematic <strong>of</strong> three-antenna calibration <strong>of</strong><br />
dual port probe and standard gain horns.<br />
major element in the overall gain error budget <strong>of</strong> the<br />
Antenna Under Test (AUT).<br />
The probe being used for this study is shown in Figure 2 on<br />
the planar near-field range at the EMS Technologies<br />
Labora<strong>to</strong>ry in Sainte-Anne-de-Bellevue, Canada. The<br />
probe has two output ports that are polarized for Horizontal<br />
and Vertical polarization. The output connec<strong>to</strong>rs are<br />
precision APC-7 connec<strong>to</strong>rs and the original calibrations<br />
were performed at the APC-7 connections. Since some<br />
measurements on the near-field range are performed using<br />
SMA connec<strong>to</strong>rs, there are adapters on each port from<br />
APC-7 <strong>to</strong> the SMA connec<strong>to</strong>rs.<br />
1<br />
2<br />
2
eference standard for these tests, and it is assumed that the<br />
gain <strong>of</strong> the horn has not changed since it was calibrated.<br />
The horn is a simple stable structure and if it is not<br />
damaged, the gain should remain constant. The electrical<br />
properties <strong>of</strong> the waveguide-<strong>to</strong>-coax adapter could change<br />
over time, but if it did, the input impedance would also<br />
change. The reflection coefficients <strong>of</strong> both the horn and<br />
the probe were measured and found <strong>to</strong> be nearly identical<br />
<strong>to</strong> the calibrated values.<br />
Figure 2 Dual-port probe on near-field range<br />
showing output connec<strong>to</strong>rs.<br />
The results <strong>of</strong> the three-antenna calibration are shown in<br />
Figure 3 and similar results were provided for a Standard<br />
<strong>Gain</strong> Horn (SGH) with an adapter from waveguide <strong>to</strong> APC-<br />
7 coax. The estimated uncertainty as shown by the error<br />
bars was ± 0.05 dB. The goal <strong>of</strong> the following<br />
measurements is <strong>to</strong> determine whether or not the gain <strong>of</strong><br />
the probe has changed by more than the estimated<br />
uncertainty <strong>of</strong> the original calibration.<br />
2.0 Measurement Approach<br />
The SGH that was calibrated with the probe is used as the<br />
8.3<br />
8.2<br />
Dual Port Probe <strong>Gain</strong> <strong>Calibration</strong><br />
Vertical Port<br />
Horizontal Port<br />
The SGH was mounted on the planar near-field range at the<br />
EMS Technologies Labora<strong>to</strong>ry in Sainte-Anne-de-<br />
Bellevue, Canada and the dual port probe was mounted on<br />
the probe carriage as shown in Figure 2. <strong>Planar</strong> near-field<br />
measurements were then performed with the horn polarized<br />
in the X or horizontal direction. The dual port probe was<br />
used <strong>to</strong> measure both the main and cross component nearfield<br />
data and the frequency was stepped over 9 frequencies<br />
identified by the location <strong>of</strong> the error bars in Figure 3. A<br />
sample <strong>of</strong> the near-field amplitude near the center <strong>of</strong> the X<br />
Relative Amplitude in dB<br />
0<br />
-10<br />
-20<br />
-30<br />
-40<br />
-50<br />
H-Cut for Y = 0<br />
V-Cut for X=0<br />
Probe <strong>Gain</strong> in dB<br />
8.1<br />
8<br />
7.9<br />
7.8<br />
7.7<br />
5.34 5.36 5.38 5.4 5.42 5.44 5.46<br />
Frequency in GHz<br />
Figure 3 <strong>Gain</strong> calibration curves for dual port<br />
probe measured at APC-7 connec<strong>to</strong>rs.<br />
-60<br />
-40 -20 0 20 40<br />
Probe X or Y Position in Inches<br />
Figure 4 Sample near-field amplitude data near X<br />
and Y centerlines for SGH .<br />
and Y scans is shown in Figure 4.<br />
The horn was then rotated about its axis by 90 degrees <strong>to</strong><br />
produce a Y or vertically polarized AUT. The near field<br />
scans were then repeated for the new orientation.<br />
At the completion <strong>of</strong> each <strong>of</strong> the two near-field<br />
measurements, the input cable was removed from the SGH<br />
and the output cables were removed from the probe ports.<br />
The input cable was then connected <strong>to</strong> each <strong>of</strong> the probe<br />
output cables <strong>to</strong> obtain the “Direct Connect” reading. This<br />
Direct Connect reading is essentially a calibration <strong>of</strong> the<br />
input signal level <strong>to</strong> the AUT and is required for the direct
gain calculations. The cables were reconnected <strong>to</strong> their<br />
original positions and the probe was returned <strong>to</strong> the<br />
reference center position where a reading <strong>of</strong> the near-field<br />
peak amplitude was recorded. This process was repeated a<br />
number <strong>of</strong> times <strong>to</strong> verify that the connec<strong>to</strong>rs were all<br />
repeatable, the flexible cable was not causing a signal level<br />
change, and the source power level was stable. The<br />
receiver was set for a long averaging time, and a number <strong>of</strong><br />
readings were recorded for each connection combination.<br />
The repeat readings with the APC-7 connec<strong>to</strong>rs were<br />
within 0.01 dB for all frequencies and ports.<br />
Using the near-field data and the direct connect results, the<br />
measurement s<strong>of</strong>tware calculated the peak far-field gain <strong>of</strong><br />
the SGH at each frequency and polarization. The s<strong>of</strong>tware<br />
calculates the gain using the equation<br />
r<br />
δδ<br />
G K M<br />
a<br />
( )<br />
∑<br />
B'<br />
−<br />
( P ) e<br />
p( 0 )<br />
2<br />
⎛4π<br />
⎞ x y 0 j<br />
0<br />
= ⎜ 2 ⎟<br />
2<br />
⎝ λ ⎠ '<br />
n<br />
r<br />
r<br />
a G K<br />
r r 2<br />
iK0<br />
• P j<br />
r (1)<br />
where G a ( K 0<br />
) is the gain <strong>of</strong> the antenna in the direction<br />
defined by the k-space vec<strong>to</strong>r<br />
r<br />
K 0<br />
; l is the wavelength; M<br />
is a mismatch fac<strong>to</strong>r involving the complex reflection<br />
coefficients <strong>of</strong> the antenna, probe, genera<strong>to</strong>r and load ports;<br />
d x and d y are the data point increments <strong>of</strong> the near field<br />
r<br />
data; B 0<br />
' di P j<br />
is the normalized near-field data at the<br />
r<br />
positions denoted by P j<br />
; a' n<br />
the normalized input <strong>to</strong> the<br />
r<br />
AUT; and GpdK0iis the gain <strong>of</strong> the probe. The measured<br />
data and the input amplitude a' n<br />
must use the same<br />
normalization, and in this case the normalization was with<br />
respect <strong>to</strong> the receiver reference.<br />
For the measurements described here where the goal is <strong>to</strong><br />
verify the gain <strong>of</strong> the probe, the AUT and probe gains are<br />
interchanged in Equation (1) <strong>to</strong> give the probe gain in terms<br />
<strong>of</strong> the SGH gain as the standard.<br />
P<br />
( )<br />
r<br />
−<br />
( P ) e<br />
( )<br />
r 2<br />
iK<br />
2<br />
0•<br />
P<br />
'<br />
j<br />
⎛4π<br />
⎞<br />
δδ<br />
x y∑<br />
B<br />
0 j<br />
0<br />
= ⎜ 2 ⎟<br />
2<br />
⎝ λ ⎠ a'<br />
n<br />
GSGH K0<br />
r<br />
G K M<br />
The four measurement fac<strong>to</strong>rs involved in the gain<br />
calculation are then,<br />
r<br />
r (2)<br />
1- The gain <strong>of</strong> the SGH.<br />
2- The input <strong>to</strong> the AUT referred <strong>to</strong> as the Direct<br />
Connect reading.<br />
3- The mismatch correction.<br />
4- The absolute value <strong>of</strong> the sum <strong>of</strong> the measured<br />
data determined by the FFT and referred <strong>to</strong> as the<br />
“Far-<strong>Field</strong> Peak”.<br />
⎡<br />
r<br />
FFP = 10log ⎢δδ<br />
x y∑<br />
B0<br />
' Pj<br />
e<br />
⎢ j<br />
⎣<br />
r<br />
− 0<br />
( )<br />
2<br />
r<br />
iK • P j<br />
⎤<br />
⎥<br />
⎥<br />
⎦<br />
(3)<br />
3.0 Measurement Results and Uncertainties<br />
The estimated uncertainty in the gain results will depend on<br />
the estimated uncertainty in each <strong>of</strong> these four measured<br />
quantities and these are all included in the NIST 18 term<br />
Error Budget shown in the following table. The terms are<br />
rearranged from numerical order <strong>to</strong> place the major terms<br />
at the <strong>to</strong>p <strong>of</strong> the table and in the approximate order <strong>of</strong><br />
description in the following discussion.<br />
SGH <strong>Gain</strong>. In most measurements, the uncertainty in the<br />
gain <strong>of</strong> the standard is a major contribu<strong>to</strong>r <strong>to</strong> the <strong>to</strong>tal error<br />
budget. In this case we are assuming that the gain <strong>of</strong> the<br />
Table 1 <strong>Gain</strong> Error Terms<br />
Term #<br />
Error Source<br />
Uncertainty<br />
dB<br />
3SGH gain 0.02<br />
5Direct Connect 0.05<br />
6Impedance mismatch fac<strong>to</strong>r 0.03<br />
Error Sources for Far-<strong>Field</strong> Peak<br />
12Multiple reflections (probe/AUT) 0.10<br />
13Receiver amplitude non-linearity 0.02<br />
9Measurement area truncation 0.02<br />
14System phase error due <strong>to</strong>: 0.01<br />
Receiver phase errors<br />
Flexing cables/rotary joints<br />
Temperature effects<br />
10Probe x, y-position errors 0.01<br />
11Probe z-position errors 0.01<br />
16Room scattering 0.02<br />
17Leakage and cross talk 0.01<br />
15Receiver dynamic range 0.01<br />
18Random errors in amplitude/phase 0.02<br />
8Data point spacing (aliasing) 0.01<br />
1Probe relative pattern 0.00<br />
2Probe polarization ratio 0.00<br />
4Probe alignment error 0.00<br />
7AUT alignment error 0.00<br />
RSS Combination 0.13
horn has not changed and the goal is <strong>to</strong> measure the change<br />
in the gain <strong>of</strong> the probe with respect <strong>to</strong> the SGH gain. The<br />
uncertainty in this case is the estimated possible change in<br />
the gain <strong>of</strong> the SGH and this is assumed <strong>to</strong> be 0.02 dB<br />
based on the assumed mechanical stability.<br />
8.4<br />
8.3<br />
Horizontal Port Probe <strong>Gain</strong>, APC-7<br />
Original <strong>Calibration</strong><br />
<strong>Near</strong>-<strong>Field</strong> Results, 2000<br />
Direct Connect. The uncertainty <strong>of</strong> the Direct Connect<br />
reading is due <strong>to</strong> the non-repeatability <strong>of</strong> the connec<strong>to</strong>rs,<br />
the change in loss <strong>of</strong> the cable when flexed, the nonlinearity<br />
<strong>of</strong> the receiver and the drift <strong>of</strong> the signal source.<br />
These contributions were estimated <strong>to</strong> be 0.05 dB.<br />
Mismatch Correction. The complete mismatch correction<br />
is given by the equation,<br />
|1 −Γ Γ | |1 −Γ Γ |<br />
M =<br />
|1 −Γ Γ | 1 −| Γ | 1 −| Γ |<br />
2 2<br />
L P G A<br />
2 2 2<br />
G L A P<br />
( )( )<br />
In the above equation, ΓA, ΓP, ΓG, and Γ<br />
L<br />
are<br />
respectively the complex reflection coefficients for the<br />
AUT, the probe, the “genera<strong>to</strong>r” cable connected <strong>to</strong> the<br />
AUT and the ”load” cable connected <strong>to</strong> the probe. The<br />
mismatch correction will be different for the H and V ports<br />
<strong>of</strong> the probe and this difference is included in all<br />
calculations.<br />
In many gain measurements on both near and far-field<br />
ranges, the mismatch term is ignored and assumed <strong>to</strong> be<br />
small enough <strong>to</strong> neglect. This is generally not the case, and<br />
even for the current measurement where all the components<br />
were carefully chosen the mismatch correction at some<br />
Amplitude (dB)<br />
0.1<br />
0.0<br />
-0.1<br />
-0.2<br />
-0.3<br />
-0.4<br />
-0.5<br />
-0.6<br />
-0.7<br />
-0.8<br />
-0.9<br />
Figure 5 Far-<strong>Field</strong> patterns near beam peak<br />
showing effect <strong>of</strong> multiple reflections.<br />
(4)<br />
Multipath Test Results for Standard <strong>Gain</strong> Horn and Dual Probe<br />
Z0 = 7.85 Wavelengths, LM = 1 Wavelength, F = 5.455 GHz<br />
Z0 Z0+LM/8 Z0+LM/4 Z0+3LM/8 Z0+LM/2<br />
-1.0<br />
-5 -4 -3 -2 -1 0 1 2 3 4 5<br />
Elevation (deg)<br />
Probe <strong>Gain</strong> in dB<br />
8.2<br />
8.1<br />
8<br />
7.9<br />
7.8<br />
5.34 5.36 5.38 5.4 5.42 5.44 5.46<br />
Frequency in GHz<br />
Figure 6 Comparison <strong>of</strong> Horizontal Port Probe gain<br />
from calibration and 2000 near-field measurements.<br />
frequencies was at least 0.50 dB. This is typical <strong>of</strong> most<br />
measurement setups, and without any mismatch data, the<br />
uncertainty would then be 0.50 dB. By measuring the<br />
complex reflection coefficients <strong>of</strong> all components at all the<br />
frequencies the uncertainty <strong>of</strong> the mismatch correction is<br />
reduced from 0.50 dB <strong>to</strong> 0.03 dB.<br />
Far <strong>Field</strong> Peak. The error terms that contribute <strong>to</strong> the<br />
uncertainty in the Far-<strong>Field</strong> Peak are listed under that<br />
heading in Table 1 and are the fac<strong>to</strong>rs that produce errors in<br />
the relative near-field data. The only significant source in<br />
this list for on-axis gain is the multiple reflections term.<br />
This is due <strong>to</strong> the multiple reflections between the SGH and<br />
the probe and can be a major source <strong>of</strong> error when the AUT<br />
is not much larger than the probe. This error term can be<br />
directly measured and reduced by making near-field<br />
measurements at a series <strong>of</strong> Z-distances that differ by λ/8.<br />
The multiple reflections affect the far-field pattern near the<br />
peak <strong>of</strong> the beam as shown in Figure 5. If only a single<br />
near-field measurement is used for the gain calculations,<br />
the uncertainty due <strong>to</strong> multiple reflections could be 0.10<br />
dB. Using all five measurements and averaging the Far-<br />
<strong>Field</strong> Peaks reduces the uncertainty <strong>to</strong> 0.03 dB. In the first<br />
series <strong>of</strong> measurement performed in 2000 <strong>to</strong> check the<br />
probe gain, measurements were made at only one Z-<br />
distance. As a result, the 0.10 dB uncertainty must be used<br />
for these results and the <strong>to</strong>tal uncertainty is 0.13 dB. The<br />
measurements shown in Figure 5 were made in 2001 and<br />
were made at five different Z-distances. These more recent<br />
results will be discussed later.
Probe <strong>Gain</strong> in dB<br />
8.1<br />
8<br />
7.9<br />
7.8<br />
7.7<br />
7.6<br />
7.5<br />
Vertical Port Probe <strong>Gain</strong>, APC-7<br />
Original <strong>Calibration</strong><br />
<strong>Near</strong>-<strong>Field</strong> Results, 2000<br />
5.34 5.36 5.38 5.4 5.42 5.44 5.46<br />
Frequency in GHz<br />
Figure 7 Comparison <strong>of</strong> Vertical Port Probe gain<br />
from calibration and 2000 near-field measurements.<br />
The comparisons between the original calibration and the<br />
2000 near-field measurements are summarized in Figures 6<br />
and 7. The Horizontal port results are in very close<br />
agreement with the original calibration, and at every<br />
frequency for both ports except one for the H-Port, the<br />
error bars include the original calibration. Within the<br />
uncertainty <strong>of</strong> the two measurements, we would conclude<br />
that the probe gain has not changed from the original<br />
0<br />
-10<br />
calibration. If multiple Z-distance measurements had been<br />
performed, the error bars could be reduced <strong>to</strong> 0.09 dB, and<br />
it would be more conclusive for the V-Port whether the<br />
systematic difference is due <strong>to</strong> a change in the probe or <strong>to</strong><br />
measurement uncertainty. This situation illustrates the<br />
importance <strong>of</strong> the multiple Z-distance measurements for<br />
high accuracy measurements.<br />
The measurements on the SGH were repeated in 2001 with<br />
some improvements <strong>to</strong> reduce the uncertainty and provide<br />
better data <strong>to</strong> estimate the uncertainties. A sample <strong>of</strong> the<br />
near-field centerline cuts for the newer data is shown in<br />
Figure 8. The scan area was increased for this<br />
measurement so the truncation error is smaller and the data<br />
can be truncated <strong>to</strong> better estimate the truncation<br />
uncertainty. <strong>Measurements</strong> were made at multiple Z-<br />
distances as shown in Figure 5 and this reduced the<br />
multiple reflection uncertainty. The horn was aligned<br />
better so that the probe was centered on the horn for both<br />
the H-polarized and V-polarized measurement. This<br />
improved alignment is indicated by the symmetry and<br />
centering <strong>of</strong> the H and V cuts in Figure 8 as compared <strong>to</strong><br />
Figure 4. As a result <strong>of</strong> these improvements the estimated<br />
uncertainty for the probe gain change was reduced <strong>to</strong> 0.08<br />
dB. The direct connect measurements were made at the<br />
SMA connec<strong>to</strong>rs rather than the APC-7 since the probe was<br />
being used <strong>to</strong> measure another antenna with an SMA input<br />
connec<strong>to</strong>r. The results <strong>of</strong> these measurements are shown in<br />
Figures 9 and 10. The probe gain is consistently lower than<br />
the original calibration for both ports and the difference is<br />
8.1<br />
8<br />
Vertical Port Probe <strong>Gain</strong> SMA Connec<strong>to</strong>r<br />
Original <strong>Calibration</strong><br />
<strong>Near</strong>-<strong>Field</strong> Results, 2000<br />
<strong>Near</strong> <strong>Field</strong> Results, 2001<br />
-20<br />
Relative Amplitude in dB<br />
-30<br />
-40<br />
-50<br />
-60<br />
H-Cut for Y = 0<br />
V-Cut for X=0<br />
Probe <strong>Gain</strong> in dB<br />
7.9<br />
7.8<br />
7.7<br />
7.6<br />
-70<br />
-80<br />
7.5<br />
-80 -40 0 40 80<br />
Probe X or Y Position in Inches<br />
Figure 8 <strong>Near</strong>-field centerline amplitude for<br />
horizontally polarized horn antenna.<br />
5.34 5.36 5.38 5.4 5.42 5.44 5.46<br />
Frequency in GHz<br />
Figure 9 Vertical Port Probe gain , SMA connec<strong>to</strong>r,<br />
<strong>Calibration</strong>, 2000 and 2001 measurements.
Probe <strong>Gain</strong> in dB<br />
8.4<br />
8.3<br />
8.2<br />
8.1<br />
8<br />
7.9<br />
7.8<br />
Horizontal Port Probe <strong>Gain</strong> SMA Connec<strong>to</strong>r<br />
Original <strong>Calibration</strong><br />
<strong>Near</strong>-<strong>Field</strong> Results, 2000<br />
<strong>Near</strong> <strong>Field</strong> Results, 2001<br />
5.34 5.36 5.38 5.4 5.42 5.44 5.46<br />
Frequency in GHz<br />
reduced if possible in all three measurements. The relative<br />
near-field data replaces the distance measurement in the<br />
extrapolation technique and the far-field range, but in each<br />
case uncertainties from these sources are minor.<br />
5.0 References<br />
[1] Newell, A. C. and Kerns, D. M., “Determination <strong>of</strong><br />
both polarization and power gain <strong>of</strong> antennas by a<br />
generalized 3-antenna measurement method,” Electronic<br />
Letters, Volume 7, No. 3, January 1971.<br />
[2] Newell, A. C., Baird, R.C., and Wacker, P.F.,<br />
"Accurate measurement <strong>of</strong> antenna gain and polarization<br />
at reduced distances by an extrapolation technique," IEEE<br />
Transactions on Antennas and Propagation, Vol. AP-21,<br />
No. 4, pp. 418-431, July 1973.<br />
[3] Repjar, A.; Newell, A.; Baird, R.C., “Antenna gain<br />
measurements by an extended version <strong>of</strong> the NBS<br />
extrapolation method,” AMTA 1982, p. 1<br />
Figure 10 H-Port Probe gain , SMA connec<strong>to</strong>r,<br />
calibration, 2000 and 2001 measurements.<br />
larger than the estimated uncertainty. It is apparent that<br />
something has changed. Closer analysis <strong>of</strong> the measured<br />
data shows that the directivity <strong>of</strong> the horn has not changed<br />
and that the Direct Connect results in 2000 and 2001 are<br />
nearly identical. The conclusion is that the APC-7 <strong>to</strong> SMA<br />
coax adapters on either the horn or both ports <strong>of</strong> the probe<br />
have a higher loss than when initially installed. This can be<br />
confirmed by measuring the adapters on a network analyzer<br />
and the adapters can be replaced if necessary. The nearfield<br />
measurements could also be repeated at the APC-7<br />
connec<strong>to</strong>r <strong>to</strong> verify that the probe gain at this connec<strong>to</strong>r has<br />
not changed.<br />
4.0 Conclusions<br />
<strong>Planar</strong> near-field gain measurements have been described<br />
<strong>to</strong> measure the change in the gain <strong>of</strong> a calibrated probe<br />
using a calibrated standard gain horn. Steps have been<br />
described and demonstrated <strong>to</strong> reduce the uncertainty in<br />
this measurement <strong>to</strong> the same uncertainty as the original<br />
calibration. When gain changes are observed, it is <strong>of</strong>ten<br />
possible <strong>to</strong> identify the cause <strong>of</strong> the change using the nearfield<br />
and direct connect data.<br />
It is also interesting <strong>to</strong> note that the critical elements <strong>of</strong> the<br />
near-field measurement are very similar <strong>to</strong> both the<br />
extrapolation technique used for probe gain calibration and<br />
far-field gain measurements. In all three measurements the<br />
gain standard, the measured power ratio and the impedance<br />
mismatch determine the accuracy <strong>of</strong> the results. Multiple<br />
reflections or ground reflections must be measured and<br />
[4] Larsen, F.H.; Lemanczyk, J.; Hansen, J.E., “Antenna<br />
calibration at the TUD-ESA spherical near-field range,”<br />
AMTA 1983, p. 19<br />
[5] Repjar, A.G., Newell, A.C., and Tamura, D.T.,<br />
"Extrapolation range measurements determining antenna<br />
gain and polarization," National Bureau <strong>of</strong> Standards<br />
Technical Note 1311, p 1-69, August 1987, Boulder,<br />
CO.<br />
[6] Repjar, A.G., Newell, A.C., and Francis, M.H.,<br />
"Accurate determination <strong>of</strong> planar near-field correction<br />
parameters for linearly polarized probes," IEEE<br />
Transactions on Antennas and Propagation, Vol. 36, No.<br />
6, pp. 855-868, June 1988.<br />
[7] Scott, W.G.; Masters, G., “Three antenna gain methods<br />
on a near field range,” AMTA 1994, p. 230<br />
[8] Rousseau, P.R., “The development <strong>of</strong> a near-field data<br />
window function for measuring standard gain horns,”<br />
AMTA 1997, p. 96<br />
[9] Dich, M.; Gram, H.E., “Alignment errors and standard<br />
gain horn calibrations,” AMTA 1997, p. 425<br />
[10] J. T. Shaffer, Dybdal, R. B. “Using Standard <strong>Gain</strong><br />
Horns,” AMTA 2000, p. 165-169.<br />
[11] Kolesnik<strong>of</strong>f, P. I., “Antenna <strong>Gain</strong> Measurement errors<br />
due <strong>to</strong> finite source axial ratio,” AMTA 2000, p. 181-186.