Fast and Accurate Antenna Alignment Correction Performed Using a ...
Fast and Accurate Antenna Alignment Correction Performed Using a ...
Fast and Accurate Antenna Alignment Correction Performed Using a ...

You also want an ePaper? Increase the reach of your titles
YUMPU automatically turns print PDFs into web optimized ePapers that Google loves.
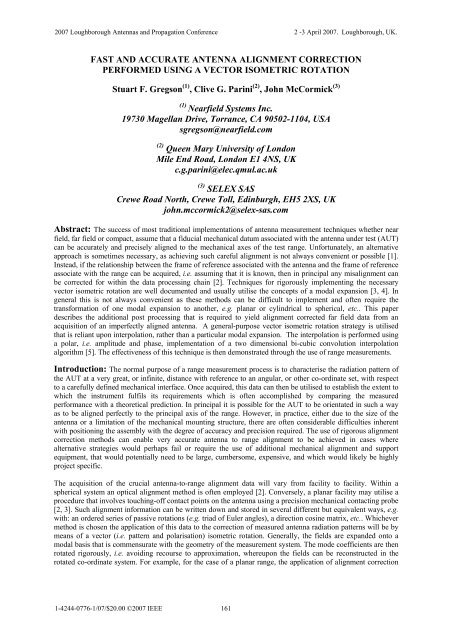
2007 Loughborough <strong>Antenna</strong>s <strong>and</strong> Propagation Conference 2 -3 April 2007. Loughborough, UK.FAST AND ACCURATE ANTENNA ALIGNMENT CORRECTIONPERFORMED USING A VECTOR ISOMETRIC ROTATIONStuart F. Gregson (1) , Clive G. Parini (2) , John McCormick (3)(1)Nearfield Systems Inc.19730 Magellan Drive, Torrance, CA 90502-1104, USAsgregson@nearfield.com(2) Queen Mary University of LondonMile End Road, London E1 4NS, UKc.g.parini@elec.qmul.ac.uk(3) SELEX SASCrewe Road North, Crewe Toll, Edinburgh, EH5 2XS, UKjohn.mccormick2@selex-sas.comAbstract: The success of most traditional implementations of antenna measurement techniques whether nearfield, far field or compact, assume that a fiducial mechanical datum associated with the antenna under test (AUT)can be accurately <strong>and</strong> precisely aligned to the mechanical axes of the test range. Unfortunately, an alternativeapproach is sometimes necessary, as achieving such careful alignment is not always convenient or possible [1].Instead, if the relationship between the frame of reference associated with the antenna <strong>and</strong> the frame of referenceassociate with the range can be acquired, i.e. assuming that it is known, then in principal any misalignment canbe corrected for within the data processing chain [2]. Techniques for rigorously implementing the necessaryvector isometric rotation are well documented <strong>and</strong> usually utilise the concepts of a modal expansion [3, 4]. Ingeneral this is not always convenient as these methods can be difficult to implement <strong>and</strong> often require thetransformation of one modal expansion to another, e.g. planar or cylindrical to spherical, etc.. This paperdescribes the additional post processing that is required to yield alignment corrected far field data from anacquisition of an imperfectly aligned antenna. A general-purpose vector isometric rotation strategy is utilisedthat is reliant upon interpolation, rather than a particular modal expansion. The interpolation is performed usinga polar, i.e. amplitude <strong>and</strong> phase, implementation of a two dimensional bi-cubic convolution interpolationalgorithm [5]. The effectiveness of this technique is then demonstrated through the use of range measurements.Introduction: The normal purpose of a range measurement process is to characterise the radiation pattern ofthe AUT at a very great, or infinite, distance with reference to an angular, or other co-ordinate set, with respectto a carefully defined mechanical interface. Once acquired, this data can then be utilised to establish the extent towhich the instrument fulfils its requirements which is often accomplished by comparing the measuredperformance with a theoretical prediction. In principal it is possible for the AUT to be orientated in such a wayas to be aligned perfectly to the principal axis of the range. However, in practice, either due to the size of theantenna or a limitation of the mechanical mounting structure, there are often considerable difficulties inherentwith positioning the assembly with the degree of accuracy <strong>and</strong> precision required. The use of rigorous alignmentcorrection methods can enable very accurate antenna to range alignment to be achieved in cases wherealternative strategies would perhaps fail or require the use of additional mechanical alignment <strong>and</strong> supportequipment, that would potentially need to be large, cumbersome, expensive, <strong>and</strong> which would likely be highlyproject specific.The acquisition of the crucial antenna-to-range alignment data will vary from facility to facility. Within aspherical system an optical alignment method is often employed [2]. Conversely, a planar facility may utilise aprocedure that involves touching-off contact points on the antenna using a precision mechanical contacting probe[2, 3]. Such alignment information can be written down <strong>and</strong> stored in several different but equivalent ways, e.g.with: an ordered series of passive rotations (e.g. triad of Euler angles), a direction cosine matrix, etc.. Whichevermethod is chosen the application of this data to the correction of measured antenna radiation patterns will be bymeans of a vector (i.e. pattern <strong>and</strong> polarisation) isometric rotation. Generally, the fields are exp<strong>and</strong>ed onto amodal basis that is commensurate with the geometry of the measurement system. The mode coefficients are thenrotated rigorously, i.e. avoiding recourse to approximation, whereupon the fields can be reconstructed in therotated co-ordinate system. For example, for the case of a planar range, the application of alignment correction1-4244-0776-1/07/$20.00 ©2007 IEEE161
2007 Loughborough <strong>Antenna</strong>s <strong>and</strong> Propagation Conference 2 -3 April 2007. Loughborough, UK.data is applied rigorously by exp<strong>and</strong>ing the plane wave spectrum on an irregular grid (i.e. non-rectilinear) in therange system. This irregular space corresponds to a regular angular domain in the antenna mechanical system.The field components then need transforming from the range polarisation basis into the antenna polarisationbasis. However, a similar result can be obtained with only a small increase in uncertainty that yields a significantreduction in the amount of computational effort, <strong>and</strong> therefore time, required by recourse to approximation.Often approximation, in the form of piecewise polynomial interpolation, is avoided due to fears concerning theaccuracy attained. However, when deployed correctly, <strong>and</strong> used in suitable applications, the power <strong>and</strong> speed ofthis approach can be of utility.Method: Transformation matrices are matrices that post-multiply a column point vector to produce a newcolumn point vector. A series of transformation matrices may be concatenated into a single matrix by matrixmultiplication. A transformation matrix may represent each of the operations of translation, scaling, <strong>and</strong> rotation.However, if A is a three by three orthogonal, normalised, square matrix, it may be used to specify an isometricrotation that can be used to relate two frames of reference, i.e. two co-ordinate systems. Here, an isometricrotation is taken to mean a transformation in which the distance between any two points on an object remainsinvariant under the transformation. Any number of angular definitions for describing the relationship betweenthe two co-ordinate systems are available. However, if the angles azimuth, elevation <strong>and</strong> roll are used, where therotations are applied in this order, we may write that a point in one frame of reference can be specified in termsof a point in the other frame of reference as,⎡x′⎤ ⎡x⎤⎡ cos( roll) sin( roll)0⎤⎡10 0 ⎤ ⎡cos( az) 0 − sin( az)⎤ ⎡x⎤⎢ ⎥[ ]⎢ ⎥ ⎢( ) ( )⎥⋅⎢( ) ( )⎥⋅⎢⎥⋅⎢ (1)⎢y′⎥= A ⋅⎢y⎥=⎢− sin roll cos roll 0⎥ ⎢0 cos el − sin el⎥ ⎢0 1 0⎥ ⎢y⎢ ⎥ ⎢ ⎥ ⎢⎥ ⎢ ( ) ( ) ⎥ ⎢ ( ) ( ) ⎥ ⎢ ⎥ ⎥⎥ ⎣z′⎦ ⎣z⎦⎣ 0 0 1⎦⎣0sin el cos el ⎦ ⎣sinaz 0 cos az ⎦ ⎣z⎦Here primed co-ordinates are used to denote the rotated co-ordinate system. These transformation matrices canbe easily derived either from geometry, or from trigonometric identities. Here, in accordance with the rules oflinear algebra, the first rotation matrix is written to the right with the next rotation being written to it’s left <strong>and</strong> soon. Such rotations are termed passive as each successive rotation is applied to the newly rotated system.Specifically then, the rotations are understood to have been performed in the following order: 1) rotate about thenegative y-axis through an angle azimuth, 2) rotate about the negative x-axis through an angle elevation, 3)rotate about the z-axis through an angle roll. Thus, when az = el = roll = 0 the direction cosine matrix will be theidentity matrix <strong>and</strong> specifies that the primed <strong>and</strong> un-primed systems are coincident <strong>and</strong> synonymous. Whendirection cosine matrices are used in this way, the determinant of the matrix should be calculated as anydeviation from unity can be treated as an indication of error. Furthermore, a determinant of –1 indicates that aright-h<strong>and</strong>ed co-ordinate system has been transformed into a left-h<strong>and</strong>ed one <strong>and</strong> vice-versa. For the case ofapplying a scalar isometric rotation to a far field antenna pattern, i.e. one in which the reference polarisation isrotated with the pattern, this can be accomplished readily by converting the rectangular plotting x- <strong>and</strong> y- axesinto the equivalent direction cosines before using equation (1) above to compute the rotated direction cosines.Once the rotated direction cosines are known they can be used to compute the new rectangular plotting x- <strong>and</strong> y-axes in the rotated system. This process can be used to rotate an antenna pattern that has been tabulated in any ofthe conventional tabulating, i.e. plotting, co-ordinate systems, e.g. azimuth over elevation, elevation overazimuth, polar spherical, true-view, direction cosine, etc.. Once the new desired co-ordinates are known it is asimple matter of using a convenient interpolating scheme to approximate the value of the underlying pattern ateach of the new co-ordinates. By utilising Cartesian direction cosine components <strong>and</strong> by wrapping any resultingspherical angles into their equivalent ±180° range, this procedure is capable of correctly h<strong>and</strong>ling arbitraryrotations to complete full sphere patterns.To this end, the antenna pattern data must be interpolated from the sampling grid onto the desired output grid.However, for the case of a b<strong>and</strong>-limited function this interpolation need not introduce any approximation as theentire function can be reconstructed using the sampling theory. And in essence, this exactly how conventionalactive alignment correction techniques operate. Thus although rigorous, such an approach is computationallyintensive <strong>and</strong> often the uncertainties introduced by other interpolation schemes are found to be acceptably small.When the nature of the underlying function is not to rapidly varying when compared to the sampling interval,fitting a polynomial function to the sampled pattern in a piecewise sense can approximate the underlyingfunction from samples taken on a regular, equally spaced two-dimensional grid. Many techniques are availablefor this purpose, however bi-cubic convolution [5] has been found to be both efficient <strong>and</strong> robust, supplying datathat is smooth, i.e. both the function <strong>and</strong> its derivative are continuous. Here however, the interpolation wasperformed in terms of the polar, amplitude <strong>and</strong> phase, form of voltage rather than the equivalent rectangular, real<strong>and</strong> imaginary, form. This is often preferable as more reliable results are obtained in the presence of a phasetaper across the sampled function. This follows from the fact that in polar form, even a large phase taper only162
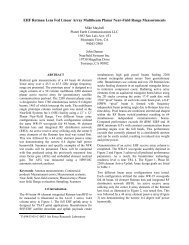
2007 Loughborough <strong>Antenna</strong>s <strong>and</strong> Propagation Conference 2 -3 April 2007. Loughborough, UK.equates to a constant amplitude function <strong>and</strong> a linear phase function, whilst in rectangular form this equates to ahighly oscillatory real <strong>and</strong> imaginary function that is difficult to approximate reliably with piece-wisepolynomial functions. When interpolating phase data care must be taken to wrap all local phase points into thesame phase range before estimating the value of the interleaving point. In practice, the unwrapping of twodimensional phase data is a dem<strong>and</strong>ing task. Consequently, the task is significantly simplified here byunwrapping the phases of only the nearest sixteen points (i.e. only those points required by the bi-cubicconvolution interpolation algorithm) to the location of the desired interleaving point. The algorithm can beexpressed as: 1) locate the sixteen nearest neighbour points, 2) unwrap all points into the same phase range as thenearest neighbour point, 3) apply conventional interpolation algorithm, 4) wrap the interpolated value back intothe conventional ±180° range. If the rate of change in the phase function is large, i.e. greater than ±180° betweensampling points, this phase interpolation scheme will become unreliable. However, this not generally a problemas this would also invalidate the sampling theorem.As described above, the by-product of a scalar rotation is that the reference polarisation is rotated with thepattern by exactly the same amount as the pattern has been rotated. Thus, an inverse rotation must be applied tothe polarisation basis in order that it can be returned to its original position. The algorithm for applying a vectorrotation to an antenna pattern can thus be expressed as follows: 1) Resolve the far field pattern (e.g. resolvedonto a Ludwig III polarisation basis) onto a Cartesian polarisation basis. 2) Calculate the equivalent directioncosines from the plotting co-ordinates, e.g. calculate α, β <strong>and</strong> γ from the azimuth <strong>and</strong> elevation angles, <strong>and</strong> applyan isometric rotation. Calculate the rotated plotting co-ordinates from the rotated direction cosines. 3) Interpolateeach of the Cartesian field components from the tabulated plotting grid onto the rotated plotting grid using apreferred interpolating scheme. 4) Apply an inverse isometric rotation to the field components to complete thevector isometric rotation. 5) Resolve the far field pattern back onto the desired polarisation basis (e.g. Ludwig IIIdefinition).Results: In order that the validity of the alignment techniques could be tested, a low gain antenna was acquiredat a variety of different orientations with respect to the axes of the range. In each case the antenna to rangealignment was acquired using a precision mechanical contacting probe <strong>and</strong> the data transformed to the far field.The corrected far field data can be seen below presented in terms of iso-level (contour) plots for the case wherethe AUT was misaligned grossly in azimuth, elevation <strong>and</strong> roll. The antenna pattern has been tabulated using aan azimuth over elevation co-ordinate system <strong>and</strong> the electric field was resolved onto a nadir-centred Ludwig IIIpolarisation basis.40Copolar302010El °0-10-20-30-40-40 -30 -20 -10 0 10 20 30 40Az °Figure 1: Far field Copolar Pattern.Here, red contours denote results obtained using conventional active alignment correction whereas, blackcontours denote results obtained using vector isometric rotation <strong>and</strong> polynomial interpolation <strong>and</strong> the contourshave been plotted at 5dB steps from 0dB to –70dB. The data has only been plotted out to ±40° in azimuth <strong>and</strong>elevation in order that the entire far field data set should be free from first order truncation effects. Theagreement attained between the respective results is encouraging as the differences observed are small. Theverification of the conventional active alignment correction technique is not the purpose of this paper <strong>and</strong> is asubject in its own right. However, a detailed description of that method <strong>and</strong> its verification can be found in [1, 2,3]. The visibility of red contours at the edges of the plot is merely an artefact of the uncorrected data beingknown only out to ±40° in azimuth <strong>and</strong> elevation <strong>and</strong> is not a fundamental limitation of the procedure. To163
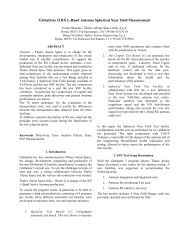
2007 Loughborough <strong>Antenna</strong>s <strong>and</strong> Propagation Conference 2 -3 April 2007. Loughborough, UK.further verify that the alignment information had been applied correctly, the nominally aligned data set wasrotated through 10° in azimuth, then 20° in elevation <strong>and</strong> finally through 30° in roll. The resulting rotated dataset was then further transformed by the inverse rotation, i.e. [A] -1 , <strong>and</strong> compared against the original nominallyaligned pattern. This comparison can be seen presented in figure 2 below.40Copolar Power (dB)302010El (deg)0-10-20-30-40-40 -20 0 20 40Az (deg)Figure 2: Verification of vector rotation algorithm copolar pattern.Here, red contours represent the original data set whilst the black contours represent the twice-rotated data set<strong>and</strong> the contours have been plotted at 5dB steps from 0dB to –70dB. Clearly, the agreement is encouraging withonly minor differences resulting in inaccuracies introduced by approximations inherent within the interpolationalgorithm. The errors observed at the edges of the recovered data set result from a failure of the interpolationalgorithm to correctly h<strong>and</strong>le edge elements. Clearly, approximate methods such as these can prove unreliable onoccasion. For example, the results may become unreliable if used to correct very high gain antenna patternswhere the underlying pattern function fluctuates rapidly with respect to the sampling interval. Errors may also beencountered in regions of low signal levels where the presence of noise can disturb the interpolation, e.g. inpattern nulls. The interpolation formula use several neighbouring points to approximate an interleaving point.Thus, although being suppressed localised noise will be spread out to any interpolated point using a noisecontaminated sampling node. However, for many cases where the rotation has been accomplished usingapproximation, rather than rigorous sampling theorem (i.e. Whittaker) interpolation, the results are usuallysufficiently reliable for the purposes of visualisation.Conclusion: This paper has shown that a simple vector isometric rotation, employing an efficient polarimplementation of a bi-cubic convolution interpolation algorithm, can be used to obtain reliable alignmentcorrected results that are in very close agreement with those results obtained by more intensive, rigorous means.Although it is always possible to choose a function that is sufficiently pathological to make a mockery of anyinterpolating procedure, in practice this implementation has been found to be comparatively robust. Finally, theutilisation of such realignment processes substantially increases the ability of a given measurement facility toaccurately characterise antenna assemblies, even in circumstances where gross misalignment is unavoidable, orwhen high degrees of angular precision are required.References[1] S.F. Gregson, J. McCormick, “The Application Of Non-Rectilinear Co-Ordinate Systems In TheCharacterisation Of Mis-Aligned Space <strong>Antenna</strong>s”, AMTA 1999.[2] S.F. Gregson, A.J. Robinson, “An Inter-range Comparison in Support of the Characterisation of Space<strong>Antenna</strong> Systems <strong>and</strong> Payload Testing”, IEE, 1988.[3] S.F. Gregson, J. McCormick, “Image Classification as Applied to the Holographic Analysis of Mis-Aligned<strong>Antenna</strong>s”, ESA ESTEC, 1999.[4] A. Fr<strong>and</strong>sen, “Spherical near-field transformation program with probe correction”, TICRA, Denmark, 1995.[5] R.G. Keys, “Cubic Convolution Interpolation for Digital Image Processing”, IEEE Trans. on Acoustics,Speech, <strong>and</strong> Signal Processing, Vol. 29, No. 6, Dec. 1981, pp. 1153-1160.Acknowledgements: The authors wish to extend their gratitude to Dr A.J. Robinson for his many, valuableconversations during the early stages of this work <strong>and</strong> the reviewers for their very useful <strong>and</strong> constructivecomments.164