GlobalStar II RX L-Band Antenna Spherical Near Field Measurement
GlobalStar II RX L-Band Antenna Spherical Near Field Measurement
GlobalStar II RX L-Band Antenna Spherical Near Field Measurement

You also want an ePaper? Increase the reach of your titles
YUMPU automatically turns print PDFs into web optimized ePapers that Google loves.
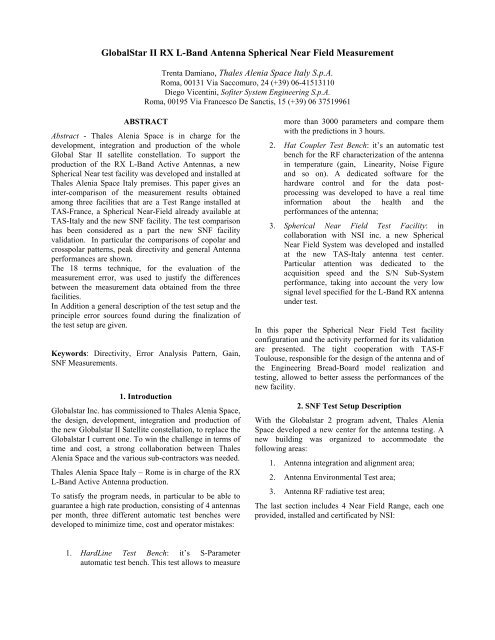
<strong>GlobalStar</strong> <strong>II</strong> <strong>RX</strong> L-<strong>Band</strong> <strong>Antenna</strong> <strong>Spherical</strong> <strong>Near</strong> <strong>Field</strong> <strong>Measurement</strong>Trenta Damiano, Thales Alenia Space Italy S.p.A.Roma, 00131 Via Saccomuro, 24 (+39) 06-41513110Diego Vicentini, Sofiter System Engineering S.p.A.Roma, 00195 Via Francesco De Sanctis, 15 (+39) 06 37519961ABSTRACTAbstract - Thales Alenia Space is in charge for thedevelopment, integration and production of the wholeGlobal Star <strong>II</strong> satellite constellation. To support theproduction of the <strong>RX</strong> L-<strong>Band</strong> Active <strong>Antenna</strong>s, a new<strong>Spherical</strong> <strong>Near</strong> test facility was developed and installed atThales Alenia Space Italy premises. This paper gives aninter-comparison of the measurement results obtainedamong three facilities that are a Test Range installed atTAS-France, a <strong>Spherical</strong> <strong>Near</strong>-<strong>Field</strong> already available atTAS-Italy and the new SNF facility. The test comparisonhas been considered as a part the new SNF facilityvalidation. In particular the comparisons of copolar andcrosspolar patterns, peak directivity and general <strong>Antenna</strong>performances are shown.The 18 terms technique, for the evaluation of themeasurement error, was used to justify the differencesbetween the measurement data obtained from the threefacilities.In Addition a general description of the test setup and theprinciple error sources found during the finalization ofthe test setup are given.Keywords: Directivity, Error Analysis Pattern, Gain,SNF <strong>Measurement</strong>s.1. IntroductionGlobalstar Inc. has commissioned to Thales Alenia Space,the design, development, integration and production ofthe new Globalstar <strong>II</strong> Satellite constellation, to replace theGlobalstar I current one. To win the challenge in terms oftime and cost, a strong collaboration between ThalesAlenia Space and the various sub-contractors was needed.Thales Alenia Space Italy – Rome is in charge of the <strong>RX</strong>L-<strong>Band</strong> Active <strong>Antenna</strong> production.To satisfy the program needs, in particular to be able toguarantee a high rate production, consisting of 4 antennasper month, three different automatic test benches weredeveloped to minimize time, cost and operator mistakes:more than 3000 parameters and compare themwith the predictions in 3 hours.2. Hat Coupler Test Bench: it’s an automatic testbench for the RF characterization of the antennain temperature (gain, Linearity, Noise Figureand so on). A dedicated software for thehardware control and for the data postprocessingwas developed to have a real timeinformation about the health and theperformances of the antenna;3. <strong>Spherical</strong> <strong>Near</strong> <strong>Field</strong> Test Facility: incollaboration with NSI inc. a new <strong>Spherical</strong><strong>Near</strong> <strong>Field</strong> System was developed and installedat the new TAS-Italy antenna test center.Particular attention was dedicated to theacquisition speed and the S/N Sub-Systemperformance, taking into account the very lowsignal level specified for the L-<strong>Band</strong> <strong>RX</strong> antennaunder test.In this paper the <strong>Spherical</strong> <strong>Near</strong> <strong>Field</strong> Test facilityconfiguration and the activity performed for its validationare presented. The tight cooperation with TAS-FToulouse, responsible for the design of the antenna and ofthe Engineering Bread-Board model realization andtesting, allowed to better assess the performances of thenew facility.2. SNF Test Setup DescriptionWith the Globalstar 2 program advent, Thales AleniaSpace developed a new center for the antenna testing. Anew building was organized to accommodate thefollowing areas:1. <strong>Antenna</strong> integration and alignment area;2. <strong>Antenna</strong> Environmental Test area;3. <strong>Antenna</strong> RF radiative test area;The last section includes 4 <strong>Near</strong> <strong>Field</strong> Range, each oneprovided, installed and certificated by NSI:1. HardLine Test Bench: it’s S-Parameterautomatic test bench. This test allows to measure
60605050404030302020Theta Sin(Phi)100‐10Theta Sin(Phi)100‐10‐20‐20‐30‐30‐40‐40‐50‐50‐60‐60 ‐50 ‐40 ‐30 ‐20 ‐10 0 10 20 30 40 50 60Theta Cos(Phi)Figure 7: Beam 2 Copolar Comparison: TAS-F (red)vs. TAS-I (Black – the new facility)‐60‐60 ‐50 ‐40 ‐30 ‐20 ‐10 0 10 20 30 40 50 60Theta Cos(Phi)Figure 11: Beam 5 Cxpolar Comparison: TAS-F (red)vs. TAS-I (Black - Already Available)60605050404030302020Theta Sin(Phi)100‐10Theta Sin(Phi)100‐10‐20‐20‐30‐30‐40‐40‐50‐50‐60‐60 ‐50 ‐40 ‐30 ‐20 ‐10 0 10 20 30 40 50 60Theta Cos(Phi)Figure 8: Beam 5 Copolar Comparison: TAS-F (red)vs. TAS-I (Black – the new facility)‐60‐60 ‐50 ‐40 ‐30 ‐20 ‐10 0 10 20 30 40 50 60Theta Cos(Phi)Figure 12: Beam 10 Cxpolar Comparison: TAS-F(red) vs. TAS-I (Black - Already Available)60605050404030302020Theta Sin(Phi)100‐10Theta Sin(Phi)100‐10‐20‐20‐30‐30‐40‐40‐50‐50‐60‐60 ‐50 ‐40 ‐30 ‐20 ‐10 0 10 20 30 40 50 60‐60‐60 ‐50 ‐40 ‐30 ‐20 ‐10 0 10 20 30 40 50 60Theta Cos(Phi)Theta Cos(Phi)Figure 9: Beam 10 Copolar Comparison: TAS-F (red)vs. TAS-I (Black – the new facility)Figure 13: Beam 2 Cxpolar Comparison: TAS-F (red)vs. TAS-I (Black – the new facility)60605050404030302020Theta Sin(Phi)100‐10Theta Sin(Phi)100‐10‐20‐20‐30‐30‐40‐40‐50‐50‐60‐60 ‐50 ‐40 ‐30 ‐20 ‐10 0 10 20 30 40 50 60Theta Cos(Phi)Figure 10: Beam 2 Cxpolar Comparison: TAS-F (red)vs. TAS-I (Black - Already Available)‐60‐60 ‐50 ‐40 ‐30 ‐20 ‐10 0 10 20 30 40 50 60Theta Cos(Phi)Figure 14: Beam 5 Cxpolar Comparison: TAS-F (red)vs. TAS-I (Black – the new facility)
Theta Sin(Phi)6050403020100‐10‐20‐30‐40‐50‐60‐60 ‐50 ‐40 ‐30 ‐20 ‐10 0 10 20 30 40 50 60Theta Cos(Phi)Figure 15: Beam 10 Cxpolar Comparison: TAS-F(red) vs. TAS-I (Black – the new facility)The following tables report the comparisons in terms ofcopolar and crosspolar peak between the three facilities.Directivity Peak ComparisonsTAS-F TAS-I TAS-I (New)Beam#01 14.95 14.99 14.99Beam#02 19.62 19.67 19.62Beam#03 19.58 19.62 19.60Beam#04 19.29 19.27 19.35Beam#05 19.51 19.47 19.55Beam#06 19.53 19.57 19.61Beam#07 19.53 19.49 19.59Beam#08 19.52 19.44 19.54Beam#09 19.67 19.60 19.65Beam#10 19.54 19.58 19.64Beam#11 19.50 19.44 19.54Beam#12 19.52 19.56 19.54Beam#13 19.61 19.68 19.67Beam#14 19.46 19.53 19.56Beam#15 19.31 19.36 19.43Beam#16 19.61 19.65 19.65Table 1: Directivity ComparisonCrosspolar Peak ComparisonsTAS-F TAS-I TAS-I (New)Beam#01 -24.02 -24.24 -23.75Beam#02 -20.85 -20.40 -21.00Beam#03 -19.69 -19.27 -19.38Beam#04 -26.29 -26.37 -26.27Beam#05 -22.86 -21.85 -22.48Beam#06 -23.50 -23.58 -23.88Beam#07 -24.60 -23.98 -24.13Beam#08 -21.95 -22.62 -22.51Beam#09 -22.64 -22.77 -23.98Beam#10 -23.90 -23.85 -24.45Beam#11 -24.71 -25.13 -25.22Beam#12 -22.80 -22.60 -22.32Beam#13 -22.02 -21.94 -21.84Beam#14 -24.93 -25.06 -24.72Beam#15 -23.03 -22.99 -23.94Beam#16 -29.02 -28.00 -27.85Table 2: Crosspolar Peak Comparison3. Error Budget Definition: Using the 18 TermsError budget Technique an analysis of themeasurement uncertainties has been done.Following the philosophy of this method, eacherror source have been evaluated for each beamin the following two region:• Main Beam Region (MBR): Spatialregion of each beam where the level ishigher than -10dB;• Side Lobe Region(SLR) &Cross Region:Circle with 54.3 deg radius;By different measurements the error pattern ofeach source is calculated; the worst case errorlevel is evaluated, taking into account the 99%(3 sigma) of the total number of points insideeach region. This value defines the SNF testRange uncertainty budget for the relevant beam.From the average of the error budget of eachbeam, the total SNF uncertainty budget is carryout.MBRSLRCross RegionError Budget @ 99%Level Error Uncertainty‐3 ‐40 0.09 ‐0.09‐6 ‐37 0.12 ‐0.13‐10 ‐33 0.19 ‐0.20‐15 ‐28 0.34 ‐0.36‐20 ‐23 0.60 ‐0.65‐25 ‐18 1.04 ‐1.19‐30 ‐13 1.78 ‐2.24‐3 ‐39 0.10 ‐0.10‐6 ‐36 0.14 ‐0.15‐10 ‐32 0.23 ‐0.23‐15 ‐27 0.40 ‐0.42‐20 ‐22 0.70 ‐0.76‐25 ‐17 1.21 ‐1.40‐30 ‐12 2.04 ‐2.68Table 3: SNF Uncertainty BudgetAn interesting effect found during the Test Rangevalidation is the Beam depointing /distortion introducedby the misalignment of the facility. In particular the El0and the Az0 error give an annoying rotation of the Mainbeam especially for the external beams. This effect,function of the phase and amplitude distribution error onthe scanning area, seems independent by the kind ofacquisition, (phi scan or theta scan).Performing two different acquisitions by changing theElevation stage (AUT in 0 and 180 deg), we obtained theresults reported in the following figures for Beam9, andBeam13. As we can see from the following comparisons,the Elevation offset seems to have a larger effect for the
eams on the Elevation plane, and a lower effect for theones on the Azimuth plane.Figure 19: Beam13 – 0° vs 180° - EL 0.05degTheta Sin(Phi)806040200-40 -20 0 20 40Theta Cos(Phi)Figure 16: Beam9 – 0° vs 180° - EL 0.05degTheta Sin(Phi)806040200-40 -20 0 20 40Theta Cos(Phi)Figure 17: Beam9 – 0° vs 180° - EL 0.1degTheta Sin(Phi)40200-20-400 20 40 60 80Theta Cos(Phi)Figure 18: Beam13 – 0° vs 180° - EL 0.1degTheta Sin(Phi)402004. <strong>Antenna</strong> Performances Comparisons: theconclusion of the test range assessment was thecomparison between the performances obtainedby the post-processing of the data coming fromthe three different facilities and comparing themwith the total uncertainties defined before. Allthe evaluated delta fall in the range of the totaluncertainty of the relevant facilities (RSS ofeach facility uncertainty), showing that approachused to assess the SNF error budget, produced,likely, a “pessimistic” scenario of the facilityperformances.7. SUMMARYA general description of the New <strong>Spherical</strong> <strong>Near</strong> <strong>Field</strong>installed and validated in TAS-I Rome to support theGLB2 L-band <strong>RX</strong> Active antenna is shown. Thecomparisons of the Active <strong>Antenna</strong> Breadboardmeasurements, in terms of copolar and cross polarpatterns and the post-processing data show a very goodconvergence. This ensured a successful test facilityvalidation and the definition of performance uncertaintybudgets for the GBL2 antenna production program.8. REFERENCESHansen, J.E. Editor (1988), <strong>Spherical</strong> <strong>Near</strong> <strong>Field</strong> <strong>Antenna</strong><strong>Measurement</strong>, Peter Peregrinus Ltd.Allen C. Newell, Greg Hindman, The Alignment of a<strong>Spherical</strong> <strong>Near</strong> <strong>Field</strong> Rotator using Electrical<strong>Measurement</strong>s, in the proceedings of the 19 th annualAMTA Meeting and Symposium, 1997Allen C. Newell, Greg Hindman, The Effect of<strong>Measurement</strong> Geometry on Alignment Errors in <strong>Spherical</strong><strong>Near</strong> <strong>Field</strong> <strong>Measurement</strong>s , In the proceedings of the 21 thannual AMTA meeting and Symposium, 1999.Allen C. Newell, Daniël Janse van Rensburg, Estimatingthe Uncertainties due to Position Errors in <strong>Spherical</strong><strong>Near</strong>-<strong>Field</strong> <strong>Measurement</strong>s, in the Proceedings of the 25 thannual AMTA Meeting and Symposium, 2003Allen C.Newell, Greg Hindman, Quantifying the Effect ofPosition Errors in <strong>Spherical</strong> <strong>Near</strong>-<strong>Field</strong> <strong>Measurement</strong>s,in the proceeding of the 20 th annual AMTA meeting andSymposium, 1998.-20-400 20 40 60 80Theta Cos(Phi)