EHF Rotman Lens Fed Linear Array Multibeam Planar Near-Field ...
EHF Rotman Lens Fed Linear Array Multibeam Planar Near-Field ...
EHF Rotman Lens Fed Linear Array Multibeam Planar Near-Field ...

You also want an ePaper? Increase the reach of your titles
YUMPU automatically turns print PDFs into web optimized ePapers that Google loves.
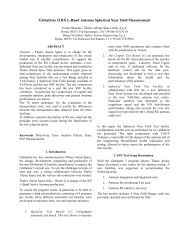
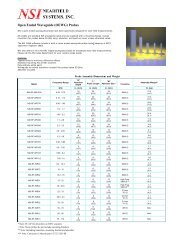
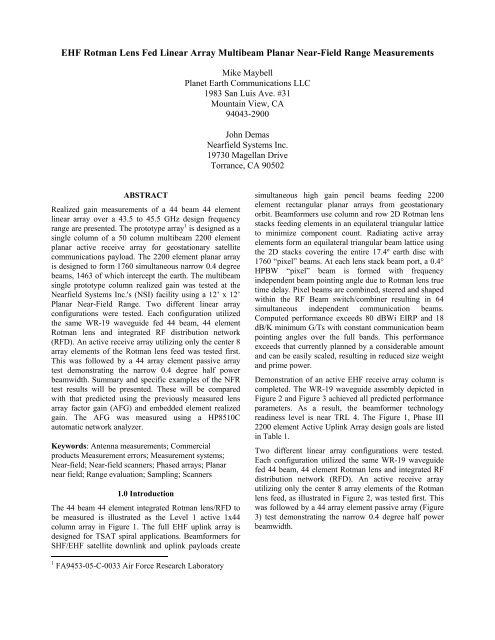
<strong>EHF</strong> <strong>Rotman</strong> <strong>Lens</strong> <strong>Fed</strong> <strong>Linear</strong> <strong>Array</strong> <strong>Multibeam</strong> <strong>Planar</strong> <strong>Near</strong>-<strong>Field</strong> Range MeasurementsMike MaybellPlanet Earth Communications LLC1983 San Luis Ave. #31Mountain View, CA94043-2900John Demas<strong>Near</strong>field Systems Inc.19730 Magellan DriveTorrance, CA 90502ABSTRACTRealized gain measurements of a 44 beam 44 elementlinear array over a 43.5 to 45.5 GHz design frequencyrange are presented. The prototype array 1 is designed as asingle column of a 50 column multibeam 2200 elementplanar active receive array for geostationary satellitecommunications payload. The 2200 element planar arrayis designed to form 1760 simultaneous narrow 0.4 degreebeams, 1463 of which intercept the earth. The multibeamsingle prototype column realized gain was tested at the<strong>Near</strong>field Systems Inc.'s (NSI) facility using a 12’ x 12’<strong>Planar</strong> <strong>Near</strong>-<strong>Field</strong> Range. Two different linear arrayconfigurations were tested. Each configuration utilizedthe same WR-19 waveguide fed 44 beam, 44 element<strong>Rotman</strong> lens and integrated RF distribution network(RFD). An active receive array utilizing only the center 8array elements of the <strong>Rotman</strong> lens feed was tested first.This was followed by a 44 array element passive arraytest demonstrating the narrow 0.4 degree half powerbeamwidth. Summary and specific examples of the NFRtest results will be presented. These will be comparedwith that predicted using the previously measured lensarray factor gain (AFG) and embedded element realizedgain. The AFG was measured using a HP8510Cautomatic network analyzer.Keywords: Antenna measurements; Commercialproducts Measurement errors; Measurement systems;<strong>Near</strong>-field; <strong>Near</strong>-field scanners; Phased arrays; <strong>Planar</strong>near field; Range evaluation; Sampling; Scanners1.0 IntroductionThe 44 beam 44 element integrated <strong>Rotman</strong> lens/RFD tobe measured is illustrated as the Level 1 active 1x44column array in Figure 1. The full <strong>EHF</strong> uplink array isdesigned for TSAT spiral applications. Beamformers forSHF/<strong>EHF</strong> satellite downlink and uplink payloads createsimultaneous high gain pencil beams feeding 2200element rectangular planar arrays from geostationaryorbit. Beamformers use column and row 2D <strong>Rotman</strong> lensstacks feeding elements in an equilateral triangular latticeto minimize component count. Radiating active arrayelements form an equilateral triangular beam lattice usingthe 2D stacks covering the entire 17.4º earth disc with1760 “pixel” beams. At each lens stack beam port, a 0.4°HPBW “pixel” beam is formed with frequencyindependent beam pointing angle due to <strong>Rotman</strong> lens truetime delay. Pixel beams are combined, steered and shapedwithin the RF Beam switch/combiner resulting in 64simultaneous independent communication beams.Computed performance exceeds 80 dBWi EIRP and 18dB/K minimum G/Ts with constant communication beampointing angles over the full bands. This performanceexceeds that currently planned by a considerable amountand can be easily scaled, resulting in reduced size weightand prime power.Demonstration of an active <strong>EHF</strong> receive array column iscompleted. The WR-19 waveguide assembly depicted inFigure 2 and Figure 3 achieved all predicted performanceparameters. As a result, the beamformer technologyreadiness level is near TRL 4. The Figure 1, Phase III2200 element Active Uplink <strong>Array</strong> design goals are listedin Table 1.Two different linear array configurations were tested.Each configuration utilized the same WR-19 waveguidefed 44 beam, 44 element <strong>Rotman</strong> lens and integrated RFdistribution network (RFD). An active receive arrayutilizing only the center 8 array elements of the <strong>Rotman</strong>lens feed, as illustrated in Figure 2, was tested first. Thiswas followed by a 44 array element passive array (Figure3) test demonstrating the narrow 0.4 degree half powerbeamwidth.1 FA9453-05-C-0033 Air Force Research Laboratory
60”RF SW Matrix/Combiner(1463x64)Level 2Row lens (44)Level 1Column<strong>Lens</strong>(50)PyramidalHornHPFL/ExtensionLNA0.086” Semi-Rigid CoaxWR-19/2.4mmEnd LaunchTransition36”Level 1ColumnActive1x44<strong>Array</strong>ActiveReceive<strong>Planar</strong><strong>Array</strong>(44x50)<strong>Rotman</strong> lens/RFDWR-19 Shim35”Figure 1 – <strong>EHF</strong> Active Uplink <strong>Array</strong>; 64 Beams 2200ElementsFigure 2 – <strong>EHF</strong> Active Uplink <strong>Array</strong> 8 Element RFChain and <strong>Lens</strong>/RFDTable 1 - <strong>EHF</strong> Uplink 2200 Element Active <strong>Planar</strong><strong>Array</strong> Design GoalsReceive Active <strong>Array</strong> Design GoalsParameter Value UnitsReceive <strong>Array</strong> SizeAperture Length35.5 inchAperture Width34.9 inchAperture Payload Depth60 inchColumn Spacing2.6 λNumber <strong>Array</strong> Elements 2200<strong>Array</strong> Beam PerformanceOperating Frequency (min.)43.5 GHzOperating Frequency (max.)45.5 GHzPeak Gain52.2 dBiHalf Power Beamwidth0.4 DegreeNumber Pixel Earth Beams 1463Number Simultaneous Comm. Beams 64FOV Radius (Geo)8.5 DegreeElement Aperture Efficiency 85 %Element FOV Relative Gain (min.)-1.5 dBi<strong>Array</strong> G/T PerformanceLNARF Loss before LNA0.5 dBLNA Noise Figure2 dBPeak G/T at 0.0 deg. ScanPeak G/T at max. ScanEOC beam box G/T at max. scan21 dB/K19.55 dB/K18 dB/K<strong>Array</strong> Power And WeightDC Power850 WattDissipation850 WattWeight 630 lbs2.0 <strong>Rotman</strong> lens/<strong>Array</strong>/RFD Column ComputedRealized GainThe 8 element active and 44 element passive uplinklens/RFD/array/realized gain (G R ) was predicted usingFigure 3 - 44 Element Passive <strong>Array</strong> & lens/RFD atNSI NFR with Mounting Fixture & <strong>Near</strong> <strong>Field</strong> Probethe previously measured lens array factor gain (AFG) andcomputed embedded element realized gain (G E ). TheAFG was measured using a HP8510C automatic networkanalyzer. According to IEEE Std 145-1983, define AFGas “array factor” as follows:
“array factor. The radiation pattern of an array antennawhen each array element is considered to radiateisotropically.NOTE: When the radiation patterns of individual arrayelements are identical, and the array elements arecongruent under translation, then the product of the arrayfactor and the element radiation pattern gives theradiation pattern of the entire array.”Assuming that the linear array is disposed along the Y-axis with its normal pointed to θ=0 in the principal Y-Zplane (φ = π/2):GRA∑G( θ ) =λ(1)E nBn=1( θ)Sen2πdj sin( θ )Where S nB is the measured lens/RFD transmissionscattering parameter from beam port B to array port n.Since the element spacing is d/λ = 2.6, and the maximumcoupling between any two of the widely spaced arrayelements is -36 dB, the gain of all elements is identicaland the embedded element gain is essentially equal to theisolated element gain:GGRGA∑S( θ ) = ( θ )λ(2)GEn=1nBAFGen2πdj sin( θ )( θ ) = ( θ ) ( θ )(3)R EG R (θ) dBi = G E (θ) dBi + AFG(θ) dB (4)Embedded Element Gain term G E (θ) in (3) is thatcomputed using CST Microwave Studio Time DomainSolver (CST MWS TDS).3.0 Pyramidal Horn Element Computed and NFRMeasured Realized GainSince the primary goal is development of the <strong>Rotman</strong>lens/RFD beamformer, and not the development of anarray element, it was decided to use linearly polarizedpyramidal horn elements for the radiation pattern relatedtesting of the beamformer. For a Phase III spacecraftantenna, a circularly polarized element with high apertureillumination efficiency would be designed. The elementdesign selected would probably be a multimode conicalor pyramidal horn with integrated polarizer. Thepyramidal horn selected for this Phase II contract efforthas well understood radiation patterns, is relativelyefficient, and is extremely low risk.Plots of CST MWS TDS computed realized gainradiation patterns G E (θ) compared with those measuredfor horn number 8 are presented in Figure 4.Realized Gain (dBiL)Realized Gain (dBiL)20151050-5-10-15-20-25-3020151050-5-10-15-20-25-30Pyramidal Horn Element CST MWS ComputedRealized Gain E-Plane Radiation Pattern43.5 GHz E-Plane Realized Gain (dBiL)45.5 GHz E-Plane Realized Gain (dBiL)-70.00-60.00-50.00-40.00-30.00-20.00-10.000.0010.0020.0030.0040.0050.0060.0070.00Angle From Boresight (deg)CST H-Plane Radiation Pattern43.5 GHz H-Plane Realized Gain (dBiL)45.5 GHz H-Plane Realized Gain (dBiL)-70.00-60.00-50.00-40.00-30.00-20.00-10.000.0010.0020.0030.0040.0050.0060.0070.00Angle From Boresight (deg)Figure 4 - Pyramidal Horn Element Computed vs.Measured Realized Gain Radiation PatternsThe realized gain of the pyramidal horn using CST MWSTDS compared with that measured using <strong>Near</strong>fieldSystems Inc.'s (NSI) <strong>Near</strong> <strong>Field</strong> Range is plotted inFigure 5. The maximum difference between the computedrealized gain and that measured is less than 0.2 dB.Gain (dBiL)18.718.6518.618.5518.518.4518.418.3518.318.2518.218.1518.118.0518CST MWS Computed Realized Gain (dBiL)NFR Measured horn 7 (dBiL)NFR Measured horn 8 (dBiL)43.5 43.7 43.9 44.1 44.3 44.5 44.7 44.9 45.1 45.3 45.5Frequency (GHz)Figure 5 - Pyramidal Horn Element CST MWS TDSComputed vs. Measured Realized GainThe CST MWS computed E-Plane realized gain G E (θ)dBi in (4) and the measured lens array factor AFG(θ) dBis used to compute the realized gain of the 8 elementactive array and 44 element passive array integrated withthe Deliverable lens/RFD. The data required is at the 44beam peak angles from -8º to +8º with respect topyramidal horn aperture normal. The difference statisticsbetween the CST MWS computed realized gain and theNFR measured realized gain (mean measured gain ofhorn S/N007 and S/N008) at each beam peak angle and at
all 5 frequencies is documented in Table 2. The meangain difference between model and measured data overthe 220 points is 0.015 dB. The maximum P-P differencebetween measured and computed gain is 0.480 dB at theworst-case frequency. The standard deviation averagedover 5 frequencies measured 0.072 dB.Table 2 - Pyramidal Horn Element NFR Measured -CST Computed Realized Gain StatisticsPyramidal Horn Element NFR Measured - CST Computed Realized Gain44 Beam Port F (GHz) F (GHz) F (GHz) F (GHz) F (GHz)Angles 43.50 44.00 44.50 45.00 45.50 5 FrqMean -0.150 -0.027 -0.130 0.170 0.059 -0.015MAX -0.097 0.172 0.074 0.299 0.151 0.299MIN -0.188 -0.116 -0.405 0.101 -0.082 -0.405P-P 0.091 0.287 0.480 0.198 0.233 0.4801 sigma 0.028 0.080 0.128 0.060 0.062 0.072measured data over the 65 points is 0.048 dB. Themaximum P-P difference between measured andcomputed gain is 1.269 dB at the worst-case frequency.The standard deviation averaged over 5 frequenciesmeasured 0.271 dB.Table 3 - Eight Element Active <strong>Array</strong>/lens/RFD NFRMeasured - CST Computed Realized Gain Statistics8 Elt Active <strong>Array</strong> ([NFR Measured Realized Gain]-[AF + CST MWS Computed Horn Gain])13 Beam Port F (GHz) F (GHz F (GHz) F (GHz) F (GHz)Angles 43.50 44.00 44.50 45.00 45.50 5 FrqMean -0.548 -0.429 -0.141 0.952 0.404 0.048MAX -0.113 0.128 0.379 1.640 1.097 1.640MIN -0.860 -0.853 -0.492 0.371 0.072 -0.860P-P 0.747 0.980 0.871 1.269 1.025 1.2691 sigma 0.259 0.234 0.241 0.343 0.279 0.2714. Eight Element <strong>Lens</strong>/RFD Active <strong>Array</strong> NFR TestResultsThe 8 element active array integrated with theDeliverable lens/RFD was tested for realized gain usinga <strong>Planar</strong> 12’ x 12’ NFR. Gain for all 44 beam ports wasmeasured.To provide a means of predicting the measured NFRgain of the eight element active array integrated with thelens/RFD, the assembly shown in Figure 2, but withoutthe 8 pyramidal horns, was measured using an HP8510CANA. <strong>Array</strong> Factor was computed for Beam Ports B02,B06, B10, B14, B18, B22, B23, B27, B31, B32, B35,B39, and B43. An 8 element active computed <strong>Array</strong>Factor rosette using the HP8510C measured S-parameterdata at 44.5 GHz is presented in Figure 6. Note that theHPBW for the 8 element active beams is about 2º,whereas the HPBW for the 44 element passive beams is0.4º (Figure 10) due to the 5.5 times larger passive arrayaperture.Figure 6 - <strong>Array</strong> Factor Calculated <strong>Lens</strong>/RFD 8Element Active Rosette at 44.5 GHz 13 Beam PortsFigure 7 is an overly plot of 8 Element Active <strong>Array</strong>lens/RFD Calculated and NFR Measured Realized Gainfor the same 13 beam ports as those computed forAFG(θ) dB in Figure 6. The method for computing therealized gain (dashed lines) in Figure 7 is to add CSTMWS TDS computed realized gain G E (θ) dBi in Figure4 to AFG(θ) dB from Figure 6 according to equation (4).The data required is at the 13 beam peak angles from -8ºto +8º with respect to pyramidal horn aperture normal.The difference statistics between the CST MWS/<strong>Array</strong>Factor computed realized gain and the NFR measuredrealized gain for the 8 element active assembly at eachbeam peak angle and at all 5 frequencies is documentedin Table 3. The mean gain difference between model andFigure 7 - Eight Element Active <strong>Array</strong> Deliverable lens/RFDCalculated and Measured Realized Gain Overlay Bench(dashedlines), NFR(solid lines) 44.5 GHz 13 Beam Ports
Figure 8 shows measured NFR realized gain of the 8element active array of Figure 2 for all 44 beam ports at44.5 GHz.The standard deviation averaged over 5 frequenciesmeasured 0.174 dB.Figure 8 - Eight Element Active <strong>Array</strong> lens/RFD MeasuredRealized Gain NFR 44.5 GHz for all 44 Beam PortsFigure 9 - 44 Element Passive <strong>Array</strong>/lens/RFD at NSINFR with Mounting Fixture5. Forty-Four Element <strong>Lens</strong>/RFD Passive <strong>Array</strong> NFRTest ResultsThe 44 element passive array integrated with theDeliverable lens/RFD was tested for realized gain using a<strong>Planar</strong> 12’x18’ NFR. Gain for all 44 beam ports wasmeasured. The passive array mounting in the NFR testsetup is illustrated in Figure 9.To provide a means of predicting the measured NFR gainof the 44 element passive array integrated with thelens/RFD, the lens/RFD assembly shown in Figure 2 butwithout the 44 pyramidal horns was measured using anHP8510C ANA. <strong>Array</strong> Factor was computed for all 44Beam Ports. A 44 element passive computed <strong>Array</strong> Factorrosette using the HP8510C measured S-parameter data at44.5 GHz is presented in Figure 10. Note that the HPBWfor the 44 element passive beams is 0.4º as expected.Figure 11 is an overly plot of 44 Element Passive <strong>Array</strong>lens/RFD calculated and NFR Measured Realized Gainfor all 44 beam ports. The method for computing therealized gain (dashed lines) in Figure 11 is to add CSTMWS TDS computed realized gain G E (θ) dBi in Figure 4to AFG(θ) dB from Figure 10 according to equation (4).The difference statistics between the CST MWS / <strong>Array</strong>Factor computed realized gain and the NFR measuredrealized gain at each beam peak angle and at all 5frequencies is documented for the 44 element passiveassembly in Table 4. The mean gain difference betweenmodel and measured data over the 220 points is 0.329 dB.The maximum P-P difference between measured andcomputed gain is 0.879 dB at the worst case frequency.Figure 10 - <strong>Array</strong> Factor Calculated <strong>Lens</strong>/RFD 44Element Passive Rosette at 44.5 GHz 44 Beam PortsRealized Gain (dBiL)Figure 11 - 44 Element Passive <strong>Array</strong> lens/RFDCalculated(dashed) and Measured(solid) RealizedGain
Table 4 - 44 Element Passive <strong>Array</strong>/lens/RFD NFRMeasured - CST Computed Realized Gain Statistics44 Elt Passive <strong>Array</strong> ([NFR Measured Realized Gain]-[AF + CST MWS Computed Horn Gain])44 Beam Port F (GHz) F (GHz) F (GHz) F (GHz) F (GHz)Angles 43.50 44.00 44.50 45.00 45.50 5 FrqMean 0.214 0.103 0.299 0.454 0.573 0.329MAX 0.598 0.441 0.572 1.022 0.902 1.022MIN -0.144 -0.278 -0.274 0.142 0.229 -0.278P-P 0.742 0.719 0.847 0.879 0.673 0.8791 sigma 0.164 0.170 0.173 0.177 0.188 0.1745. NFR Measurement AccuracyThe NFR testing was performed at <strong>Near</strong>field SystemsInc., Torrance, Calif., on 5/8/07 - 5/11/07, using their<strong>Planar</strong> 12’ x 12’ NFR. The RF test block diagram isshown in Figure 12.Gain Standard Uncertainty. For both direct andcomparison gain measurements, a gain standard isrequired, and the uncertainty in the gain of the standardis the largest contributor to the uncertainty in the gain ofthe AUT. The calibration was performed at the 2.4mmcoaxial terminal using the 3 Antenna Method. For thesemeasurements, the gain standard estimated uncertainty is0.2 dB.Impedance Mismatch Factor. One or more cable-toantennaconnections must be changed to accomplish thegain measurement, and since the AUT, gain standard,and cables are not perfectly matched, a mismatchcorrection should be applied. The mismatch was notcalculated for the current measurements, and fromsimilar measurements this causes an uncertainty of 0.05dB.RF Source11.25 GHzLO Source15.00667 GHzMultiplierx445.0 GHzLOLO to RefCouplerLO to TestMixers operate in3 rd harmonic mode-10 dBRefMixerRef IFProbeRefAUTPanther ReceiverSigPadTestMixerLOLO/IF UnitTest IFReceiver displays Sig/RefFigure 12 NFR RF Test Block DiagramPeak Far-<strong>Field</strong> Peak Amplitude for Gain Standard. Forthe comparison gain method, a near-field measurementmust be performed on the gain standard and the dataprocessed to determine its Far-<strong>Field</strong> Peak (FFP). Thereis some uncertainty in this FFP, and the primary errorsources in planar measurements are:Multiple Reflections between the horn and probe. Thisis usually evaluated with multiple-Z measurements, butthese were not obtained. The reflections cause adistortion on the peak of the beam, which was not seenat any of the measurement frequencies. It is estimatedthat this uncertainty is about 0.1 dB or less.Truncation of the near-field data for the standard gainhorn. The near-field data for the gain standard wastruncated in steps with an analysis script to show that thetruncation uncertainty was approximately 0.02 dB.Bias error leakage within the receiver. An analysisscript was used to estimate the bias leakage signal levelfor the gain horn data. It was found that the error signalwas 105 dB below the peak of the near field peak andwould cause less than a 0.02 dB uncertainty in the farfieldpeak.Room scattering. Room scattering measurements werenot performed, but the absence of distortion on the peakof the horn main beam indicates that the uncertainty dueto this source is less than 0.1 dB. Table 5 summarizesthe estimated uncertainties for a comparison gainmeasurementTable 5 - Probable uncertainties in peak far-field gainTerm dBGain Standard 0.20Mismatch 0.05SGH FF Peak 0.15Total (RSS) 0.257. SummaryThe primary emphasis of this paper was to compare theaccuracy of predicting the realized gain usingfundamental array theory with NFR measurements. An 8element active array and a 44 element passive array wereboth tested. The mean gain difference between model andmeasured data is 0.048 dB for the active array and 0.329dB for the passive array. Overall NFR peak gainmeasurement accuracy is estimated as 0.25 dB.8. REFERENCES[1] Maybell, M.J., Chan, K.K. Simon, P.S., “<strong>Rotman</strong><strong>Lens</strong> Recent Developments 1994-2005”, IEEE AP SProceedings, July 2005, Washington, D.C.9. ACKNOWLEDGMENTSThe authors wish to thank Mr. Joseph Chavez, programmanager for contract FA9453-05-C-0033, Air ForceResearch Laboratory, Space Vehicles Directorate,Kirtland Air Force Base, N.M. In addition, thanks to Dr.Alan Cherrette of NGST for invaluable technicalguidance and NGST test facilities’ support during thecontract.