Diversity in Toronto: A Community Profile

You also want an ePaper? Increase the reach of your titles
YUMPU automatically turns print PDFs into web optimized ePapers that Google loves.
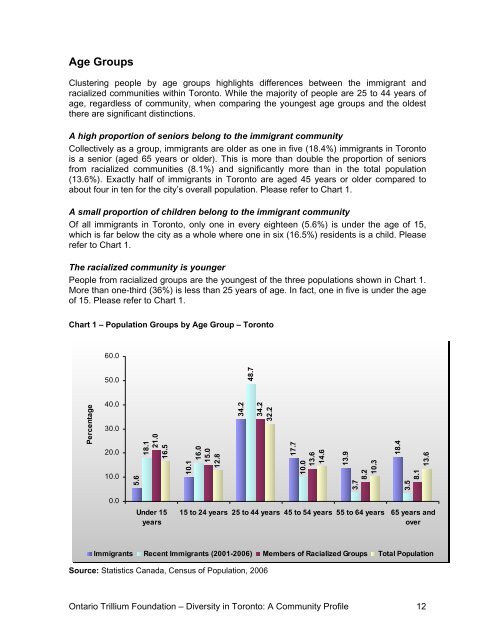
Age Groups<br />
Cluster<strong>in</strong>g people by age groups highlights differences between the immigrant and<br />
racialized communities with<strong>in</strong> <strong>Toronto</strong>. While the majority of people are 25 to 44 years of<br />
age, regardless of community, when compar<strong>in</strong>g the youngest age groups and the oldest<br />
there are significant dist<strong>in</strong>ctions.<br />
A high proportion of seniors belong to the immigrant community<br />
Collectively as a group, immigrants are older as one <strong>in</strong> five (18.4%) immigrants <strong>in</strong> <strong>Toronto</strong><br />
is a senior (aged 65 years or older). This is more than double the proportion of seniors<br />
from racialized communities (8.1%) and significantly more than <strong>in</strong> the total population<br />
(13.6%). Exactly half of immigrants <strong>in</strong> <strong>Toronto</strong> are aged 45 years or older compared to<br />
about four <strong>in</strong> ten for the city’s overall population. Please refer to Chart 1.<br />
A small proportion of children belong to the immigrant community<br />
Of all immigrants <strong>in</strong> <strong>Toronto</strong>, only one <strong>in</strong> every eighteen (5.6%) is under the age of 15,<br />
which is far below the city as a whole where one <strong>in</strong> six (16.5%) residents is a child. Please<br />
refer to Chart 1.<br />
The racialized community is younger<br />
People from racialized groups are the youngest of the three populations shown <strong>in</strong> Chart 1.<br />
More than one-third (36%) is less than 25 years of age. In fact, one <strong>in</strong> five is under the age<br />
of 15. Please refer to Chart 1.<br />
Chart 1 – Population Groups by Age Group – <strong>Toronto</strong><br />
60.0<br />
50.0<br />
48.7<br />
Percentage<br />
40.0<br />
30.0<br />
20.0<br />
10.0<br />
5.6<br />
18.1<br />
21.0<br />
16.5<br />
10.1<br />
16.0<br />
15.0<br />
12.8<br />
34.2<br />
34.2<br />
32.2<br />
17.7<br />
10.0<br />
13.6<br />
14.6<br />
13.9<br />
3.7<br />
8.2<br />
10.3<br />
18.4<br />
3.5<br />
8.1<br />
13.6<br />
0.0<br />
Under 15<br />
years<br />
15 to 24 years 25 to 44 years 45 to 54 years 55 to 64 years 65 years and<br />
over<br />
Immigrants Recent Immigrants (2001-2006) Members of Racialized Groups Total Population<br />
Source: Statistics Canada, Census of Population, 2006<br />
Ontario Trillium Foundation – <strong>Diversity</strong> <strong>in</strong> <strong>Toronto</strong>: A <strong>Community</strong> <strong>Profile</strong> 12