Diversity in Toronto: A Community Profile

You also want an ePaper? Increase the reach of your titles
YUMPU automatically turns print PDFs into web optimized ePapers that Google loves.
Unemployment<br />
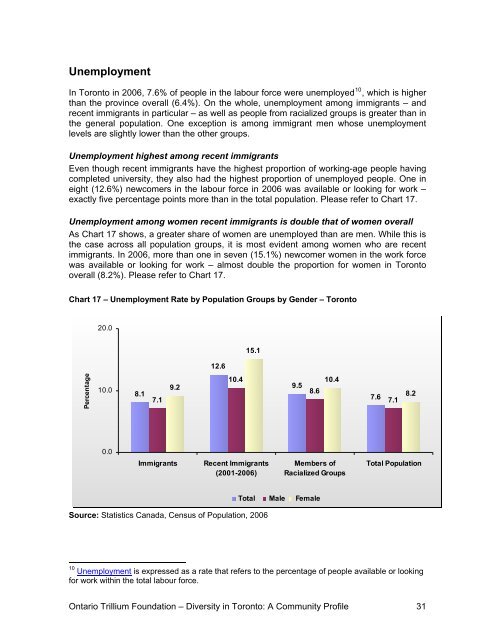
In <strong>Toronto</strong> <strong>in</strong> 2006, 7.6% of people <strong>in</strong> the labour force were unemployed 10 , which is higher<br />
than the prov<strong>in</strong>ce overall (6.4%). On the whole, unemployment among immigrants – and<br />
recent immigrants <strong>in</strong> particular – as well as people from racialized groups is greater than <strong>in</strong><br />
the general population. One exception is among immigrant men whose unemployment<br />
levels are slightly lower than the other groups.<br />
Unemployment highest among recent immigrants<br />
Even though recent immigrants have the highest proportion of work<strong>in</strong>g-age people hav<strong>in</strong>g<br />
completed university, they also had the highest proportion of unemployed people. One <strong>in</strong><br />
eight (12.6%) newcomers <strong>in</strong> the labour force <strong>in</strong> 2006 was available or look<strong>in</strong>g for work –<br />
exactly five percentage po<strong>in</strong>ts more than <strong>in</strong> the total population. Please refer to Chart 17.<br />
Unemployment among women recent immigrants is double that of women overall<br />
As Chart 17 shows, a greater share of women are unemployed than are men. While this is<br />
the case across all population groups, it is most evident among women who are recent<br />
immigrants. In 2006, more than one <strong>in</strong> seven (15.1%) newcomer women <strong>in</strong> the work force<br />
was available or look<strong>in</strong>g for work – almost double the proportion for women <strong>in</strong> <strong>Toronto</strong><br />
overall (8.2%). Please refer to Chart 17.<br />
Chart 17 – Unemployment Rate by Population Groups by Gender – <strong>Toronto</strong><br />
20.0<br />
15.1<br />
12.6<br />
Percentage<br />
10.0<br />
8.1<br />
7.1<br />
9.2<br />
10.4<br />
9.5<br />
8.6<br />
10.4<br />
7.6<br />
7.1<br />
8.2<br />
0.0<br />
Immigrants<br />
Recent Immigrants<br />
(2001-2006)<br />
Members of<br />
Racialized Groups<br />
Total Population<br />
Source: Statistics Canada, Census of Population, 2006<br />
Total Male Female<br />
10 Unemployment is expressed as a rate that refers to the percentage of people available or look<strong>in</strong>g<br />
for work with<strong>in</strong> the total labour force.<br />
Ontario Trillium Foundation – <strong>Diversity</strong> <strong>in</strong> <strong>Toronto</strong>: A <strong>Community</strong> <strong>Profile</strong> 31