Annual report - Alcopa
Annual report - Alcopa
Annual report - Alcopa

You also want an ePaper? Increase the reach of your titles
YUMPU automatically turns print PDFs into web optimized ePapers that Google loves.
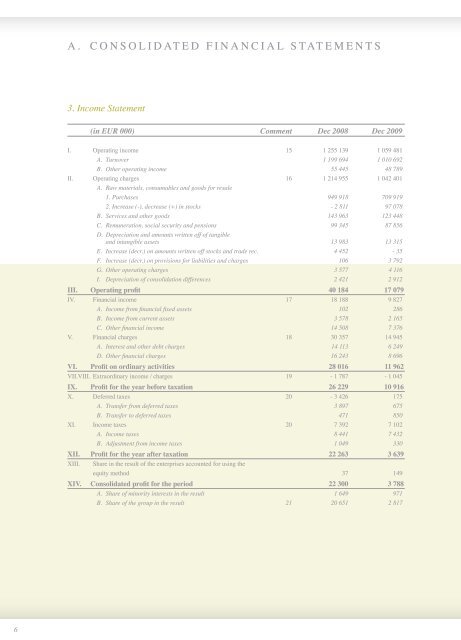
A. Consolidated Financial Statements<br />
3. Income Statement<br />
4. Cash Flow Statement<br />
(in EUR 000) Comment Dec 2008 Dec 2009<br />
I. Operating income 15 1 255 139 1 059 481<br />
A. Turnover 1 199 694 1 010 692<br />
B. Other operating income 55 445 48 789<br />
II. Operating charges 16 1 214 955 1 042 401<br />
A. Raw materials, consumables and goods for resale<br />
1. Purchases 949 918 709 919<br />
2. Increase (-), decrease (+) in stocks - 2 811 97 078<br />
B. Services and other goods 143 963 123 448<br />
C. Remuneration, social security and pensions 99 345 87 856<br />
D. Depreciation and amounts written off of tangible<br />
and intangible assets 13 983 13 315<br />
E. Increase (decr.) on amounts written off stocks and trade rec. 4 452 - 35<br />
F. Increase (decr.) on provisions for liabilities and charges 106 3 792<br />
G. Other operating charges 3 577 4 116<br />
I. Depreciation of consolidation differences 2 421 2 912<br />
III. Operating profit 40 184 17 079<br />
IV. Financial income 17 18 188 9 827<br />
A. Income from financial fixed assets 102 286<br />
B. Income from current assets 3 578 2 165<br />
C. Other financial income 14 508 7 376<br />
V. Financial charges 18 30 357 14 945<br />
A. Interest and other debt charges 14 113 6 249<br />
D. Other financial charges 16 243 8 696<br />
VI. Profit on ordinary activities 28 016 11 962<br />
VII.VIII. Extraordinary income / charges 19 - 1 787 - 1 045<br />
IX. Profit for the year before taxation 26 229 10 916<br />
X. Deferred taxes 20 - 3 426 175<br />
A. Transfer from deferred taxes 3 897 675<br />
B. Transfer to deferred taxes 471 850<br />
XI. Income taxes 20 7 392 7 102<br />
A. Income taxes 8 441 7 432<br />
B. Adjustment from income taxes 1 049 330<br />
XII. Profit for the year after taxation 22 263 3 639<br />
XIII. Share in the result of the enterprises accounted for using the<br />
equity method 37 149<br />
XIV. Consolidated profit for the period 22 300 3 788<br />
A. Share of minority interests in the result 1 649 971<br />
B. Share of the group in the result 21 20 651 2 817<br />
(in EUR 000) Comment Dec 2008 Dec 2009<br />
22<br />
OPERATING ACTIVITIES 23<br />
Share of the group in the result 20.651 2.817<br />
Share of minority interests in the result 1.649 971<br />
Share in the result of the enterprises accounted for using<br />
the equity method, net of dividends received - 37 - 149<br />
Depreciation of tangible fixed assets 12.728 12.071<br />
Depreciation of formation expenses, intangible fixed assets<br />
and consolidation differences 3.676 4.199<br />
Increase (decrease) on amounts written off stocks and trade receivables 4.452 - 35<br />
Amortisation of investment grants -3 - 7<br />
Write-downs (write-backs) on financial fixed assets 0 0<br />
Increase (decrease) on provisions for liabilities and charges 4.100 2.519<br />
Increase (decrease) in deferred taxes - 1.928 - 120<br />
(Gain) loss on disposal of fixed assets - 3.532 - 6.164<br />
Cash flow 41.757 16.102<br />
(Increase) decrease in net working capital requirements for operations - 7.129 114.458<br />
Impact of changes in scope of consolidation and translation adjustments<br />
on working capital requirements and on net cash and equivalents - 471 - 2.656<br />
NET CASH PROVIDED BY (USED IN) OPERATING ACTIVITIES 34.157 127.904<br />
INVESTMENT ACTIVITIES 24<br />
Acquisitions of formation expenses and intangible fixed assets - 719 - 1.823<br />
Acquisition of tangible fixed assets - 26.216 - 23.691<br />
Acquisition of subsidiaries (including consolidation differences) - 26.240 - 1.928<br />
New loans extended 0 0<br />
Sale of tangible fixed assets 23.319 24.071<br />
Sale of intangible fixed assets 143<br />
Sale of financial assets and investments 597 464<br />
Change in consolidated fixed assets circle - 10.675 370<br />
Impact of translation differences on fixed assets - 72<br />
NET CASH PROVIDED BY (USED IN) INVESTMENT ACTIVITIES - 39.934 - 2.465<br />
FINANCING ACTIVITIES 25<br />
Capital increase 0 0<br />
Investment grants 21 0<br />
Net change in loans - 49.576 - 87.413<br />
Dividends paid by the parent company to its shareholders - 6.312 - 5.481<br />
Dividends paid by subsidiaries to the minority shareholders - 168 - 192<br />
NET CASH PROVIDED BY (USED IN) FINANCING ACTIVITIES - 56.036 - 93.086<br />
TOTAL NET CASH 26 - 61.813 32.351<br />
Cash and equivalents at the beginning of the year 113.281 51.468<br />
Cash and equivalents at the end of the year 51.468 83.819<br />
INCREASE (DECREASE) IN NET CASH AND EQUIVALENTS - 61.813 32.351<br />
6 7