Annual report - Alcopa
Annual report - Alcopa
Annual report - Alcopa

You also want an ePaper? Increase the reach of your titles
YUMPU automatically turns print PDFs into web optimized ePapers that Google loves.
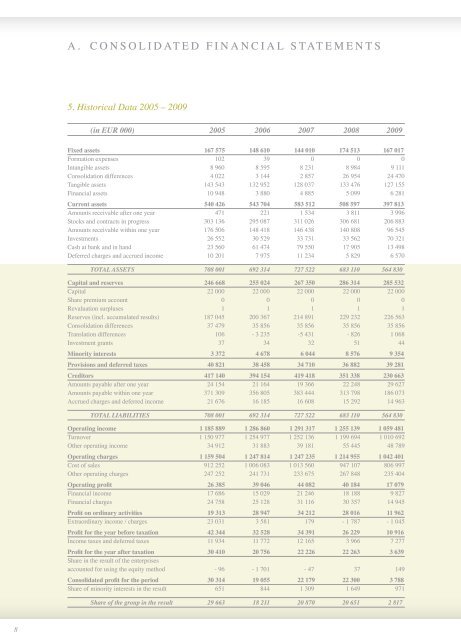
A. Consolidated Financial Statements<br />
5. Historical Data 2005 – 2009<br />
(in EUR 000) 2005 2006 2007 2008 2009<br />
Fixed assets 167 575 148 610 144 010 174 513 167 017<br />
Formation expenses 102 39 0 0 0<br />
Intangible assets 8 960 8 595 8 231 8 984 9 111<br />
Consolidation differences 4 022 3 144 2 857 26 954 24 470<br />
Tangible assets 143 543 132 952 128 037 133 476 127 155<br />
Financial assets 10 948 3 880 4 885 5 099 6 281<br />
Current assets 540 426 543 704 583 512 508 597 397 813<br />
Amounts receivable after one year 471 221 1 534 3 811 3 996<br />
Stocks and contracts in progress 303 136 295 087 311 026 306 681 206 883<br />
Amounts receivable within one year 176 506 148 418 146 438 140 808 96 545<br />
Investments 26 552 30 529 33 731 33 562 70 321<br />
Cash at bank and in hand 23 560 61 474 79 550 17 905 13 498<br />
Deferred charges and accrued income 10 201 7 975 11 234 5 829 6 570<br />
TOTAL ASSETS 708 001 692 314 727 522 683 110 564 830<br />
Capital and reserves 246 668 255 024 267 350 286 314 285 532<br />
Capital 22 000 22 000 22 000 22 000 22 000<br />
Share premium account 0 0 0 0 0<br />
Revaluation surpluses 1 1 1 1 1<br />
Reserves (incl. accumulated results) 187 045 200 367 214 891 229 232 226 563<br />
Consolidation differences 37 479 35 856 35 856 35 856 35 856<br />
Translation differences 106 - 3 235 -5 431 - 826 1 068<br />
Investment grants 37 34 32 51 44<br />
Minority interests 3 372 4 678 6 044 8 576 9 354<br />
Provisions and deferred taxes 40 821 38 458 34 710 36 882 39 281<br />
Creditors 417 140 394 154 419 418 351 338 230 663<br />
Amounts payable after one year 24 154 21 164 19 366 22 248 29 627<br />
Amounts payable within one year 371 309 356 805 383 444 313 798 186 073<br />
Accrued charges and deferred income 21 676 16 185 16 608 15 292 14 963<br />
TOTAL LIABILITIES 708 001 692 314 727 522 683 110 564 830<br />
Operating income 1 185 889 1 286 860 1 291 317 1 255 139 1 059 481<br />
Turnover 1 150 977 1 254 977 1 252 136 1 199 694 1 010 692<br />
Other operating income 34 912 31 883 39 181 55 445 48 789<br />
Operating charges 1 159 504 1 247 814 1 247 235 1 214 955 1 042 401<br />
Cost of sales 912 252 1 006 083 1 013 560 947 107 806 997<br />
Other operating charges 247 252 241 731 233 675 267 848 235 404<br />
Operating profit 26 385 39 046 44 082 40 184 17 079<br />
Financial income 17 686 15 029 21 246 18 188 9 827<br />
Financial charges 24 758 25 128 31 116 30 357 14 945<br />
Profit on ordinary activities 19 313 28 947 34 212 28 016 11 962<br />
Extraordinary income / charges 23 031 3 581 179 - 1 787 - 1 045<br />
Profit for the year before taxation 42 344 32 528 34 391 26 229 10 916<br />
Income taxes and deferred taxes 11 934 11 772 12 165 3 966 7 277<br />
Profit for the year after taxation 30 410 20 756 22 226 22 263 3 639<br />
Share in the result of the enterprises<br />
accounted for using the equity method - 96 - 1 701 - 47 37 149<br />
Consolidated profit for the period 30 314 19 055 22 179 22 300 3 788<br />
Share of minority interests in the result 651 844 1 309 1 649 971<br />
Share of the group in the result 29 663 18 211 20 870 20 651 2 817<br />
8 9