Technical Bulletin 91-001 Nitrogen Loading - Cape Cod Commission
Technical Bulletin 91-001 Nitrogen Loading - Cape Cod Commission
Technical Bulletin 91-001 Nitrogen Loading - Cape Cod Commission

Create successful ePaper yourself
Turn your PDF publications into a flip-book with our unique Google optimized e-Paper software.
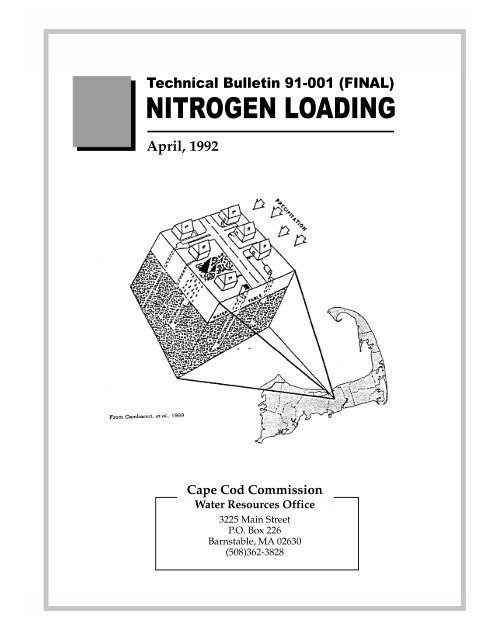
<strong>Technical</strong> <strong>Bulletin</strong> <strong>91</strong>-<strong>001</strong> (FINAL)<br />
NITROGEN LOADING<br />
April, 1992<br />
<strong>Technical</strong> <strong>Bulletin</strong> <strong>91</strong>-<strong>001</strong> (FINAL)<br />
NITROGEN LOADING<br />
April, 1992<br />
<strong>Cape</strong> <strong>Cod</strong> <strong>Commission</strong><br />
Water Resources Office<br />
3225 Main Street<br />
P.O. Box 226<br />
Barnstable, MA 02630<br />
(508)362-3828<br />
Water Resources Office <strong>Cape</strong> <strong>Cod</strong> <strong>Commission</strong>
<strong>Technical</strong> <strong>Bulletin</strong> <strong>91</strong>-<strong>001</strong> (FINAL)<br />
NITROGEN LOADING<br />
April, 1992<br />
Water Resources Office <strong>Cape</strong> <strong>Cod</strong> <strong>Commission</strong>
<strong>Technical</strong> <strong>Bulletin</strong> <strong>91</strong>-<strong>001</strong> (FINAL)<br />
NITROGEN LOADING<br />
April, 1992<br />
<strong>Technical</strong> <strong>Bulletin</strong> <strong>91</strong>-<strong>001</strong> (FINAL)<br />
NITROGEN LOADING<br />
April, 1992<br />
Prepared by<br />
Water Resources Office<br />
Eduard M. Eichner<br />
Water Resources Planner/Environmental Scientist<br />
Thomas C. Cambareri<br />
Water Resources Coordinator/Hydrogeologist<br />
Armando J. Carbonell<br />
Executive Director<br />
<strong>Cape</strong> <strong>Cod</strong> <strong>Commission</strong><br />
3225 Main Street<br />
P.O. Box 226<br />
Barnstable, MA 02630<br />
(508)362-3828<br />
Water Resources Office <strong>Cape</strong> <strong>Cod</strong> <strong>Commission</strong>
<strong>Technical</strong> <strong>Bulletin</strong> <strong>91</strong>-<strong>001</strong> (FINAL)<br />
NITROGEN LOADING<br />
April, 1992<br />
Water Resources Office <strong>Cape</strong> <strong>Cod</strong> <strong>Commission</strong>
<strong>Technical</strong> <strong>Bulletin</strong> <strong>91</strong>-<strong>001</strong> (FINAL)<br />
NITROGEN LOADING<br />
April, 1992<br />
A. INTRODUCTION<br />
The protection of groundwater resources on <strong>Cape</strong> <strong>Cod</strong> is crucial. The almost<br />
complete dependence of the population on groundwater as a drinking water<br />
supply was officially recognized by the US Environmental Protection Agency<br />
(USEPA) in 1982, when the <strong>Cape</strong> <strong>Cod</strong> aquifer was designated as a Sole Source<br />
Aquifer (47 FR 30282). Because the groundwater lenses of <strong>Cape</strong> <strong>Cod</strong> also receive<br />
wastewater and stormwater discharges, introduction of contaminants<br />
needs to be monitored to ensure that the water remains safe for drinking<br />
water purposes. One of the primary contaminants of concern on <strong>Cape</strong> <strong>Cod</strong><br />
is nitrate-nitrogen (NO 3<br />
-N).<br />
<strong>Nitrogen</strong> loading is important to monitor for several reasons. High drinking<br />
water nitrate-nitrogen levels have been shown to cause methemoglobinemia<br />
(a potentially lethal decreased ability of the blood to transport oxygen) in<br />
infants and have been correlated with progeny malformations (NRC, 1977;<br />
Dorsch, et al., 1984). High NO 3<br />
-N concentrations in groundwater have also<br />
been correlated with higher concentrations of regulated drinking water contaminants,<br />
such as volatile organic compounds (VOCs) (Eckhardt, et al., 1986).<br />
However, the link of high nitrate levels to methemoglobinemia is the most<br />
well established and extensive research has led to the calculation of a 10 ppm<br />
NO 3<br />
-N concentration as a “no-observed-adverse-effect level” (NOAEL) for<br />
most infants (NRC, 1977; Fan, et al., 1987).<br />
In response to the concerns pointed out by research, the USEPA established<br />
an interim maximum contaminant limit (MCL) in drinking water of 10 ppm<br />
NO 3<br />
-N in 1975 (USEPA, 1975). This standard has been reproposed by the<br />
USEPA a number of times and is scheduled to be adopted permanently in<br />
July, 1992 (56 FR 3526). In addition, USEPA , based on recent research linking<br />
high nitrate concentrations to carcinogenic effects, has proposed that the<br />
Unreasonable Risk to Health (URTH) level for NO 3<br />
-N be set at 10 ppm, along<br />
with additional monitoring requirements for public supply wells which exceed<br />
5 ppm NO 3<br />
-N (USEPA, 1990). Adoption of this proposed standard<br />
means that a well which exceeds the 10 ppm NO 3<br />
-N MCL concentration<br />
could not obtain a variance or an exemption and would be shut down.<br />
Water Resources Office 1<br />
<strong>Cape</strong> <strong>Cod</strong> <strong>Commission</strong>
<strong>Technical</strong> <strong>Bulletin</strong> <strong>91</strong>-<strong>001</strong> (FINAL)<br />
NITROGEN LOADING<br />
April, 1992<br />
The health concerns about nitrate are compounded by its environmental<br />
persistence; once it reaches groundwater, it is not substantially removed by<br />
chemical reactions. In addition, most nitrogen introduced to aerobic subsurface<br />
environments, such as those encountered in the unconfined aquifers of<br />
<strong>Cape</strong> <strong>Cod</strong>, is converted to nitrate. Thus nitrogen added to the groundwater<br />
system is not attenuated and concentrations can only be lowered by dilution<br />
or by limiting the nitrogen introduced to the system.<br />
A number of studies have attempted to quantify and understand nitrogen<br />
loading to groundwater systems. The Nassau-Suffolk Regional Planning<br />
Board (NSRPB) of Long Island, New York conducted extensive literature reviews<br />
and presented nitrogen loading levels from a number of sources, including<br />
wastewater, fertilizer applications, and domestic animals, as part of<br />
the Long Island Comprehensive Waste Treatment Management Plan (also known<br />
as the Long Island 208 study) (NSRPB, 1978). The forerunner of the <strong>Cape</strong><br />
<strong>Cod</strong> <strong>Commission</strong> (CCC), the <strong>Cape</strong> <strong>Cod</strong> Planning and Economic Development<br />
<strong>Commission</strong> (CCPEDC), developed a wastewater nitrogen loading methodology<br />
as part of the Draft Environmental Impact Statement and Proposed 208 Water<br />
Quality Management Plan for <strong>Cape</strong> <strong>Cod</strong> (also known as the <strong>Cape</strong> <strong>Cod</strong> 208 study)<br />
(CCPEDC and USEPA, 1978). In 1979, CCPEDC modified the methodology to<br />
also include nitrogen inputs from fertilizers (CCPEDC, 1979). A 1986 study of<br />
nitrate concentrations on <strong>Cape</strong> <strong>Cod</strong> found a significant positive correlation<br />
between nitrate concentrations in groundwater and housing density (Persky,<br />
1986). In 1988, IEP Inc. presented a nitrogen loading model, as part of their<br />
contract to assess the water resources of the Town of Yarmouth, to attempt<br />
to understand the observed concentrations at two public supply wells (IEP,<br />
1988). Also in 1988, Frimpter, et al. presented a detailed nitrogen loading<br />
methodology for determining nitrogen loading within zones of contribution<br />
(ZOCs) to public drinking water supply wells. In 19<strong>91</strong>, the Buzzards Bay<br />
(BBP) recommended nitrogen management actions, which involved a synthesis<br />
of the methods in many of the previous studies, for “nitrogen sensitive<br />
embayments” in their Comprehensive Conservation and Management Plan<br />
(CCMP) (USEPA and MA EOEA, 19<strong>91</strong>). Planning boards and boards of health<br />
in many of the towns on <strong>Cape</strong> <strong>Cod</strong> have adopted density restrictions, water<br />
quality report requirements for new developments, and nitrogen loading<br />
methodologies based on the information included in these studies.<br />
<strong>Nitrogen</strong> loading methodologies used on <strong>Cape</strong> <strong>Cod</strong> have based their conclusions<br />
and recommendations on various assumptions about nitrogen loading<br />
parameters (e.g., wastewater flows, nitrogen concentrations in wastewater,<br />
lawn sizes, etc.). As more research has been done and more papers have been<br />
published, a certain level of confusion has developed over which values and<br />
Water Resources Office 2<br />
<strong>Cape</strong> <strong>Cod</strong> <strong>Commission</strong>
<strong>Technical</strong> <strong>Bulletin</strong> <strong>91</strong>-<strong>001</strong> (FINAL)<br />
NITROGEN LOADING<br />
April, 1992<br />
methods are the most proper to use when performing nitrogen loading calculations.<br />
This bulletin presents the methodology which is used by the Water<br />
Resources Office (WRO) of the <strong>Cape</strong> <strong>Cod</strong> <strong>Commission</strong> to review Developments<br />
of Regional Impact (DRIs) and to evaluate cumulative nitrogen loading<br />
to Water Resource Areas as described in the Regional Policy Plan (RPP) (Section<br />
2.1).<br />
B. VALUES<br />
All nitrogen loading methodologies involve a certain number of assumptions.<br />
This methodology will assume that the recharge (e.g., wastewater, stormwater<br />
runoff, precipitation) and nitrogen sources (e.g., septic wastes, fertilizers,<br />
nutrients in runoff) within the boundaries of the development site are<br />
well mixed prior to their mixing with the groundwater. While this assumption<br />
is not an accurate representation of actual contaminant plume behavior,<br />
it is an assumption which simplifies the nitrogen loading calculations and is<br />
appropriate in most cases where wastewater quantities are fairly low. An<br />
assumption is also made that no nitrogen is lost from the system once it is<br />
introduced to the groundwater. This assumption also is an approximation of<br />
actual nitrogen contamination behavior, but is appropriate in lieu of definitive<br />
research about the level of denitrification reactions at depth within the aquifers<br />
of <strong>Cape</strong> <strong>Cod</strong>.<br />
B.l. 5 ppm NO3-N<br />
A statistical analysis, conducted by Porter and presented in the Long Island<br />
208 study, of 865 NO 3<br />
-N observations from 54 wells in Nassau County on<br />
Long Island attempts to establish how often the 10 ppm NO 3<br />
-N USEPA MCL<br />
would be violated given a mean NO 3<br />
-N concentration (NSRPB, 1978). Porter<br />
found that a well with a mean NO 3<br />
-N concentration of 6.0 ppm would violate<br />
the 10 ppm MCL 10% of the time. Additional analysis of the same observations<br />
has indicated that a mean concentration of 3 ppm NO 3<br />
-N will violate<br />
the MCL one time out of a hundred (1% of the time) (LIRPB, 1986). Based,<br />
in part, on Porter’s work, the Long Island 208 study recommended that in<br />
areas that exceeded a 6 ppm NO 3<br />
-N concentration, sewering be undertaken to<br />
protect future drinking water supplies (NSRPB, 1978).<br />
Water Resources Office 3<br />
<strong>Cape</strong> <strong>Cod</strong> <strong>Commission</strong>
<strong>Technical</strong> <strong>Bulletin</strong> <strong>91</strong>-<strong>001</strong> (FINAL)<br />
NITROGEN LOADING<br />
April, 1992<br />
After reviewing the Long Island 208 study, CCPEDC adopted a 5 ppm NO 3<br />
-N<br />
standard as a planning guideline (CCPEDC and USEPA, 1978). This concentration<br />
promises to keep violations of the USEPA MCL to less than one in 10<br />
samples and “allows for a margin of safety during times of high loading with<br />
low recharge” (CCPEDC, 1979).<br />
Although the 5 ppm NO 3<br />
-N guideline gives some level of protection to drinking<br />
water supplies, the level of protection afforded by this concentration may<br />
be inadequate to protect the ecosystems of nitrogen limited coastal embayments<br />
on <strong>Cape</strong> <strong>Cod</strong>. <strong>Nitrogen</strong> loading limits for recharge areas to embayments<br />
(Marine Water Recharge Areas in the RPP) are referred to as critical<br />
nitrogen loading rates, i.e., maximum annual loadings without producing<br />
negative ecosystem changes, such as eutrophication. Each embayment has<br />
a unique critical nitrogen loading rate, as determined by an analysis of its<br />
morphology and tidal exchange or flushing rate. Although available analyses<br />
of critical loading based on flushing rates within coastal recharge areas<br />
are not extensive, most have identified critical nitrogen loading rates, which<br />
when converted to loading concentrations are less than the 5 ppm NO 3<br />
-N<br />
guideline. K.V. Associates (1983) identified critical loading concentrations<br />
of 1.5 and 8.5 ppm NO 3<br />
-N for Bournes Pond and Hamblin Pond, respectively,<br />
in Falmouth. Horsley Witten Hegemann (HWH) (19<strong>91</strong>) identified 3.68 ppm<br />
NO 3<br />
-N as the critical loading concentration for Buttermilk Bay, and identified<br />
3.8 and 2.0 ppm NO 3<br />
-N as the critical loading concentrations for Oyster Pond<br />
and Mill Pond, respectively, in Chatham (HWH, 1990). The unique characteristics<br />
of nitrogen sensitive embayments will require additional studies, including<br />
flushing rate determinations, to ascertain critical loading rates.<br />
The CCC WRO believes that the 5 ppm NO 3<br />
-N guideline is appropriate for<br />
use on <strong>Cape</strong> <strong>Cod</strong> and will protect the largely undefined potential future water<br />
supply areas, private wells, and the small volume community and noncommunity<br />
supply wells, and, in the absence of recharge area specific studies<br />
establishing critical nitrogen loading limits, will provide some protection for<br />
coastal resources. Lower NO 3<br />
-N loading rates based on flushing characteristics,<br />
will be necessary within the recharge areas to certain identified nitrogen<br />
sensitive embayments.<br />
B.2. Sewage Flows and Concentrations<br />
In the Commonwealth of Massachusetts, wastewater systems are required to<br />
be designed based on wastewater flows in 310 CMR 15 Minimum Requirements<br />
for the Subsurface Disposal of Sanitary Sewage, which is commonly referred to as<br />
“Title 5.” The flow design criteria for wastewater disposal systems are pur-<br />
Water Resources Office 4<br />
<strong>Cape</strong> <strong>Cod</strong> <strong>Commission</strong>
<strong>Technical</strong> <strong>Bulletin</strong> <strong>91</strong>-<strong>001</strong> (FINAL)<br />
NITROGEN LOADING<br />
April, 1992<br />
posely inflated to ensure that the systems avoid hydraulic failure and “assimilate<br />
maximum daily flows” (310 CMR 15.02 (13)). For example, all bedrooms<br />
are assumed to have two people per bedroom, with a resultant flow of<br />
55 gallons per capita per day (gpcd) (310 CMR 15.02). In contrast, average<br />
residential wastewater flows found in a number of studies averaged approximately<br />
44 gpcd and occupancy levels found in a number of <strong>Cape</strong> <strong>Cod</strong> towns<br />
do not approach the two people per bedroom level (Bennett, et al., 1974; Witt,<br />
et al., 1974; NSRPB, 1978; Cambareri, et al., 1989; Belfit, et al., 1990). In spite<br />
of the obvious overestimation of usual wastewater flows. Title 5 wastewater<br />
flows have been used for analysis of nitrogen loading in most cases, including<br />
the <strong>Cape</strong> <strong>Cod</strong> 208 study and the analysis presented in Frimpter, et al. (1988).<br />
<strong>Nitrogen</strong> concentrations reaching groundwater have also been assumed at<br />
a variety of levels. The literature search conducted for the Long Island 208<br />
study resulted in a conservative estimate of average per capita nitrogen load<br />
in wastewater of 10 pounds per year, with a concentration of 41 ppm nitrogen<br />
reaching the groundwater (NSRPB, 1978). The <strong>Cape</strong> <strong>Cod</strong> 208 study assumed<br />
a concentration of 35 ppm NO 3<br />
-N reaching groundwater (CCPEDC and<br />
USEPA, 1978). A modeling effort conducted by IEP, Inc. in Yarmouth found<br />
that a calibrated concentration of 33.9 ppm NO 3<br />
-N reaching groundwater<br />
produced the closest fit for historic nitrogen concentrations within a specified<br />
study area (IEP, 1988). The BBP in their CCMP and guidance documents is<br />
using a loading rate of 5.86 lbs/person/year (USEPA and MA EOEA, 19<strong>91</strong>;<br />
Costa et al., in preparation).<br />
Actual studies of leaching field concentrations have found different results<br />
depending on the soil characteristics, percolation rate, loading rate, distance<br />
to impervious strata, and the distance to the water table (Canter and Knox,<br />
1985). Andreoli, et al. (1979), in a study on Long Island, found that an average<br />
of 36% of total nitrogen applied to soil is removed after two feet of travel<br />
through sandy soil. Andreoli, et al. (1979) also found that nitrification (the<br />
conversion of ammonium to nitrate) occurs within 2-4 feet of vertical travel<br />
through the soil. A study by the Suffolk County Department of Health Services<br />
(SCDHS) found that nitrogen concentrations varied depending on the<br />
time of year and depth below the leaching field (SCDHS, 1983). Concentrations<br />
of total nitrogen varied between 15 and 49 ppm, with an average concentration<br />
of 34.7 ppm (SCDHS, 1983). A recent study by Robertson, et al.<br />
(19<strong>91</strong>) of two septic systems in sandy soils found NO 3<br />
-N concentrations within<br />
the contaminant plumes averaging 33 and 39 ppm.<br />
Wastewater flows and expected nitrogen concentrations from nonresidential<br />
land uses have not been the subject of comparable research. Wastewater<br />
Water Resources Office 5<br />
<strong>Cape</strong> <strong>Cod</strong> <strong>Commission</strong>
<strong>Technical</strong> <strong>Bulletin</strong> <strong>91</strong>-<strong>001</strong> (FINAL)<br />
NITROGEN LOADING<br />
April, 1992<br />
flows and nitrogen concentrations from other uses are more varied in character<br />
and quantity, even between similar uses. Frimpter, et al. (1988) has a more<br />
extensive list of flows from nonresidential uses than Title 5, but does not reference<br />
the additional flows. The same lists also have similar concentration<br />
ranges for both residential and nonresidential land uses (Frimpter, et al.,<br />
1988). Wastewater from facilities which have mostly black water (i.e., toilet)<br />
flows tend to have higher NO 3<br />
-N concentrations because lower NO 3<br />
-N grey<br />
water flows, i.e., sinks and showers, are not mixed in for dilution. The Yarmouth<br />
Water Resources Protection Study model found that a calibrated nitrogen<br />
concentration of 50.8 ppm for wastewater flows from restaurants provided<br />
the best fit for historical nitrogen concentrations (IEP, 1988). Large corporations,<br />
such as McDonald’s Corporation, with many similar facilities may have<br />
fairly accurate estimates of the expected flows from their facilities (P. Landry,<br />
McDonald’s Corporation, 19<strong>91</strong>, oral communication).<br />
Although the staff of the WRO acknowledges that the Title 5 flows are, by<br />
design, overestimates of usual wastewater flows, these flows will be utilized<br />
by the WRO staff to calculate nitrogen loading. The inclusion of actual town<br />
occupancy levels in nitrogen loading calculations for residential developments<br />
(see Section B.3.) will correct for some of the overestimation inherent<br />
in the use of these wastewater flows. Additionally, 35 ppm NO 3<br />
-N has historically<br />
been used by the staff of the WRO as the concentration of nitrogen<br />
reaching groundwater from septic systems. While this concentration may<br />
overestimate concentrations in certain cases, it is also probably an underestimation<br />
in others, especially in the case of most commercial wastewater flows.<br />
The staff believes that the 35 ppm NO 3<br />
-N concentration is an accurate number<br />
for all nitrogen loading calculations.<br />
B.3. Occupancy Rates<br />
As was stated in the Section B.2., Title 5 assumes that each bedroom is occupied<br />
by two people. The <strong>Cape</strong> <strong>Cod</strong> 208 study of nitrogen loading assumed<br />
that each housing unit was occupied by three people (CCPEDC, 1979).<br />
Frimpter, et al. (1988) made no implicit assumptions about occupancy, but<br />
demonstration calculations and wastewater flows included in the paper are<br />
based on Title 5 flows.<br />
The WRO staff again acknowledges the overestimation inherent in the use of<br />
Title 5 flows for nitrogen loading analysis and, as such, requests that future<br />
nitrogen loading calculations on residential developments submitted for<br />
review include both Title 5 occupancy levels and occupancy levels based on<br />
Water Resources Office 6<br />
<strong>Cape</strong> <strong>Cod</strong> <strong>Commission</strong>
<strong>Technical</strong> <strong>Bulletin</strong> <strong>91</strong>-<strong>001</strong> (FINAL)<br />
NITROGEN LOADING<br />
April, 1992<br />
the levels that exist in the town of the proposed development. Regulatory<br />
reviews of residential developments will use the mean of the two resulting<br />
nitrogen loading values. Nonresidential developments will continue to be<br />
reviewed based on Title 5 flows, unless substantial documentation of wastewater<br />
flows from similar land use can be presented to the staff.<br />
B.4. Lawns<br />
The Long Island 208 study conducted a survey of lawn fertilizer usage and<br />
lawn sizes in an attempt to understand potential nitrogen inputs from lawns.<br />
This survey, which contacted 460 households in 7 communities, found that<br />
rates of fertilizer application ranged between 1.70 and 3.75 lbs of nitrogen per<br />
1,000 ft 2 per year (NSRPB, 1978). The survey also found that fertilizer application<br />
rates were positively correlated with household income levels. Other<br />
research cited in the Long Island 208 study had found lawn nitrogen application<br />
rates between 2.2 and 3 lbs N/1,000 ft 2 /yr.<br />
The nitrogen loading calculations adopted by CCPEDC in 1979 included<br />
fertilizer inputs. Based on tables in the Long Island 208 study and consultation<br />
with the Barnstable County Extension Service, CCPEDC selected 3 lbs<br />
N/1,000 ft 2 /yr as the appropriate fertilizer application rate for nitrogen loading<br />
calculations on <strong>Cape</strong> <strong>Cod</strong> (CCPEDC, 1979).<br />
Application rate surveys vary widely, depending on the population being<br />
surveyed. A study of four golf courses on <strong>Cape</strong> <strong>Cod</strong> found overall yearly<br />
application rates ranging between 1.7 and 3.1 lbs N/1,000 ft 2 /yr, with rates<br />
of up to 9.6 lbs N/1,000 ft 2 /yr for greens (Eichner and Cambareri, 1990).<br />
A survey of golf course turf managers cited in Petrovic (1989) found typical<br />
application rates ranged between 1 and 1.5 lbs N/1,000 ft 2 /yr. A lawn care<br />
consultant, who works extensively on <strong>Cape</strong> <strong>Cod</strong>, contacted for the Yarmouth<br />
Water Resources Protection Study typically applied 4.65 lbs N/1,000 ft 2 of lawn<br />
(IEP, 1988). However, the model developed for the same study calibrated to<br />
historical nitrate concentrations found a best fit with an annual application<br />
rate of 2.8 lbs N/1,000 ft 2 and a leaching rate of 60%.<br />
<strong>Nitrogen</strong> leaching rates have been subject to more study than application<br />
rates. The Long Island 208 study presented tables with gross estimates of<br />
nitrogen leaching; based on gross estimates of nitrogen application and nitrogen<br />
reaching groundwater, leaching rates of 55.5% and 60% were determined<br />
(NSRPB, 1978). CCPEDC apparently selected a 60% leaching rate based on<br />
the estimates in the Long Island 208 study.<br />
Water Resources Office 7<br />
<strong>Cape</strong> <strong>Cod</strong> <strong>Commission</strong>
<strong>Technical</strong> <strong>Bulletin</strong> <strong>91</strong>-<strong>001</strong> (FINAL)<br />
NITROGEN LOADING<br />
April, 1992<br />
Research on golf courses over the last decade has provided some insights into<br />
actual nitrogen leaching rates. Brown, et al. (1982) fertilized bermudagrass at<br />
a rate of 3 lbs N/1,000 ft 2 of turf and found a leaching rate of 22%. Petrovic<br />
(1990) summarized 33 leaching studies conducted in sandy soil and found<br />
leaching rates which ranged between 0 and 56.1%. Leaching rates vary with<br />
soil type, application rate, precipitation, temperature, turf type, and applied<br />
nitrogen forms.<br />
Average lawn sizes are also important to determine when application rates<br />
are presented in terms of pounds per unit area. The Long Island 208 study of<br />
application rates also included a section on lawn sizes, along with surveyors<br />
checks of a certain percentage of respondents. This survey found that lawn<br />
sizes were fairly constant, averaging 36-40% of total lot size in all categories<br />
except extremely low and extremely high densities (NSRPB, 1978). CCPEDC<br />
recognized that comparable information was not available for <strong>Cape</strong> <strong>Cod</strong> and<br />
selected a standard size lawn of 5,000 ft 2 based on a lot size of between 10,000<br />
and 15,000 ft 2 (CCPEDC, 1979). Lawn sizes averaged 4,350 ft 2 in a survey<br />
conducted for the Yarmouth Water Resources Protection Study (IEP, 1988).<br />
Historically, the WRO staff has used a fertilizer application rate of 3 lbs N/<br />
1,000 ft 2 /yr with a leaching rate of 60% off an average lawn of 5,000 ft 2 . The<br />
application rate and standard lawn size seem to be appropriate in light of the<br />
lack of definitive information. However, the research which has been done on<br />
leaching rates seems to indicate that the 60% leaching rate figure is too conservative.<br />
Petrovic’s work has indicated that controlled applications of fertilizers<br />
on healthy turf can substantially reduce leaching rates, sometimes allowing<br />
no leaching. Although Petrovic’s work indicates that a percentage<br />
lower than 60% can reasonably be chosen, the CCC WRO believes that the<br />
objective of protecting groundwater quality should be the main criteria when<br />
selecting a standard leaching rate. Therefore, the CCC WRO will use a leaching<br />
rate of 25% in all nitrogen loading analyses. This rate recognizes the<br />
results of most of the controlled leaching experiments summarized in<br />
Petrovic’s work, while acknowledging that fertilizer is often applied to unhealthy<br />
turf in an uncontrolled fashion. In summary, future nitrogen loading<br />
calculations submitted to the CCC WRO should use an application rate of 3<br />
lbs N/1,000 ft 2 /yr and a leaching rate of 25% off an average lawn area of 5,000<br />
ft 2 .<br />
Water Resources Office 8<br />
<strong>Cape</strong> <strong>Cod</strong> <strong>Commission</strong>
<strong>Technical</strong> <strong>Bulletin</strong> <strong>91</strong>-<strong>001</strong> (FINAL)<br />
NITROGEN LOADING<br />
April, 1992<br />
B.5. Recharge<br />
Recharge from precipitation is the only way to dilute NO -N loading on an<br />
3<br />
aquifer-wide basis and provides an important source of dilution for NO -N<br />
3<br />
concentrations on smaller scales. Approximately 45% of annual precipitation<br />
on <strong>Cape</strong> <strong>Cod</strong> becomes recharge (LeBlanc, et al., 1986). The remainder is either<br />
transpired by plants or evaporates back to the atmosphere. Precipitation that<br />
falls on impervious surfaces (e.g., roofs, parking lots, roads) may be recharged<br />
to the water table at a much higher percentage.<br />
Two methods of analysis have been used to estimate the average recharge on<br />
<strong>Cape</strong> <strong>Cod</strong>. LeBlanc, et al. (1986) used the Thornthwaite and Mather method,<br />
which is based largely on precipitation measurements, to calculate average<br />
recharge rates of 22 inches per year on western <strong>Cape</strong> <strong>Cod</strong> and 18 in/yr on<br />
eastern <strong>Cape</strong> <strong>Cod</strong>. Recharge at Otis Air Force Base has been estimated as 21<br />
in/yr using the same method (LeBlanc, 1982). G. J. Larson of Michigan State<br />
University used a radioisotope method to estimate recharge in Truro at between<br />
11 and 16 in/yr, while the Thornthwaite and Mather method calculated<br />
a recharge of between 17.3 and 19.4 in/yr (Knott and Olimpio, 1986; Delaney<br />
and Cotton, 1972).<br />
Prior nitrogen loading methodologies have been based on conservative recharge<br />
rates to ensure a margin of safety when determining concentrations.<br />
The original CCPEDC loading methodology assumed a recharge rate of 16<br />
in/yr across all of <strong>Cape</strong> <strong>Cod</strong> (CCPEDC and USEPA, 1978). Subsequent loading<br />
formulas have also used the same recharge rate (CCPEDC, 1979; Frimpter,<br />
et al., 1988). The use of this value may be appropriately conservative for<br />
use in calculations on sites in eastern <strong>Cape</strong> <strong>Cod</strong>, but is certainly too conservative<br />
for western <strong>Cape</strong> <strong>Cod</strong>. In consideration of the above studies and the<br />
wish to adopt appropriately conservative rates, the CCC WRO staff have<br />
decided to utilize the following recharge rates for natural and lawn areas in<br />
the following towns: 21 in/yr (Bourne, Falmouth); 19 in/yr (Mashpee, Sandwich);<br />
18 in/yr (Barnstable, Dennis, Yarmouth); 17 in/yr (Brewster, Harwich);<br />
16 in/yr (Chatham, Orleans, Eastham, Wellfleet, Truro, Provincetown).<br />
The WRO staff considered not using recharge associated with wastewater<br />
flows in areas which receive drinking water supplies from private wells,<br />
because water is not imported from a public supply well. The public health<br />
concern of so called “short circuiting” between wells and septic systems is a<br />
more crucial concern than site specific nitrogen loading in these areas. The<br />
wastewater in private well areas is not recycled back to a supply well, but<br />
flows with the groundwater from its recharge point towards the groundwater<br />
Water Resources Office 9<br />
<strong>Cape</strong> <strong>Cod</strong> <strong>Commission</strong>
<strong>Technical</strong> <strong>Bulletin</strong> <strong>91</strong>-<strong>001</strong> (FINAL)<br />
NITROGEN LOADING<br />
April, 1992<br />
discharge area. Thus, the private drinking water wells downgradient of numerous<br />
wastewater recharge points may intercept the contaminant load from<br />
the upgradient contaminant sources. Therefore, proposed developments<br />
under CCC review in areas which receive drinking water from private wells<br />
will be reviewed based on both the documentation of no negative effects on<br />
the nearby private wells, as indicated by Section 2.1.1.3 of the Regional Policy<br />
Plan, and the nitrogen loading components of the Regional Policy Plan.<br />
Frimpter, et al. (1988) introduced the concept of atmosphere nitrogen loading<br />
to calculations done on <strong>Cape</strong> <strong>Cod</strong>. Frimpter, et al. (1988) assumed a concentration<br />
of 0.05 ppm NO -N for loading from precipitation to groundwater.<br />
3<br />
This concentration was chosen based on analysis by the Barnstable County<br />
Health and Environmental Department of 5,559 groundwater samples from<br />
shallow private wells throughout <strong>Cape</strong> <strong>Cod</strong> between 1980 and 1986. Thirty<br />
percent of these samples had concentrations of less than 0.05 mg NO -N/1,<br />
3<br />
which was the detection limit for the analytical method used by the laboratory<br />
(Frimpter, et al., 1988). Literature reviews have established a range of<br />
0.14-1.15 ppm NO -N for precipitation in the United States (Loehr, 1974). A<br />
3<br />
study of precipitation in Truro found an average NO -N concentration of 0.26<br />
3<br />
ppm (Frimpter, et al., 1988). Frimpter has proposed that nitrogen concentrations<br />
up to those found in Truro are removed by the soil zone prior to reaching<br />
the water table (M.H. Frimpter, 19<strong>91</strong>, oral communication). Nitratenitrogen<br />
concentrations in precipitation on Long Island from 1969 to 1974<br />
ranged between 0.33 and 0.67 ppm (NSRPB, 1978). Regardless of the concentration<br />
chosen for natural recharge, the nitrogen load from natural recharge is<br />
small enough in comparison to loading from wastewater and fertilizers to<br />
ignore it when performing nitrogen loading calculations on individual parcels.<br />
By comparison, nitrogen loading off of impervious surfaces is more significant<br />
than natural loading. Howie and Waller (1986) conducted a study of two<br />
highway runoff sites in Florida and found concentrations of 1.4 and 0.58 ppm<br />
total nitrogen reaching groundwater. IEP, Inc (1988) conducted a literature<br />
review of impervious surface runoff concentrations and found ranges of 0.41<br />
to 1.75 ppm NO -N and 1.13 to 10 ppm total nitrogen. The calibration of the<br />
3<br />
nitrogen loading model detailed in the Yarmouth Water Resources Protection<br />
Study produced values of 1.5 ppm N reaching groundwater in recharge off<br />
pavement and 0.75 ppm N in recharge off roofs (IEP, 1988). The values chosen<br />
in the Yarmouth Water Resources Protection Study are also used by the BBP<br />
in their nitrogen loading calculations (USEPA and MA EOEA, 19<strong>91</strong>; Costa, et<br />
al., in preparation).<br />
Water Resources Office 10<br />
<strong>Cape</strong> <strong>Cod</strong> <strong>Commission</strong>
<strong>Technical</strong> <strong>Bulletin</strong> <strong>91</strong>-<strong>001</strong> (FINAL)<br />
NITROGEN LOADING<br />
April, 1992<br />
Conventionally, previous nitrogen loading calculations performed by the<br />
CCC WRO staff have assumed that 90% of recharge off impervious surfaces<br />
and 40 in/yr reaches the groundwater. This percentage assumes that precipitation<br />
falls on <strong>Cape</strong> <strong>Cod</strong> at an average rate of 44.44 in/yr. Average amounts<br />
of precipitation have not been studied across <strong>Cape</strong> <strong>Cod</strong>. LeBlanc, et al. (1986)<br />
summarized National Oceanic and Atmospheric Administration (NOAA)<br />
weather station precipitation data for <strong>Cape</strong> <strong>Cod</strong> between 1947 and 1976.<br />
Although the data from the 10 stations provided the data for the determination<br />
of the recharge patterns discussed previously, a few of the stations annual<br />
average precipitation figures do not fall into the smooth gradient across<br />
<strong>Cape</strong> <strong>Cod</strong> that the recharge rates seem to follow (LeBlanc, et al., 1986).<br />
The 90% recharge rate off of impervious surfaces has been used in a number<br />
of other studies on <strong>Cape</strong> <strong>Cod</strong> (e.g. IEP (1988). CCPEDC and USEPA (1978),<br />
and CCPEDC (1979). Origins of this number are obscure, although members<br />
of the IEP study team for the Yarmouth Water Resources Protection Study state<br />
that this recharge rate is based on “the intuitive assumption that smaller,<br />
shorter storm events would not generate enough water for runoff to occur”<br />
(M.E. Nelson and S.W. Horsley, HWH, 19<strong>91</strong>, written communication).<br />
Stormwater modeling programs, such as TR-55, use a 98% runoff rate for<br />
parking lots, roofs, streets and driveways directly connected to catch basins,<br />
but these calculations are done on the basis of individual storms, not on<br />
annual precipitation data (SCS, 1986).<br />
In light of the lack of definitive values for many of the stormwater and runoff<br />
attributes, nitrogen loading analyses submitted to the CCC WRO should<br />
utilize the values which have been historically used on <strong>Cape</strong> <strong>Cod</strong>: 40 in/yr<br />
recharge off of impervious surfaces, 1.5 ppm NO -N off of paved surfaces,<br />
3<br />
and 0.75 ppm NO -N off of roofs. Nitrate-nitrogen loading from recharge on<br />
3<br />
pervious natural areas can be ignored when performing loading analyses on<br />
individual parcels.<br />
Water Resources Office 11<br />
<strong>Cape</strong> <strong>Cod</strong> <strong>Commission</strong>
<strong>Technical</strong> <strong>Bulletin</strong> <strong>91</strong>-<strong>001</strong> (FINAL)<br />
NITROGEN LOADING<br />
April, 1992<br />
C. METHOD<br />
C.1. Site Specific Mass Balance Analysis<br />
The information presented above describes values that will be used to assess<br />
nitrogen loading by the WRO staff of the CCC. The staff expects that each<br />
development will perform a Mass Balance Analysis (MBA) of the nitrogen<br />
and water uses within the boundaries of the development, using the values<br />
selected in this bulletin. A MBA will consist of totaling the nitrogen inputs to<br />
groundwater and dividing the nitrogen inputs by the water inputs according<br />
to the parameters described above. Sample calculations following this section<br />
provide examples of the methods to be used for residential and nonresidential<br />
developments.<br />
C.2. Cumulative <strong>Loading</strong> Analysis Methodology<br />
If a proposed development is within one of the recharge zones defined in<br />
Section 2.1.1.2 of the Regional Policy Plan (RPP) and has a Title 5 wastewater<br />
flow of greater than 2,000 gallons per day (gpd), the proponent may also be<br />
required to complete a zone-wide Cumulative <strong>Loading</strong> Analysis (CLA), similar<br />
to those presented by the WRO staff of CCPEDC and CCC, respectively, in<br />
Truro/Provincetown Aquifer Assessment and Groundwater Protection Plan (Cambareri,<br />
et al., 1989) and Harwich/Brewster Wellhead Protection Project, (Belfit, et<br />
al., 1990) and by Horsley Witten and Hegemann, Inc. in Quantification of <strong>Nitrogen</strong><br />
Inputs to Buttermilk Bay (HWH, 19<strong>91</strong>).<br />
If the CLA is being completed for a Wellhead Protection Area (RPP, Section<br />
2.1.1.2.A.) or a Potential Public Water Supply Area (RPP, Section 2.1.1.2.F.), the<br />
CLA should include, at a minimum, current expected NO -N concentrations<br />
3<br />
within the delineated area based on both actual occupancy values and full<br />
Title 5 wastewater flows and future expected NO -N concentrations within<br />
3<br />
the area at full buildout also using the two wastewater flow estimates. The<br />
completed CLA buildout assessment will provide a worst case assessment of<br />
projected nitrogen concentrations based on current zoning laws. If the buildout<br />
assessment indicates that the critical loading concentration (i.e., 5 ppm<br />
NO -N) will be exceeded under current zoning, the CCC will work with an<br />
3<br />
applicant and/or appropriate authorities to explore nitrogen limitation options.<br />
Water Resources Office 12<br />
<strong>Cape</strong> <strong>Cod</strong> <strong>Commission</strong>
<strong>Technical</strong> <strong>Bulletin</strong> <strong>91</strong>-<strong>001</strong> (FINAL)<br />
NITROGEN LOADING<br />
April, 1992<br />
If the CLA is being completed for a Marine Water Recharge Area (MWRA)<br />
(RPP, Section 2.1.1.2.C.), a mass loading approach, similar to the methodology<br />
utilized by the Buzzards Bay Project, will be applied to determine the critical<br />
nitrogen loading rate (Costa, et al., in preparation). The critical loading limit<br />
is an expression of the mass of nitrogen an embayment ecosystem can assimilate<br />
without negative changes. This limit is dependent, in some cases, on the<br />
period of time it takes the water in the embayment to be completely exchanged<br />
(i.e., residence time). Thus, CLA’s completed for MWRA’s will require an<br />
assessment of the flushing characteristics of the embayment to determine the<br />
critical nitrogen loading rate. The existing and future nitrogen loading to a<br />
given embayment will be compared to the BBP recommended nitrogen loading<br />
rate limits for coastal embayments (USEPA and MA EOEA, 19<strong>91</strong>; see Table<br />
1), unless more precise information about the embayment is available.<br />
Masses for each of the nitrogen loading components, i.e., lawns, wastewater,<br />
impervious surfaces, will be determined as previously described, but the<br />
cumulative mass will not be divided by the recharge and other water flows.<br />
Since the mass loading within the recharge area, rather than the groundwater<br />
or surface water concentration, is the determining factor in protecting coastal<br />
embayments, the total mass of nitrogen from current land use and future<br />
buildout, will be used to assess proposed and future development within the<br />
recharge area. If the buildout assessment indicates that the critical loading<br />
rate (e.g., 200 mg/m 3 /Vr) will be exceeded under current zoning, the CCC<br />
will work with an applicant and/or appropriate authorities to explore nitrogen<br />
limitation options.<br />
Many of the types of recharge areas have already been delineated, although<br />
few have had CLA’s completed. Development proponents should refer to the<br />
studies previously referenced in this bulletin and contact the CCC WRO staff<br />
to obtain recharge area delineations and guidance prior to preparing a Cumulative<br />
<strong>Loading</strong> Analysis.<br />
C.3. Additional Guidance<br />
If the site is located within a recharge area for which a CLA has been completed,<br />
the site specific MBA nitrogen loading concentration or mass loading<br />
for the proposed development will be compared to the critical loading concentration<br />
or critical loading rate per unit area of the recharge area. If the<br />
MBA loading concentration or mass loading for a proposed development<br />
exceeds the critical loading concentration or critical loading rate per unit area<br />
Water Resources Office 13<br />
<strong>Cape</strong> <strong>Cod</strong> <strong>Commission</strong>
<strong>Technical</strong> <strong>Bulletin</strong> <strong>91</strong>-<strong>001</strong> (FINAL)<br />
NITROGEN LOADING<br />
April, 1992<br />
for a recharge area, the proposed MBA loading concentration or mass loading<br />
from the project will need to be lowered (e.g., decrease the wastewater flows).<br />
If a sewer connection is available for the proposed development, MBA nitrogen<br />
loading calculations will not be required if the proposed development<br />
will connect to the sewer and if the municipal wastewater treatment facility<br />
has adequate capacity and is operating within the parameters of its discharge<br />
permit. Proposed wastewater treatment facilities will be reviewed cooperatively<br />
with the MA Department of Environmental Protection. Projects involving<br />
nitrogen loading characteristics or situations outside the scope of those<br />
described within this bulletin will be handled on a case by case basis. It<br />
should be noted that the CCC discourages the use of excessive impervious<br />
surfaces to lower nitrogen loading concentrations and Developments of<br />
Regional Impact before the CCC must conform to the minimum performance<br />
standards concerning open space in the RPP (Sections 6.1.1.3 and 6.1.1.4).<br />
Water Resources Office 14<br />
<strong>Cape</strong> <strong>Cod</strong> <strong>Commission</strong>
<strong>Technical</strong> <strong>Bulletin</strong> <strong>91</strong>-<strong>001</strong> (FINAL)<br />
NITROGEN LOADING<br />
April, 1992<br />
Table 1<br />
SUMMARY OF NITROGEN LOADING VALUES<br />
TARGET CONCENTRATION: 5 ppm (milligram/liter) NO 3<br />
-N<br />
WASTEWATER<br />
Residences<br />
Concentration: 35 ppm NO 3<br />
-N<br />
Flow: Title 5 (310 CMR 15.02)<br />
Nonresidences<br />
Concentration: 35 ppm NO 3<br />
-N<br />
Flow:<br />
Title 5; Frimpter, et al. (1988): Documented<br />
flows satisfactory to CCC WRO staff<br />
OCCUPANCY:<br />
Range (Actual town rate to 2 people per bedroom)<br />
LAWNS<br />
Area: 5,000 ft 2<br />
Fertilizer:<br />
3 lbs/1,000 ft 2 of lawn<br />
Leaching: 25%<br />
RECHARGE<br />
Off of impervious surfaces:<br />
40 inches per year<br />
Concentrations<br />
Road runoff: 1.5 ppm NO 3<br />
-N<br />
Roof runoff: 0.75 ppm NO 3<br />
-N<br />
Natural areas<br />
Barnstable: 18 inches per year Mashpee: 19 in/yr<br />
Bourne: 21 in/yr Orleans: 16 in/yr<br />
Brewster: 17 in/yr Provincetown: 16 in/yr<br />
Chatham: 16 in/yr Sandwich: 19 in/yr<br />
Dennis: 18 in/yr Truro: 16 in/yr<br />
Eastham: 16 in/yr Wellfleet: 16 in/yr<br />
Falmouth: 21 in/yr Yarmouth: 18 in/yr<br />
Harwich:<br />
17 in/yr<br />
Recommended <strong>Nitrogen</strong> <strong>Loading</strong> Limits for Coastal Embayments<br />
OUTSTANDING<br />
EMBAYMENT WATERS CLASSIFIED SB WATERS CLASSIFIED SA RESOURCE AREAS<br />
Shallow<br />
• flushing: 4.5 days or less 350 mg/m 3 /Vr 200 mg/m 3 /Vr 100 mg/m 3 /Vr<br />
• flushing: greater than 4.5 days 30 g/m 2 /yr 15 g/m 2 /yr 5 g/m 2 /yr<br />
Deep<br />
• select rate resulting in 500 mg/m 3 /Vr 260 mg/m 3 /Vr 130 mg/m 3 /Vr<br />
lesser annual loading or 45 g/m 2 /yr or 20 g/m 2 /yr or 10 g/m 2 /yr<br />
Note: Vr = Vollenweider flushing term<br />
Vr = r<br />
1 + sqrt (r)<br />
r = flushing time (yrs) Source: USEPA and MA EOEA, 19<strong>91</strong><br />
Water Resources Office 15<br />
<strong>Cape</strong> <strong>Cod</strong> <strong>Commission</strong>
<strong>Technical</strong> <strong>Bulletin</strong> <strong>91</strong>-<strong>001</strong> (FINAL)<br />
NITROGEN LOADING<br />
April, 1992<br />
EXAMPLE NONRESIDENTIAL LOADING CALCULATIONS<br />
Office Building:<br />
Lot Size: 5 acres (217,800 ft 2 )<br />
Impervious Surfaces: Roof Area: 15,000 ft 2 ; Paving Area: 30,000 ft 2<br />
Natural Area: 172,800 ft 2 ; Lawn Area: 10,000 ft 2<br />
Title V Flow: 75 gallons/day per 1,000 ft 2<br />
WASTEWATER<br />
15,000 ft 2 75 gpd 3.785 L = 4,258.1 L/d 35 mg = 149,034.4 mg/d<br />
1,000 ft 2 gal<br />
L<br />
IMPERVIOUS SURFACES<br />
15,000 ft 2 40 in<br />
yr<br />
ft<br />
12 in<br />
28.32 L<br />
ft 3<br />
1 yr<br />
365 d<br />
= 3,879.5 L/d 0.75 mg<br />
L<br />
= 2,909.6 mg/d<br />
30,000 ft 2 40 in ft 28.32 L 1 yr = 7,758.9 L/d 1.5 mg = 11,638.4 mg/d<br />
yr 12 in ft 3 365 d<br />
L<br />
LAWN<br />
10,000 ft 2 3 lbs 1 yr 454,000 mg<br />
1,000 ft 2 *yr 365 d<br />
lb<br />
0.25<br />
= 9,328.8 mg/d<br />
NATURAL<br />
5 acres 43,560 ft2 = 217,800 ft 2 ; 217,800 ft 2 - 45,000 ft 2 = 172,800 ft 2<br />
acre<br />
172,800 ft 2 1.5 ft 28.32 L 1 yr = 20,111.1 L/d<br />
yr<br />
ft 3 365 d<br />
SUMMARY<br />
149,304.4 + 2,909.6 + 11,638.4 + 9,328.8 mg 172,<strong>91</strong>1.2 mg<br />
= =<br />
4,258.1 + 3,879.5 + 7,758.9 + 20,111.1 liters 36,007.6 liters<br />
4.80 ppm<br />
Water Resources Office 16<br />
<strong>Cape</strong> <strong>Cod</strong> <strong>Commission</strong>
<strong>Technical</strong> <strong>Bulletin</strong> <strong>91</strong>-<strong>001</strong> (FINAL)<br />
NITROGEN LOADING<br />
April, 1992<br />
EXAMPLE RESIDENTIAL LOADING CALCULATIONS<br />
Home (3 bedrooms)<br />
Lot Size: 1 acre (43,560 ft 2 )<br />
Impervious Surfaces: Roof Area: 2,000 ft 2 ; Paving Area: 500 ft 2<br />
Natural Area: 41,060 ft 2 ; Lawn Area: 5,000 ft 2<br />
Title V Flow: 110 gallons/day per bedroom<br />
WASTEWATER<br />
Title V (2 people per bedroom)<br />
3 bedrooms 110 gpd 3.785 L = 1,249.0 L/d 35 mg = 43,716.8 mg/d<br />
bedroom gal<br />
L<br />
Actual (assume 2.5 people/unit average occupancy within the town)<br />
3 bedrooms 110 gpd<br />
bedroom<br />
3,785 L<br />
gal<br />
2.5<br />
6<br />
= 520.4 L/d 35 mg<br />
L<br />
= 18,214.6 mg/d<br />
IMPERVIOUS SURFACES<br />
2,000 ft 2 40 in ft 28.32 L 1 yr = 517.3 L/d 0.75 mg = 387.9 mg/d<br />
yr 12 in ft 3 365 d<br />
L<br />
500 ft 2 40 in<br />
yr<br />
ft<br />
12 in<br />
28.32 L<br />
ft 3<br />
1 yr<br />
365 d<br />
= 129.3 L/d 1.5 mg<br />
L<br />
= 194.0 mg/d<br />
LAWN<br />
5,000 ft 2 3 lbs 1 yr 454,000 mg<br />
1,000 ft 2 *yr 365 d<br />
lb<br />
0.25<br />
= 4,664.4 mg/d<br />
NATURAL<br />
43,560 ft 2 - 2,500 ft 2 = 41,060 ft 2<br />
41,060 ft 2 1.5 ft 28.32 L 1 yr = 4,778.7 L/d<br />
yr<br />
ft 3 365 d<br />
SUMMARY<br />
Title V Flow<br />
Actual<br />
43,716.8 + 387.9 + 194.0 + 4,664.4 mg 48,963.1 mg<br />
= = 7.34 ppm<br />
1,249.0 + 517.3 + 129.3 + 4,778.7 liters 6,674.3 liters<br />
18,214.6 + 387.9 + 194.0 + 4,664.4 mg 23,460.9 mg<br />
= = 3.95 ppm<br />
520.4 + 517.3 + 129.3 + 4,778.7 liters 5,945.7 liters<br />
Final Calculation (7.34 + 3.95)/2 =<br />
5.65 ppm<br />
Water Resources Office 17<br />
<strong>Cape</strong> <strong>Cod</strong> <strong>Commission</strong>
<strong>Technical</strong> <strong>Bulletin</strong> <strong>91</strong>-<strong>001</strong> (FINAL)<br />
NITROGEN LOADING<br />
April, 1992<br />
REFERENCES<br />
Andreoli, A., N. Bartilucci, and R. Reynolds. 1979. “<strong>Nitrogen</strong> Removal in<br />
Subsurface Disposal System.” Journal of the Water Pollution Control Federation.<br />
51(4): 841-855.<br />
Belfit, G., T.C. Cambareri, and G. Prahm. 1990. Harwich/Brewster Wellhead<br />
Protection Project. <strong>Cape</strong> <strong>Cod</strong> <strong>Commission</strong>. Water Resources Office,<br />
Barnstable, MA.<br />
Bennett, E.R., K.D. Linstedt, and J.T. Felton. 1974. “Rural Home Wastewater<br />
Characteristics” in Proceedings of the National Home Sewage Disposal Symposium,<br />
December 9 & 10, Chicago, IL. American Society of Agricultural<br />
Engineers, St. Joseph, MI.<br />
Brown, K.W., J.C. Thomas, and R.L. Duble. 1982. “<strong>Nitrogen</strong> Source Effect on<br />
Nitrate and Ammonium Leaching and Runoff Losses from Greens.”<br />
Journal of Agronomy. 74: 947-950.<br />
Cambareri, T.C., M.E. Nelson, S.W. Horsley, M.D. Giggey, and J.R. Pinnette.<br />
1989. “Solute Transport Simulation of Non-point Source <strong>Nitrogen</strong> Impacts<br />
to Groundwater and Calibration of a Predictive Analytical Model”<br />
in Proceedings of Solving Ground Water Problems with Models. Papers from<br />
the NWWA Conference on Solving Water Problems with Models held<br />
February 7-9, 1989, at the Westin, Indianapolis, IN. National Water Well<br />
Association, Dublin, OH.<br />
Cambareri, T.C., G. Belfit, D.S. Janik, and P. Irvin. 1989. Truro/Provincetown<br />
Aquifer Assessment and Groundwater Protection Plan. <strong>Cape</strong> <strong>Cod</strong> Planning<br />
and Economic Development <strong>Commission</strong>, Water Resources Office,<br />
Barnstable, MA.<br />
Canter, L.W. and R.C. Knox. 1985. Septic Tank System Effects on Ground Water<br />
Quality. Lewis Publishers, Inc., Chelsea, MI.<br />
<strong>Cape</strong> <strong>Cod</strong> Planning and Economic Development <strong>Commission</strong> and United<br />
States Environmental Protection Agency. 1978. Draft Environmental<br />
Impact Statement and Proposed 208 Water Quality Management Plan for <strong>Cape</strong><br />
<strong>Cod</strong>. Barnstable, MA.<br />
Water Resources Office 18<br />
<strong>Cape</strong> <strong>Cod</strong> <strong>Commission</strong>
<strong>Technical</strong> <strong>Bulletin</strong> <strong>91</strong>-<strong>001</strong> (FINAL)<br />
NITROGEN LOADING<br />
April, 1992<br />
<strong>Cape</strong> <strong>Cod</strong> Planning and Economic Development <strong>Commission</strong>. 1979. Water<br />
Supply Protection Project. Final Report: Barnstable, Bourne, Brewster, Dennis,<br />
Yarmouth. Barnstable, MA.<br />
Costa, J.E., B. Howes, D. Aubrey, M. Frimpter, A. Giblin, D. Janik, N.<br />
MacGaffey, and I. Valiela. in preparation. Managing anthropogenic<br />
nitrogen inputs to sensitive embayments. I. <strong>Technical</strong> basis for a management<br />
strategy. Buzzards Bay Project <strong>Technical</strong> Report Series.<br />
Delaney, D.F. and J.E. Cotton. 1972. Evaluation of proposed groundwater withdrawal,<br />
<strong>Cape</strong> <strong>Cod</strong> National Seashore, North Truro, Massachusetts. United<br />
States Geological Survey Open-File Report. Washington, DC.<br />
Dorsch, M.M., R.K.R. Scragg, A.J. McMichael, and P.A. Baghurst. 1984. “Congenital<br />
Malformations and Maternal Drinking Water Supply in Reval,<br />
South Australia.” Journal of Epidemiology. 119, 4: 473-485.<br />
Eckhardt, D.A., W.J. Flipse, Jr., and E.T. Oaksford. 1986. Relation Between Land<br />
Use and Ground Water Quality in the Upper Glacial Aquifer in Nassau and<br />
Suffolk Counties, Long Island, New York. United States Geological Survey<br />
Resources Investigations Report 86-4142, Washington, DC.<br />
Eichner, E.M. and T.C. Cambareri. 1990. The <strong>Cape</strong> <strong>Cod</strong> Golf Course Monitoring<br />
Project. <strong>Cape</strong> <strong>Cod</strong> <strong>Commission</strong>. Water Resources Office, Barnstable,<br />
MA.<br />
Fan, A.M., C.C. Willhite, and S.A. Book. 1987. “Evaluation of the Nitrate<br />
Drinking Water Standard with Reference to Infant Methemoglobinemia<br />
and Potential Reproductive Toxicity.” Regulatory Toxicology and Pharmacology.<br />
7: 135-148.<br />
Frimpter, M.H., J.J. Donohue, IV, and M.V. Rapacz. 1988. A Mass Balance<br />
Nitrate Model for Predicting the Effects of Land Use on Groundwater Quality<br />
in Municipal Wellhead Protection Areas. In conjunction with the <strong>Cape</strong> <strong>Cod</strong><br />
Aquifer Management Project (CCAMP). Barnstable, MA.<br />
Horsley Witten Hegemann, Inc. 19<strong>91</strong>. Quantification and Control of <strong>Nitrogen</strong><br />
Inputs to Buttermilk Bay. Buttermilk Bay Project. Barnstable, MA.<br />
Horsley Witten Hegemann, Inc. 1990. (Draft) Comprehensive Harbor Management<br />
Plan (Chatham, Massachusetts). Barnstable, MA.<br />
Water Resources Office 19<br />
<strong>Cape</strong> <strong>Cod</strong> <strong>Commission</strong>
<strong>Technical</strong> <strong>Bulletin</strong> <strong>91</strong>-<strong>001</strong> (FINAL)<br />
NITROGEN LOADING<br />
April, 1992<br />
Howie, B. and B.G. Waller. 1986. Chemical Effects of Highway Runoff on the<br />
Surficial Aquifer, Broward County, Florida. United States Geological Survey<br />
Water Resources Investigation Report 86-4200, Washington, DC.<br />
IEP, Inc. 1988. Water Resources Protection Study: Town of Yarmouth, Massachusetts.<br />
Sandwich, MA.<br />
K-V Associates, Inc. 1983. A Planning Methodology for Evaluation of Cumulative<br />
Impacts of Development on Surface Water Bodies. Falmouth, MA.<br />
Knott, J.F. and J.C. Olimpio. 1986. Estimation of Recharge Rates to the Sand and<br />
Gravel Aquifer Using Environmental Tritium, Nantucket Island, Massachusetts.<br />
United States Geological Survey Water Supply Paper 2297, Washington,<br />
DC.<br />
LeBlanc, D.R. 1982. Sewage Plume in a Sand and Gravel Aquifer, <strong>Cape</strong> <strong>Cod</strong>,<br />
Massachusetts. United States Geological Survey, Open-File Report 82-<br />
274, Washington, DC.<br />
LeBlanc, D.R., J.H. Guswa, M.H. Frimpter, and C.J. Londquist. 1986. Groundwater<br />
Resources of <strong>Cape</strong> <strong>Cod</strong>, Massachusetts: Hydrologic Investigation Atlas.<br />
United States Geological Survey, Washington, DC.<br />
Loehr, R.C. 1974. “Characteristics and Comparative Magnitude of Non-Point<br />
Sources.” Journal of the Water Pollution Control Federation. 46: 1849-1872.<br />
Long Island Regional Planning Board. 1986. Special Ground-Water Protection<br />
Area Project for the Oyster Bay Pilot Area and Brookhaven Pilot Area.<br />
National Research Council. 1977. Drinking Water and Health. National Academy<br />
of Sciences, Washington, DC.<br />
Nassau-Suffolk Regional Planning Board. 1978. The Long Island Comprehensive<br />
Waste Treatment Management Plan. Hauppauge, NY.<br />
Persky, J.H. 1986. The Relation of Ground-Water Quality to Housing Density,<br />
<strong>Cape</strong> <strong>Cod</strong>, Massachusetts. United States Geological Survey, Water Resources<br />
Investigations Report 86-4093, Washington, DC.<br />
Petrovic, A.M. 1989. “Golf Course Management and Nitrates in Groundwater.”<br />
Golf Course Management. September, 1989: 54-64.<br />
Petrovic, A.M. 1990. “The Fate of <strong>Nitrogen</strong>ous Fertilizers Applied to<br />
Turfgrass.” Journal of Environmental Quality, 19(1): 1-14.<br />
Water Resources Office 20<br />
<strong>Cape</strong> <strong>Cod</strong> <strong>Commission</strong>
<strong>Technical</strong> <strong>Bulletin</strong> <strong>91</strong>-<strong>001</strong> (FINAL)<br />
NITROGEN LOADING<br />
April, 1992<br />
Robertson, W.D., J.D. Cherry, and E.A. Sudicky. 19<strong>91</strong>. “Ground-Water Contamination<br />
from Two Small Septic Systems on Sand Aquifers.” Ground<br />
Water. 29(1): 82-92.<br />
Soil Conservation Service. 1986. Urban Hydrology for Small Watersheds. <strong>Technical</strong><br />
Release 55, Second Edition. United States Department of Agriculture,<br />
Washington, DC.<br />
Suffolk County Department of Health Services. 1983. Pilot Plant Study: <strong>Nitrogen</strong><br />
Removal in Modified Residential Subsurface Sewage Disposal System,<br />
Phase 2 - Additional Investigations. Hauppauge, NY.<br />
United States Environmental Protection Agency. 1975. Water Programs,<br />
National Interim Primary Drinking Water Regulations. Federal Register.<br />
40(248): 59566-59587.<br />
United States Environmental Protection Agency. 1990. (Draft) Guidance in<br />
Developing Health Criteria for Determining Unreasonable Risks to Health.<br />
Office of Drinking Water, Washington, DC.<br />
US Environmental Protection Agency and Massachusetts Executive Office of<br />
Environmental Affairs. 19<strong>91</strong>. “Buzzards Bay Comprehensive Conservation<br />
and Management Plan (Final), Volume I: Management Recommendations<br />
and Action Plans.” Buzzards Bay Project. Marion, MA.<br />
Witt, M., R. Siegrist, and W.C. Boyle. 1974. “Rural Home Wastewater Characteristics”<br />
in Proceedings of the National Home Sewage Disposal Symposium,<br />
December 9 & 10, Chicago, IL. American Society of Agricultural Engineers,<br />
St. Joseph, MI.<br />
Water Resources Office 21<br />
<strong>Cape</strong> <strong>Cod</strong> <strong>Commission</strong>