Complete Regional Transportation Plan 2012 - Cape Cod ...
Complete Regional Transportation Plan 2012 - Cape Cod ...
Complete Regional Transportation Plan 2012 - Cape Cod ...

Create successful ePaper yourself
Turn your PDF publications into a flip-book with our unique Google optimized e-Paper software.
<strong>Cape</strong> <strong>Cod</strong> <strong>2012</strong><strong>Regional</strong> <strong>Transportation</strong> <strong>Plan</strong><strong>2012</strong>-2035Endorsed August 22, 2011Revised May 20, 2013
Prepared by:CAPE COD COMMISSION <strong>Transportation</strong> Staffon behalf of the<strong>Cape</strong> <strong>Cod</strong> Metropolitan <strong>Plan</strong>ning OrganizationMassachusetts Department of <strong>Transportation</strong><strong>Cape</strong> <strong>Cod</strong> <strong>Regional</strong> Transit Authority<strong>Cape</strong> <strong>Cod</strong> CommissionBarnstable CountyTown of BarnstableTowns of Bourne, Sandwich, Falmouth, and MashpeeTowns of Yarmouth, Dennis, Harwich, Brewster, and ChathamTowns of Orleans, Eastham, Wellfleet, Truro, and ProvincetownMashpee Wampanoag Tribein cooperation with:Massachusetts Department of Environmental ProtectionUnited States Department of <strong>Transportation</strong> Federal Highway AdministrationUnited States Department of <strong>Transportation</strong> Federal Transit AdministrationThis report was funded in part through grants from the Federal Highway Administration and Federal TransitAdministration, United States Department of <strong>Transportation</strong> (USDOT). The views and opinions of the <strong>Cape</strong><strong>Cod</strong> Metropolitan <strong>Plan</strong>ning Organization expressed herein do not necessarily state or reflect those of theUSDOT
Table of ContentsChapter 1: Goals & ObjectivesChapter 2: The <strong>Transportation</strong> System2.1 – Land Use and the Environment2.2 – Road <strong>Transportation</strong>2.3 – Bus <strong>Transportation</strong>2.4 – Rail <strong>Transportation</strong>2.5 – Water <strong>Transportation</strong>2.6 – Air <strong>Transportation</strong>2.7 – Canal Area <strong>Transportation</strong>2.8 – Sub-RegionsChapter 3: SafetyChapter 4: SecurityChapter 5: Bicycle & Pedestrian IssuesChapter 6: Congestion ManagementChapter 7: Analysis of AlternativesChapter 8: Recommendations and Financial <strong>Plan</strong>Appendices: Air Quality Conformity Public Comments on Draft RTPReproductions of this document may be in black-and-white. Full-color versions are available at the <strong>Cape</strong> <strong>Cod</strong>Commission’s website:www.capecodcommission.org
<strong>2012</strong> REGIONAL TRANSPORTATION PLANChapter 1: Goals and ObjectivesEndorsedAugust 22, 2011
Chapter 1: Table of Contents1. Introduction ....................................................................................... 11.1 <strong>Transportation</strong> <strong>Plan</strong>ning Process ...................................................... 31.2 Public Participation Process ............................................................. 61.2.1 Meetings .................................................................................. 61.2.2 Surveys and Comment Forms ..................................................... 71.2.3 Inclusion of Environmental, Human Service, and Cultural ResourceOrganizations ....................................................................... 111.3 Livability L ................................................................................. 111.4 Goals of the <strong>2012</strong> <strong>Plan</strong> ................................................................. 131.4.1 Safety and Security ................................................................. 131.4.2 Congestion Relief .................................................................... 151.4.3 Multimodal Accessibility L ....................................................... 171.4.4 System Maintenance ............................................................... 181.4.5 Environmental Protection ......................................................... 191.4.6 Community Orientation L ....................................................... 201.4.7 Equitability ............................................................................. 221.4.8 Cooperation among Stakeholders ............................................. 221.5 Changes since the 2007 <strong>Plan</strong> ......................................................... 241.5.1 <strong>Transportation</strong> Projects Since the 2007 <strong>Plan</strong> .............................. 241.6 Comparing Goals with Other <strong>Plan</strong>s ................................................. 261.6.1 Consistency with Federal <strong>Transportation</strong> <strong>Plan</strong>ning Goals ............. 261.6.2 Consistency with Commonwealth <strong>Transportation</strong> <strong>Plan</strong>ning Goals . 271.6.3 Comparison with <strong>Cape</strong> <strong>Cod</strong> <strong>Regional</strong> <strong>Plan</strong>ning Goals ................... 281.7 Background and Demographic Information ..................................... 291.7.1 Demographics ......................................................................... 291.7.2 Economics .............................................................................. 351.7.3 Land Use ................................................................................ 431.7.4 Environmental Justice L ......................................................... 481.8 Conclusion ................................................................................... 49Chapter 1: List of FiguresFigure 1 - Barnstable County/<strong>Cape</strong> <strong>Cod</strong> Overview Map ..................................... 2Figure 2 - <strong>Transportation</strong> <strong>Plan</strong>ning Process Flowchart ...................................... 5Figure 3 - Barnstable County Population Growth 2000-2009 ........................... 30Figure 4 - Percent of Barnstable County and Massachusetts population Age 65+.......................................................................................................... 33<strong>Cape</strong> <strong>Cod</strong> <strong>Regional</strong> <strong>Transportation</strong> <strong>Plan</strong> | August 2011Chapter 1: Goals & Objectives
Figure 5 - Employment in Barnstable County - Average Month, 1980-2002 ...... 37Figure 6 - Goods vs. Service Producing Industries in <strong>Cape</strong> <strong>Cod</strong> and Mass. ........ 39Figure 7 - Work Destinations of Barnstable Residents..................................... 40Figure 8 - Work Origins to Barnstable County ................................................ 41Figure 9 - Net Difference of Worker Destinations-Origins ................................ 42Figure 10 - Barnstable County Housing Unit Estimates 2000 - 2008 ................. 44Figure 11 - <strong>Cape</strong> <strong>Cod</strong> Zoning and Land Use Patterns ...................................... 45Figure 12 - Nauset Bay and the <strong>Cape</strong> <strong>Cod</strong> National Seashore in Eastham ......... 46Figure 13 - Map of Environmental Justice Populations on <strong>Cape</strong> <strong>Cod</strong> ................. 48Chapter 1: List of TablesTable 1 - RTP Local Traffic Delay Areas (from public comment form) .............. 10Table 2 - RTP Local Safety Problem Areas (from public comment form) ........... 11Table 3 - TIP Projects Constructed, Implemented, Advertised, or Underway .... 25Table 4 - Goals Compared: Federal vs. RTP ................................................... 27Table 5 - Goals Compared: Massachusetts <strong>Transportation</strong> <strong>Plan</strong> vs. RTP ........... 28Table 6 - Goals Compared: <strong>Regional</strong> Policy <strong>Plan</strong> vs. RTP ................................ 29Table 7 - A Comparison of <strong>Cape</strong> <strong>Cod</strong> Towns’ 2000-2008 Population Change .... 31Table 8 - Number of Households and Household Size for <strong>Cape</strong> <strong>Cod</strong> and Towns 32Table 9 - State Ranking by Town: Percent of <strong>Cape</strong> Residents age 65+ ............ 33Table 10 - Residents Aged 12-21 on <strong>Cape</strong> <strong>Cod</strong>, by Town ................................ 34Table 11 - Median Household Income in Barnstable County ............................ 36Table 12 - Residents Living and Working within <strong>Cape</strong> <strong>Cod</strong> and Towns, 2000 .... 38Table 13 - Barnstable County Employment by Major Industry Sector, 2002 ...... 40Table 14 - Barnstable County Journeys to Work ............................................ 43Chapter 1: Goals & Objectives <strong>Cape</strong> <strong>Cod</strong> <strong>Regional</strong> <strong>Transportation</strong> <strong>Plan</strong> | August 2011
1. IntroductionThis <strong>2012</strong> <strong>Cape</strong> <strong>Cod</strong> <strong>Regional</strong> <strong>Transportation</strong> <strong>Plan</strong> (RTP) is a fiscally constrained set oftransportation projects, programs, “smart” solutions, and transportation studies for the25 years from 2011 to 2035. The planning area of the RTP includes all major (and manyminor) modes of travel throughout all 15 communities of Barnstable County and isundertaken by the <strong>Cape</strong> <strong>Cod</strong> Commission transportation staff on behalf of the <strong>Cape</strong> <strong>Cod</strong>Metropolitan <strong>Plan</strong>ning Organization (MPO).This chapter includes background information on the roles and responsibilities ofparticipating agencies, a synopsis of the public participation process, and a section onthe goals and objectives of the current plan. Changes and progress since the 2007 planare also discussed in this chapter as well as an outline of the demographic characteristicsof Barnstable County.The remaining chapters of this <strong>Plan</strong> include: An examination of the <strong>Cape</strong>’s existing transportation system and future trendsand forecasts A discussion of safety & security transportation issues (e.g., crash rates, hurricaneevacuation etc.) An analysis of congestion management issues (e.g., travel times and delays) A review of existing and needed bicycle facilities Listings of alternatives including evaluation based on RTP conformity criteria Integration of recent transportation studies A set of recommended projects, programs, “smart” solutions, and transportationstudies that a fiscally constrained based on estimated available funding<strong>Cape</strong> <strong>Cod</strong> <strong>Regional</strong> <strong>Transportation</strong> <strong>Plan</strong> | August 2011Chapter 1: Goals & ObjectivesPage 1
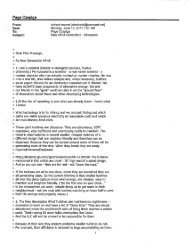
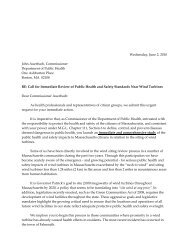
FIGURE 1 - BARNSTABLE COUNTY/CAPE COD OVERVIEW MAPThe map shown above identifies the fifteen <strong>Cape</strong> <strong>Cod</strong> communities and major highwayssuch as Routes 6, 28, and 6A.Chapter 1: Goals & Objectives <strong>Cape</strong> <strong>Cod</strong> <strong>Regional</strong> <strong>Transportation</strong> <strong>Plan</strong> | August 2011Page 2
1.1 TRANSPORTATION PLANNING PROCESSThe <strong>Cape</strong> <strong>Cod</strong> Metropolitan <strong>Plan</strong>ning Organization (MPO) is responsible for reviewing,guiding, and endorsing the RTP. Currently, the official position/agency of eachmembership is as follows:Secretary, Massachusetts Department of <strong>Transportation</strong>Administrator, Massachusetts Department of <strong>Transportation</strong>/Highway DivisionChair/<strong>Cape</strong> <strong>Cod</strong> <strong>Regional</strong> Transit AuthorityChair/<strong>Cape</strong> <strong>Cod</strong> CommissionCommissioner/Barnstable CountyCouncil President/Town of BarnstableSelectman*/Towns of Bourne, Sandwich, Falmouth & MashpeeSelectman*/Towns of Yarmouth, Dennis, Harwich, Brewster & ChathamSelectman*/Towns of Orleans, Eastham, Wellfleet, Truro & ProvincetownChair/Mashpee Wampanoag Tribal Council*One selectman from each set of towns is elected by the selectmen to serveThe MPO is served by an advisory body: the <strong>Cape</strong> <strong>Cod</strong> Joint <strong>Transportation</strong> Committee(CCJTC). The CCJTC membership includes representatives from each of BarnstableCounty’s fifteen towns and a bicycle advocate.Development of the RTP also includes consultation with or consideration of a wide-rangeof federal, state, and local agencies and organizations. Such agencies include:Regulatory Agencies<strong>Cape</strong> <strong>Cod</strong> Metropolitan <strong>Plan</strong>ning Organization<strong>Cape</strong> <strong>Cod</strong> Joint <strong>Transportation</strong> Committee<strong>Cape</strong> <strong>Cod</strong> CommissionMassachusetts Department of <strong>Transportation</strong>Massachusetts Department of Recreation and Conservation<strong>Cape</strong> <strong>Cod</strong> TownsFederal Highway AdministrationFederal Transit AdministrationU.S. Army Corps of EngineersBarnstable County Government<strong>Cape</strong> <strong>Cod</strong> <strong>Regional</strong> <strong>Transportation</strong> <strong>Plan</strong> | August 2011Chapter 1: Goals & ObjectivesPage 3
Coordinating AgenciesMassRidesMassBike<strong>Cape</strong> <strong>Cod</strong> National Seashore (National Park Service)<strong>Transportation</strong> Providers<strong>Cape</strong> <strong>Cod</strong> <strong>Regional</strong> Transit AuthorityWoods Hole, Martha’s Vineyard and Nantucket Steamship AuthorityPlymouth and Brockton Street Railway CompanyPeter Pan – Bonanza Bus Lines<strong>Cape</strong> <strong>Cod</strong> Central RailroadBay Colony RailroadOther Freight CompaniesHy-Line CruisesAir <strong>Transportation</strong> Companies<strong>Cape</strong> AirNantucket AirNeighboring AgenciesOld Colony <strong>Plan</strong>ning CouncilSoutheastern <strong>Regional</strong> <strong>Plan</strong>ning and Economic Development DistrictMartha’s Vineyard CommissionNantucket <strong>Plan</strong>ning and Economic Development CommissionChapter 1: Goals & Objectives <strong>Cape</strong> <strong>Cod</strong> <strong>Regional</strong> <strong>Transportation</strong> <strong>Plan</strong> | August 2011Page 4
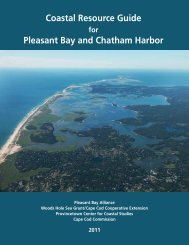
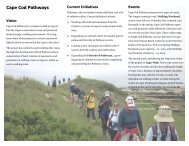
RTP<strong>Regional</strong><strong>Transportation</strong><strong>Plan</strong>TIP<strong>Transportation</strong>ImprovementProgramMonitor & EvaluateProjectImplementationFIGURE 2 - TRANSPORTATION PLANNING PROCESS FLOWCHARTThe figure above shows the relationship between the development of the long-range plan(RTP), the funding element known as the <strong>Transportation</strong> Improvement Program (TIP),and implementation (e.g., construction of road improvements, operation of new transitservices, etc.). Federal legislation requires updates to the TIP every four years; howeverthe <strong>Cape</strong> <strong>Cod</strong> MPO typically performs this update on an annual basis. Note the dashedred arc from “Project Implementation” to the “RTP.” This line represents the on-goingmonitoring and evaluation of the transportation system that is used to inform the RTPdecision-making. The primary method whereby this is accomplished is through theMPO’s Unified <strong>Plan</strong>ning Work Program (UPWP). The UPWP, developed annually,outlines all major transportation studies and planning efforts (including thedevelopment of the RTP and TIP). The MPO staff’s efforts through UPWP studies formthe bases for most of the projects prioritized in the RTP and TIP.<strong>Cape</strong> <strong>Cod</strong> <strong>Regional</strong> <strong>Transportation</strong> <strong>Plan</strong> | August 2011Chapter 1: Goals & ObjectivesPage 5
1.2 PUBLIC PARTICIPATION PROCESSAdequate opportunity for public official (including elected officials) and citizeninvolvement must be provided in the development of the transportation plan. Reviewprocedures shall include opportunities for interested parties (including citizens, affectedpublic agencies, representatives of transportation agency employees, and privateproviders of transportation) to be involved in the early stages of the plandevelopment/update process. The public participation elements associated with thedevelopment of the <strong>Plan</strong> for the <strong>Cape</strong> <strong>Cod</strong> region include the following elements.1.2.1 MEETINGSNumerous meetings have been held to discuss development of the <strong>Cape</strong> <strong>Cod</strong> <strong>Regional</strong><strong>Transportation</strong> <strong>Plan</strong>. The following list includes partial list of meetings held solely forthe plan, as well as meetings of various organizations at which the RTP was discussed.Meetings held are listed by organization or meeting type, the most recent meetings arelisted first. The latest list of RTP meetings is available online at the <strong>Cape</strong> <strong>Cod</strong>Commission’s websites.<strong>Cape</strong> <strong>Cod</strong> Metropolitan <strong>Plan</strong>ning Organization, time and day varies, <strong>Cape</strong> <strong>Cod</strong>Commission Office, Barnstable Meetings beginning in July 2010 and continuing throughout the development ofthe RTP<strong>Cape</strong> <strong>Cod</strong> Joint <strong>Transportation</strong> Committee – 8:30 Fridays once per month, <strong>Cape</strong><strong>Cod</strong> Commission office, Barnstable Meetings beginning in February 2010 and continuing throughout thedevelopment of the RTP.RTP Focus Workshops (Hyannis <strong>Transportation</strong> Center) Roadways & the Environment: Wednesday, July 28, 2010 – 3:00 PM Air, Ferry, and Rail: Monday, July 19, 2010 – 3:00 PM Public Transit: Tuesday, July 13, 2010 – 3:00 PM Bicycle and Pedestrian: Saturday, June 26, 2010 – 1:30 PM<strong>Regional</strong> <strong>Transportation</strong> <strong>Plan</strong> Public Meetings: August 16, 2011 – 3:30 PM – <strong>Cape</strong> <strong>Cod</strong> Commission Office (Barnstable) Thursday, March 18, 2010 – 1:30 PM - Bourne Memorial Community Center Tuesday, March 16, 2010 – 4:00 PM – Hyannis <strong>Transportation</strong> Center Monday, March 15, 2010 – 7:00 PM – Salt Pond Visitors’ Center (Eastham)Chapter 1: Goals & Objectives <strong>Cape</strong> <strong>Cod</strong> <strong>Regional</strong> <strong>Transportation</strong> <strong>Plan</strong> | August 2011Page 6
consistent as traffic congestion was mentioned as among the three worst problems fortheir town by about 39% of respondents and for the <strong>Cape</strong> by about 46% of respondents.Respondents also identified “Future Problems for Towns and for the <strong>Cape</strong>.” The topissue respondents believe will be a problem in the next five years is traffic congestion.91% of respondents rated traffic congestion in their town as a serious problem in the next5 years; for the entire <strong>Cape</strong>, this figure is 94%. The concern about traffic may translatedirectly to respondents’ ideas about setting priorities and development. 68% ofrespondents indicated that the amount of development on <strong>Cape</strong> <strong>Cod</strong> is too much (4%said too little and 28% feel there is about the right amount).RTP Questionnaire ResultsTo further facilitate public comment, a five-page RTP questionnaire was distributed atpublic meetings. The questionnaire was also announced in the <strong>Cape</strong> <strong>Cod</strong> CommissionReporter newsletter, and on the <strong>Cape</strong> <strong>Cod</strong> Commission <strong>Transportation</strong> InformationCenter at www.gocapecod.org/rtp with an on-line option for respondents to use. Thequestionnaire included questions on goals and priorities, identification of local andregional safety problems, and regional congestion problems. There were also a numberof example projects for respondents to indicate their support (or opposition).Twenty-eight comment forms were submitted electronically or collected at publicmeetings. One of the most valuable benefits of this input was the generation of potentialsolutions. These are discussed at length in a later chapter of the RTP (Analysis ofAlternatives). The questionnaire was also used to gauge respondents’ views regardingsafety and congestion. The most common “Factor to Consider” in determining the mostimportant transportation projects for the <strong>Cape</strong> was improved public transportation. Alsolisted prominently were recommended improvements for bicycling and walking andsafety improvements.RTP ObjectivesRespondents were presented with a list of 15 potential transportation objectives for <strong>Cape</strong><strong>Cod</strong> and asked to assign a value of 1 – 5 (5 being the most important) to the top fivepriorities. Results included:The highest number of responses (17) included “Maintain roads and bridges toavoid costly reconstruction” as a top 5 priority (average response =2.88).16 respondents supported “Improve hazardous locations by constructing safetyimprovements (e.g., turning lanes, median barriers, etc.) at an average responseof 3.50Also reaching a threshold of 3.50 average response, 14 respondents highly ranked“Improve public transportation (bus, air, rail, and water transportation)”Chapter 1: Goals & Objectives <strong>Cape</strong> <strong>Cod</strong> <strong>Regional</strong> <strong>Transportation</strong> <strong>Plan</strong> | August 2011Page 8
The highest average response, 4.50, was given by 2 respondents for “Allow trafficcongestion within ‘growth centers’ to be offset with reduced congestion outside‘growth centers.’Potential projectsThere were 17 potential projects listed in the questionnaire, and respondents were askedto rate their support (or opposition) to each.None of the projects fell into the “-2” (greatly oppose) or “-1” (oppose) categories. Fiveprojects fell into the “0” (neutral) range. Projects in the “+1” (support) range include:Expand <strong>Cape</strong>-wide year-round bus serviceNew “Bus-Only” lanes for Route 3 and Route 6 (to improve reliability of publictransit)<strong>Transportation</strong> management center (facility to monitor and coordinate traffic &transit operations)Extension of <strong>Cape</strong> <strong>Cod</strong> Rail Trail from S. Wellfleet to ProvincetownHyannis: underpass of major traffic flows at the Barnstable Airport RotaryProjects achieving the “+2” (greatly support) rating include:Rail service to Hyannis (connections to Boston/Providence)Variable message signs (for alerting motorists about traffic conditions)Live traffic reports (via radio, internet, etc.) for <strong>Cape</strong> <strong>Cod</strong> Canal area roads &bridgesFalmouth-Chatham: Route 28 bicycle accommodations (e.g., bike lanes, widershoulders, “share the road” program)Route 6: reconfigure Exit 1 (move westbound ramps away from Sagamore Bridge)Bourne Rotary replacement (similar to Sagamore Rotary project)Additional travel lanes and multi-use path on Yarmouth Rd/Willow StImproved crossing of <strong>Cape</strong> <strong>Cod</strong> Canal (new bridge or tunnel)Congestion Areas:One section of the questionnaire queried respondents on their perceptions of congestion.When considering the region as a whole, common themes emerged including:<strong>Cape</strong> <strong>Cod</strong> Canal BridgesYarmouth Road/Willow Street in BarnstableRoute 28 from Falmouth to Yarmouth, especially in the Hyannis area.The respondents were also asked to “…list the top three areas that have the worstLOCAL TRAFFIC DELAY problems” for the town that they resided in or spent the most<strong>Cape</strong> <strong>Cod</strong> <strong>Regional</strong> <strong>Transportation</strong> <strong>Plan</strong> | August 2011Chapter 1: Goals & ObjectivesPage 9
time in. The following table presents a list of the top two locations identified from thequestionnaire:TABLE 1 - RTP LOCAL TRAFFIC DELAY AREAS (FROM PUBLIC COMMENT FORM)(Responses as of 8/23/2010)Town Location #1 Location #2Barnstable Route 132 signals Yarmouth Road/Willow StreetBourne Bourne Rotary Sandwich RoadEasthamRoute 6 southbound to Route 6 northbound @ WellfleetEastham Rotarytown lineFalmouthRoute 28 @ Jones Road/TerTeaticket Highway (Route 28)Heun DriveHarwichMain Street (Route 39) @Route 124Route 6 Exit 11 off rampMashpee Mashpee RotaryRoute 151 @ Old BarnstableRoadOrleans Route 6A @ Main Street Main Street @ Old Colony WayTruro Left turns onto Route 6Yarmouth Route 28 in West Yarmouth Route 28 @ Station AvenueSafety Problem Areas:Included in the questionnaire was a question asking each respondent to look at the <strong>Cape</strong>as a whole and identify the worst regional safety locations. Collectively, the greatestnumber of responses listed specific or generic locations along Route 6. This was followedup by responses listing Route 28.One of the questions asked was tied to the town that each respondent either resided in orspent the most time in while visiting <strong>Cape</strong> <strong>Cod</strong>. The question asked “…list the top threeareas that have the worst LOCAL SAFETY problems.” The responses were reviewed andthe following table presents a list of the top two locations in each town indicated as safetyproblems:Chapter 1: Goals & Objectives <strong>Cape</strong> <strong>Cod</strong> <strong>Regional</strong> <strong>Transportation</strong> <strong>Plan</strong> | August 2011Page 10
TABLE 2 - RTP LOCAL SAFETY PROBLEM AREAS (FROM PUBLIC COMMENT FORM)(Responses as of 8/23/2010)Town Location #1 Location #2Barnstable Rt 28 Main StBourne MacArthur Blvd Bike/Pedestrian SafetyEastham Rt 6 (left turns) Samoset Rd/<strong>Cape</strong> <strong>Cod</strong> Rail TrFalmouth Rt 28 Teaticket Hwy Woods Hole Rd/Locust StHarwich Rt 39/Pleasant Bay Rd Rt 28/Sisson RdMashpee Mashpee Rotary Rt 28/QuinnaquissettOrleans Rt 6A/Rt 28 Main St/Old Colony WayTruro Rt 6 (left turns) Rt 6 (passing on right)YarmouthStation Ave (between OldTownhouse Rd & Rt 6) Rt 281.2.3 INCLUSION OF ENVIRONMENTAL, HUMAN SERVICE, ANDCULTURAL RESOURCE ORGANIZATIONSNotices of meetings and announcements of RTP development activities have been sent tofederal, state, and local elected representatives and public officials. Among theapproximately 150 contacts on the transportation mailing list are many members of thepublic. Several environmental, human service, cultural resource, and relatedstakeholder organizations are included in this process. These include:Barnstable Historical CommissionAssociation to Preserve <strong>Cape</strong> <strong>Cod</strong>Barnstable County Department of Human Services<strong>Cape</strong> Organization for the Rights of the DisabledMassachusetts Coastal Zone ManagementMassachusetts Department of Environmental ManagementMassachusetts Department of Conservation and RecreationMassachusetts Bike Coalition1.3 LIVABILITY LLivability refers to the social and environmental quality of an area as perceived byresidents, workers, and visitors. The U.S. Department of <strong>Transportation</strong> considers theprinciple of Livability to be essential to the success of regional transportation planning.According to the Victoria Transport Policy Institute, this includes safety and health(traffic safety, personal security, public health), local environmental conditions(cleanliness, noise, dust, air quality, water quality), the quality of social interactions(neighborliness, fairness, respect, community identity and pride), opportunities forrecreation and entertainment, and aesthetics. In the particular case of <strong>Cape</strong> <strong>Cod</strong>,<strong>Cape</strong> <strong>Cod</strong> <strong>Regional</strong> <strong>Transportation</strong> <strong>Plan</strong> | August 2011Chapter 1: Goals & ObjectivesPage 11
especially important are the existence of unique cultural and environmental resources(e.g., historic structures, mature trees, traditional architectural styles).Livability directly benefits people who live in, work in or visit <strong>Cape</strong> <strong>Cod</strong>, increasesproperty values and business activity, and it can improve public health and safety.Livability is largely affected by conditions in our public spaces, places where peoplenaturally interact with each other and their community, including roads, conservationlands, transportation hubs and other public facilities, and so is affected by public policyand planning decisions.<strong>Transportation</strong> decisions can have a major impact on Livability. Streetscapes that areattractive, safe and suitable for a variety of transportation modes (particularly walking)are a key factor in Livability. Traffic safety, traffic noise and local air pollution,affordability, impervious surface coverage (i.e., the portion of land devoted to roads andparking), preservation of environmental and cultural structures, and opportunities forrecreation are all Livability factors often affected by transportation policies andpractices. <strong>Transportation</strong> decisions can also affect social interactions and communitycohesion. Pedestrian-friendly streets create opportunities for people to meet andinteract, helping to create community networks.Traditional transportation planning tends to emphasize vehicle mobility improvementsover other Livability objectives. Many roads were designed primarily to maximize trafficflow, and buildings were designed to maximize parking convenience. Far greaterresources were devoted to automobile facilities (road and parking) than fornonmotorized modes. There is now increasing appreciation of the importance ofLivability objectives. <strong>Plan</strong>ners realize that roads often play multiple roles as both travelcorridors and places for community interaction. Many communities now favor roadwayimprovements that reduce traffic speeds and limit traffic volumes for the sake ofLivability. The principles of Livability have been implicit in all editions of the <strong>Cape</strong> <strong>Cod</strong><strong>Regional</strong> <strong>Transportation</strong> <strong>Plan</strong> (RTP). In this <strong>2012</strong> RTP as a guide to readers, eachsection that directly supports Livability is identified with the green circled L symbol:LThe MPO continues to support Livability through the endorsement of supportingprojects developed for the <strong>Transportation</strong> Improvement Program (TIP). Recent TIPprojects are shown in Section 1.5.1 later in this chapter. Livability projects are indicatedwith the green circled L symbol in Table 3.Chapter 1: Goals & Objectives <strong>Cape</strong> <strong>Cod</strong> <strong>Regional</strong> <strong>Transportation</strong> <strong>Plan</strong> | August 2011Page 12
1.4 GOALS OF THE <strong>2012</strong> PLANThe purpose of these goals is to produce a coherent and comprehensive framework forthe development of projects and programs that address the transportation needs of the<strong>Cape</strong> <strong>Cod</strong> Region.Mission Statement:The <strong>Regional</strong> <strong>Transportation</strong> <strong>Plan</strong> will propose a strategy that will maintain and improvea transportation system on <strong>Cape</strong> <strong>Cod</strong> for present and future year round and seasonalneeds which is safe, convenient, accessible, cost-effective, and consistent with the <strong>Cape</strong>’shistoric, scenic and natural resources.This mission statement and <strong>Cape</strong> <strong>Cod</strong> Metropolitan <strong>Plan</strong>ning Organization (MPO)guidance served as a foundation for the formation of eight goals for the 2007 <strong>Regional</strong><strong>Transportation</strong> <strong>Plan</strong>:Safety and SecurityCongestion ReliefMultimodal AccessibilitySystem MaintenanceEnvironmental ProtectionCommunity OrientationEquitabilityCooperation among StakeholdersInput received through public meetings, surveys, and presentations to localorganizations contributed to the development of these goals. Moreover, the <strong>Regional</strong><strong>Transportation</strong> <strong>Plan</strong> is designed to conform to federal, state and local transportationgoals.1.4.1 SAFETY AND SECURITY<strong>Transportation</strong> users have a right to a transportation system where their person andpossessions will arrive at their destinations unharmed and undamaged. Moreover,protecting the value of freight traveling over the transportation network is essential tothe economy of <strong>Cape</strong> <strong>Cod</strong>. Therefore, it is important that transportation infrastructurebe designed to minimize the possibility of hazardous situations or accidents. Existingtraffic laws must also be enforced to prevent the improper use of the transportationsystem. The transportation system must also prepare for natural disasters, such ashurricanes or flood. Moreover, in a post-9/11 world, protecting users from externalthreats is also a priority, as indicated by the increased emphasis on security in federaland state transportation regulations and guidelines. For all of these reasons, the<strong>Cape</strong> <strong>Cod</strong> <strong>Regional</strong> <strong>Transportation</strong> <strong>Plan</strong> | August 2011Chapter 1: Goals & ObjectivesPage 13
<strong>Regional</strong> <strong>Transportation</strong> <strong>Plan</strong> is developed with the first goal of providing safety andsecurity to people and goods.Goal #1:Create a transportation system that provides safe travel options for peopleand freight, and protects users from natural and external threats.The following items include actions andpolicies to support this Goal:Make physical improvements thatimprove the safety and securityof the transportation network apriority.Continuously monitor thecondition of the transportation systemto ensure that it is safe to travel on allmodes throughout <strong>Cape</strong> <strong>Cod</strong>.Identify high priority safetylocations throughout <strong>Cape</strong> <strong>Cod</strong> andthen determine measures to increasesafety at those locationsSeparate high- and low-speedtravel modes, so that those travelingat slower speeds, such as bicycles andpedestrians, do not conflict with those traveling at higher speeds, such as rail andautomobile traffic.For proposed roadways with cross-sections of four or more lanes, landscapedmedian dividers shall be included to provide a reasonable level of safetyand access management.Existing multilane roads (cross-sections of four or more lanes) are recommendedto be modified via removal of unneeded lanes or installation of landscapedmedian dividers to provide a reasonable level of safety and accessmanagement.To reduce injury crashes, when developing intersection improvements such asthe signalization of previously unsignalized locations, include construction of amodern roundabout as an alternative.Encourage safe use of the transportation network through public awarenesscampaigns, promoting such things as seatbelts for motorists and helmet use forbicyclistsIncorporate intelligent transportation systems, such as variable messagesigns and other media alerts, into the emergency response system.Foster communication and cooperation between federal, state, and localagencies for the planning, practice, and implementation of emergency scenarioplans.Chapter 1: Goals & Objectives <strong>Cape</strong> <strong>Cod</strong> <strong>Regional</strong> <strong>Transportation</strong> <strong>Plan</strong> | August 2011Page 14
Designate and indicate, through road signs, emergency evacuation routes,and shelters.Support enforcement of state and local traffic laws.Increase surveillance and security efforts at transportation facilitiesthroughout <strong>Cape</strong> <strong>Cod</strong>, such as the Hyannis <strong>Transportation</strong> Center, Falmouth BusDepot, Woods Hole port facilities, park-and-ride lots, and <strong>Cape</strong> <strong>Cod</strong> CanalBridges.Since Safety is such an important goal of the RTP, it is important to recognize the linkbetween this document and the State’s 2006 “Strategic Highway Safety <strong>Plan</strong>” (SHSP).The SHSP lists several “Emphasis Areas” including:Data Systems (focus on Crashes, Roadway, Medical, Vehicle Registration,Driver History, Citations).Infrastructure (focus on Lane Departure Crashes, Intersection Crashes)At-Risk Driver Behavior (focus on Occupant Protection, Speeding,Alcohol/Impaired Driving)Higher-Risk <strong>Transportation</strong> System Users (focus on Young Drivers, OlderDrivers, Pedestrians, Bicyclists, Motorcyclists)Public Education and Media (focus on Statewide Safety Marketing, Mediamessages, Public Awareness)Safety Program Management (focus on Process for Institutionalizing theSHSP)Implementation of many of these Emphasis Areas is demonstrated through therecommendations provided in Chapter 3 –Safety of this RTP.1.4.2 CONGESTION RELIEFCongestion presents users with longer travel times, increased safety concerns, andgreater frustration. It also makes it harder for travel by alternative transportationmodes, such as buses, bicycles, andpedestrians. Additionally, congestionaffects other entities, such as businessesthat rely on transportation access for theiremployees and customers. Congestion alsoproduces more air pollution and increasesgreenhouse gas emissions that contributeto global warming, and decreases theoverall attractiveness of the region. For allthese reasons, addressing the deficienciesin infrastructure, land use and behavioralchoices that lead to congestion is a priorityof the <strong>Regional</strong> <strong>Transportation</strong> <strong>Plan</strong>.<strong>Cape</strong> <strong>Cod</strong> <strong>Regional</strong> <strong>Transportation</strong> <strong>Plan</strong> | August 2011Chapter 1: Goals & ObjectivesPage 15
Goal #2:Optimize travel time throughout the transportation system for people andfreight by pursuing strategies to reduce congestion in areas where it existsand taking proactive measures to prevent congestion in currently freeflowingareas.The following items include actions and policies to support this Goal:Identify high-traffic congestion locations throughout <strong>Cape</strong> <strong>Cod</strong> andconsider solutions to address that congestion.Consider strategies that encourage alternative transportation modes inidentified high-congestion locations, so that people have options other thanautomobiles.Consider strategies to address the behavioral causes of traffic congestionsuch as VMT reduction strategies as well as changes to transportationinfrastructure.Where possible, incorporate the Congestion Management System,including new roadways, intersection improvements, park-and-ride, and transitcapacity, into transportation projects and programs.Support all strategies for transportation demand management including, butnot limited to, <strong>Transportation</strong> Management Associations, flexible hours,carpooling, bus pas programs, preferential parking, and telecommuting.Encourage transit-oriented development and provide alternatives toautomobile travel by linking land use decisions with transit, bikeway, pedestrian,and park-and-ride investments.To reduce traffic congestion and facilitate free-flowing traffic, when developingintersection improvements such as the signalization of previously unsignalizedlocations, include construction of a modern roundabout as an alternative.Consider the feasibility of congestion pricing on major routes on <strong>Cape</strong> <strong>Cod</strong>.Assess the capacity of <strong>Cape</strong> <strong>Cod</strong>’s ports and harbors in accommodating ferrytraffic and recommend strategies to solve existing ferry congestion or preventfuture congestion.Examine the road traffic around <strong>Cape</strong> <strong>Cod</strong>’s ports and harbors todetermine the ability of the current infrastructure to accommodate ferry-relatedauto trafficAssess the capacity of <strong>Cape</strong> <strong>Cod</strong>’s airports in accommodating air traffic andrecommend strategies to solve existing air traffic congestion or preventfuture congestion.Examine the road traffic around <strong>Cape</strong> <strong>Cod</strong>’s airports to determine theability of the current infrastructure to accommodate air-related auto traffic.Chapter 1: Goals & Objectives <strong>Cape</strong> <strong>Cod</strong> <strong>Regional</strong> <strong>Transportation</strong> <strong>Plan</strong> | August 2011Page 16
1.4.3 MULTIMODAL ACCESSIBILITY LThe purpose of a transportation system is to get people from where they are to wherethey want to go. Additionally, freight must be transported from where it is to where itcan be consumed or processed. The costs of this transportation system in time andmoney are increased for the user if it is difficult to access the transportation system, or ifcircuitous routes must be taken to reach a destination. Addressing accessibility,connectivity, and mobility with a multimodal approach is one of the goals of the <strong>Regional</strong><strong>Transportation</strong> <strong>Plan</strong>.Goal #3:Connect village centers, economic andemployment centers, and points of interest usingmultiple coordinated modes of transportation ina direct and efficient manner.The following items include actions and policies tosupport this Goal:“<strong>Complete</strong> Streets” are encouraged as a designguideline to accommodate all users including pedestrians, bicyclists, persons inwheelchairs or strollers, public transportation users, and motorists. In order toprovide transportation options for <strong>Cape</strong> <strong>Cod</strong> residents and visitors toconveniently travel between destinations, each public right of way should beplanned, designed, constructed, and/or maintained considering all users for a<strong>Complete</strong> Street design. A <strong>Complete</strong> Street design on <strong>Cape</strong> <strong>Cod</strong> also considersthe environmental and physical context along with local public input.Sufficient mobility must be provided to ensure that individuals and freightcan travel safely and efficiently among the communities of <strong>Cape</strong> <strong>Cod</strong> and theirneighborsSupport established village and town centers and growth areas asidentified in the Commission’s <strong>Regional</strong> Land Use Vision Maps with a broadrange of transportation options, such as roadways, transit, bicycle and pedestrianfacilitiesExamine expansion of bus, rail and bicycle services and infrastructure tovillages and town centers currently un-served by alternative transportationmodesCreate mini-intermodal centers in village and town centers, whereappropriate, to encourage better connection and coordination between modes.Coordinate public transportation services and schedules between regionsand between providers to decrease wait times for users during connections.Provide bicycle amenities, such as racks and/or lockers, at park-and-ridelots, transit centers, and village and town centers that support bicycle networks.Enhance the transportation of freight on <strong>Cape</strong> <strong>Cod</strong> to decrease traveltimes, increase reliability and lower costs for freight transportation providers,with minimal disruption to other transportation activities.<strong>Cape</strong> <strong>Cod</strong> <strong>Regional</strong> <strong>Transportation</strong> <strong>Plan</strong> | August 2011Chapter 1: Goals & ObjectivesPage 17
Where possible, work to consolidate freight so as to move goods in the mostefficient manner.Make available multiple modes for freight transportation, withinfrastructure and facilities that are designed to support quick and efficientchanges in mode.1.4.4 SYSTEM MAINTENANCEMillions of public and private dollars of have been investedin <strong>Cape</strong> <strong>Cod</strong>’s current transportation system. Implicit inthis investment is a trust placed in public agencies tomaintain and upkeep transportation infrastructure, capital,and programs. Moreover, new technologies present thepossibility of safely increasing the capabilities of the currenttransportation system beyond original design limitations.By maintaining the current system and incorporating newtechnologies, the life of the existing system can be extendedand the value returned to users can be maximized. Forthese reasons, the <strong>Regional</strong> <strong>Transportation</strong> <strong>Plan</strong> includesthe preservation, maintenance and modernization of theexisting transportation system as a goal.Goal #4:Preserve, Maintain, and Modernize the Existing <strong>Transportation</strong> System.The following items include actions and policies to support this Goal:Ensure that adequate funds are reserved for maintenance and operation of theexisting transportation system before new capital projects are considered inaccordance with the Commonwealth’s “Fix-it-First” policy.Reserve adequate funds for the maintenance of alternative modes oftransportation, such as public transportation services, sidewalks, and bicyclepaths.As transportation services are considered for areas subject to the effects of sealevelrise, new facilities shall be constructed with consideration to vulnerability.Create and implement asset management tools for monitoring and maintainingthe existing transportation system. Include automatic traffic monitoringequipment as part of intersection upgrades.Support maintenance strategies and programs that accommodate safe travelthroughout the transportation network, regardless of mode.Consider the use of new technologies that will lower costs, extendinfrastructure life, lower environmental impacts, and reduce energy consumptionand emissions.Chapter 1: Goals & Objectives <strong>Cape</strong> <strong>Cod</strong> <strong>Regional</strong> <strong>Transportation</strong> <strong>Plan</strong> | August 2011Page 18
New transportation projects must consider inclusion of intelligenttransportation system (ITS) elements, such as variable message signs,highway advisory radio, local television, web travel services, and smart signalsthat can provide travel data as well as react to changes in demand.1.4.5 ENVIRONMENTAL PROTECTIONThe natural environment is a valuable asset that we share. Clean air, clean water, andsustainable ecosystems benefit all of the residents of <strong>Cape</strong> <strong>Cod</strong>. The naturalenvironment also serves as an attraction for tourists and recreational users, whichbenefits the economy of <strong>Cape</strong> <strong>Cod</strong>. The 2008 Global Warming Solution Act requires 10-25% reductions in greenhouse gasemissions below 1990 levels by 2020.The Massachusetts Executive Office ofEnergy and Environmental Affairs willbe setting target reductions. Accordingto the U.S. Environmental ProtectionAgency, vehicle miles traveled (VMTs) inBarnstable County increased 28.9 %between 1996 to 2007, and are expectedto increase another 45.6% between 2007to 2030 under current trends.To protect and preserve our environment, MassDOT has recently instituted the“GreenDOT” policy initiative. This, in part, is intended to conform with theMassachusetts’ Global Warming Solutions Act. GreenDOT policy advises MPO’s tomonitor and track greenhouse gas (GHG) impacts throughout the regional planningprocess.In order to maintain and enhance the current state of the environment for futuregenerations, the <strong>Regional</strong> <strong>Transportation</strong> <strong>Plan</strong> includes environmental protection as agoal.Goal #5:Create a transportation system that maintains, protects, and enhances thenatural environment of <strong>Cape</strong> <strong>Cod</strong>.The following items include actions and policies to support this Goal:Design an environmentally friendly transportation system thatprotects and enhances the natural environment, including the protection ofhabitat, water quality, and agricultural and forest land, while minimizing invasivespecies and reducing greenhouse gas emissions.Develop strategies to reduce vehicle miles traveled (VMTs)<strong>Cape</strong> <strong>Cod</strong> <strong>Regional</strong> <strong>Transportation</strong> <strong>Plan</strong> | August 2011Chapter 1: Goals & ObjectivesPage 19
Comply with state and federal environmental regulations.Encourage the use of alternative transportation modes that reduce airpollution, fuel consumption, and other environmental impacts such asgreenhouse gas emissions.Pursue strategies that will get automobiles and trucks moving at speeds thatwill minimize air pollution.To reduce emissions from idling vehicles, when developing intersectionimprovements such as the signalization of previously unsignalized locations,include construction of a modern roundabout as an alternative.Replace public buses and vehicles with fuel-efficient, hybrid, or bio-dieselvehicles that will reduce fossil fuel consumption.As roadway improvement projects are developed, stormwater managementtechniques shall be included to control surface runoff and avoid contamination ofnearby water bodies. Special concern should be given to impaired marine andfresh water bodies identified by the Department of Environmental Protection.Design roadways to drain and cleanse oil and gasoline runoff away fromaquifers and other sensitive environmental areas.Create Harbor and Bay Management <strong>Plan</strong>s to protect <strong>Cape</strong> <strong>Cod</strong> harborsand bays from pollution caused by excessive or improper boating use.Protect drinking water from materials used in the design, construction,operation, and maintenance of transportation facilities, such as road salt.Use landscaping and noise barriers to protect communities and minimizeadverse impacts.Provide safe right-of-way crossings for wildlife1.4.6 COMMUNITY ORIENTATION LThe transportation system is part of a larger societal system that includes land use,economic activity, cultural, and historical elements that vary by community.Inappropriate development will negatively affect these and other areas and underminelocal goals. <strong>Transportation</strong> improvements and programs must instead work in concertwith community goals and policies. Therefore, the <strong>Regional</strong> <strong>Transportation</strong> <strong>Plan</strong>includes community orientation as a goal.Goal #6:Create a transportation systemthat reinforces localdevelopment, land use,economic, cultural, and historicpreservation goals.The following items include actionsand policies to support this Goal:Chapter 1: Goals & Objectives <strong>Cape</strong> <strong>Cod</strong> <strong>Regional</strong> <strong>Transportation</strong> <strong>Plan</strong> | August 2011Page 20
All transportation projects and programs must be responsive to the naturaland built environments within which they are undertaken.Develop a transportation system that supports the economic vitality of<strong>Cape</strong> <strong>Cod</strong> and its metropolitan areas, especially by enabling globalcompetitiveness, productivity, and efficiency, through services provided by publicand private operators.Involve community and business leaders in transportation projects andprograms to ensure that local concerns are addressed.Develop context-sensitive design measures that support the “<strong>Cape</strong> <strong>Cod</strong>Character,” while maintaining safety, accessibility, and sustainability. Thisleads to transportation projects that are in harmony with the community, andthat preserve the environmental, scenic, aesthetic, historic, and natural resourcevalues of the area.“<strong>Complete</strong> Streets” are encouraged as a design guideline to accommodate allusers including pedestrians, bicyclists, persons in wheelchairs or strollers, publictransportation users, and motorists. In order to provide transportation optionsfor <strong>Cape</strong> <strong>Cod</strong> residents and visitors to conveniently travel between destinations,each public right of way should be planned, designed, constructed, and/ormaintained considering all users for a <strong>Complete</strong> Street design. A <strong>Complete</strong> Streetdesign on <strong>Cape</strong> <strong>Cod</strong> also considers the environmental and physical context alongwith local public input.Avoid, minimize or mitigate the impact of transportation improvements onparks, recreation areas, historic sites, and other scenic or cultural resourcesand minimize impact on overall community character.Support transportation projects consistent with Local Comprehensive <strong>Plan</strong>s.Current MassDOT sign policy does not allow business logo signs east of the <strong>Cape</strong> <strong>Cod</strong>Canal. The <strong>Cape</strong> <strong>Cod</strong> MPO recommends that this policy be maintained, except for"sponsor a highway" signs. On "sponsor a highway" signs, the <strong>Cape</strong> <strong>Cod</strong> MPOrecommends that business logos be allowed at the discretion of the MassDOT DistrictOffice Director.<strong>Cape</strong> <strong>Cod</strong> <strong>Regional</strong> <strong>Transportation</strong> <strong>Plan</strong> | August 2011Chapter 1: Goals & ObjectivesPage 21
1.4.7 EQUITABILITY<strong>Transportation</strong> is necessary for any individual who wishes to participate in today’smodern society. An equitable transportation system can provide independence andmobility to senior citizens and the disabled, while also providing access andopportunities for low income individuals. For these reasons, it is vital that thetransportation facilities of <strong>Cape</strong> <strong>Cod</strong> be safe, accessible and equitable for all citizens andvisitors.Goal #7:Promote the equitable sharing of the transportation system’s benefits andburdens including consideration of income, age, physical and mental ability,and transit dependency.The following items include actions andpolicies to support this Goal:Ensure that new transportationprojects treat alldemographic groupsequally, so that particulardemographic groups, such asseniors, low-income individualsor children, are not subjected toinequitable environmental,health, or financial impacts.Support programs that addressthe transportation needs of lowincome and transit dependentpopulations such as lifeline transit services.Meet or surpass the requirements of the Americans with DisabilitiesAct, for all transportation projects and programs.Support self-sufficiency by providing specialized transportation services.Tailor specific transportation programs for those without access to automobiles,such as students and senior citizens.Improve the engagement of low income and minority populations in thetransportation decision-making process.1.4.8 COOPERATION AMONG STAKEHOLDERSThe transportation system has an effect on local communities. Moreover, noimprovements can be made to the system without the participation of multiple publicChapter 1: Goals & Objectives <strong>Cape</strong> <strong>Cod</strong> <strong>Regional</strong> <strong>Transportation</strong> <strong>Plan</strong> | August 2011Page 22
and private organizations. When these stakeholders, whom include private citizens,businesses, and government agencies, get together to pool resources, share ideas, andcoordinate activities, better projects and programs are produced. Hence, a goal of the<strong>Regional</strong> <strong>Transportation</strong> <strong>Plan</strong> is to foster cooperation among transportationstakeholders. In 2007 the Mashpee Wampanoag tribe gained sovereign status throughfederal recognition and efforts are being made to include tribal leaders in thetransportation planning process.Goal #8:Base projects and programs on an objective, transparent and inclusivedecision-making process in cooperation with federal, state, regional, andlocal transportation agencies, government officials, businesses and citizens.The following items include actions andpolicies to support this Goal:Encourage public attendance atmeetings of the MPO and othertransportation agencies thatparticipate in the planning of <strong>Cape</strong><strong>Cod</strong>’s transportation system.Have the various transportationagencies on <strong>Cape</strong> <strong>Cod</strong> hold regularOpen Houses, where the publiccan observe the transportationdevelopment process.Foster greater communication and involvement between the varioustransportation agencies on <strong>Cape</strong> <strong>Cod</strong>.Ensure Consistency with Federal and State <strong>Transportation</strong>Regulations and Guidelines, such as SAFETEA-LU, the “Massachusetts Long-Range <strong>Transportation</strong> <strong>Plan</strong>,” and the emissions reductions required under theGlobal Warming Solutions Act.Pursue projects and studies that conform to and reinforce the vision of the <strong>Cape</strong><strong>Cod</strong> <strong>Regional</strong> Policy <strong>Plan</strong>.Develop a set of objective transportation project evaluation criteria sothat stakeholders can compare proposed projects in a consistent manner.Maintain a continuous transportation survey, available via the internet orby request through the mail.Work within funding constraints, so that the transportation system ismaintained, built and operated in an efficient and cost-effective manner.Disclose funding sources and disbursements in an open, simple andstraightforward manner.Publish all existing data, studies, and activities relevant to <strong>Cape</strong> <strong>Cod</strong>’stransportation system<strong>Cape</strong> <strong>Cod</strong> <strong>Regional</strong> <strong>Transportation</strong> <strong>Plan</strong> | August 2011Chapter 1: Goals & ObjectivesPage 23
1.5 CHANGES SINCE THE 2007 PLANThis section includes discussions of new or expanded transportation planning goals anda status listing of projects since the 2007 RTP.1.5.1 TRANSPORTATION PROJECTS SINCE THE 2007 PLANSubsequent to the creation of the 2007 RTP, the following table includes a listing of the<strong>Cape</strong>’s <strong>Transportation</strong> Improvement Program (TIP) projects. The TIP is the short-termfunding element of the transportation planning process. The listed projects have eitherbeen constructed, implemented, advertised, or are undergoing construction.The nineteen projects listed in the following table include funding for public transit,roadway maintenance and intersection improvement, bridge reconstruction, bicyclefacilities and design of safety improvements. The total estimated cost or award amountsfor all of these projects are over 86 million dollars.Chapter 1: Goals & Objectives <strong>Cape</strong> <strong>Cod</strong> <strong>Regional</strong> <strong>Transportation</strong> <strong>Plan</strong> | August 2011Page 24
TABLE 3 - TIP PROJECTS CONSTRUCTED, IMPLEMENTED, ADVERTISED, OR UNDERWAYTownLocationEst. Cost orAwardAmountBARNSTABLE Hyannis Gateway / Main Street L $378,944BARNSTABLE Route 6A resurfacing $3,045,000BARNSTABLE Route 132 Boulevard L $9,600,000BARNSTABLE Route 132 Boulevard Landscaping L $1,100,000BARNSTABLERoute 28 at three locations: Route 149, South County Road, LumbertMill Road$3,200,000BOURNE Route 6 Scenic Highway at Edgehill Road $3,948,728BOURNE Route 6 Scenic Highway resurfacing $1,651,519CAPEWIDETRANSIT<strong>Cape</strong> <strong>Cod</strong> <strong>Regional</strong> Transit Authority (CCRTA) L $34,409,544DENNIS Swan River Road reconstruction L $2,300,000DENNIS Route 28 at Route 134 intersection improvements $596,000DENNIS Route 6A resurfacing $1,680,620EASTHAM/ORLEANSRoute 6 resurfacing and related $2,200,000FALMOUTH Shining Sea Bikeway Phase III L $4,000,000FALMOUTH Water Street Drawbridge, Woods Hole $8,000,000FALMOUTH Chapaquoit Road Bridge over West Falmouth Harbor $3,000,000FALMOUTH Route 28 Section known as "Reine's Corner" $2,000,000HARWICH Route 124 at Queen Anne Road intersection improvements $859,800ORLEANS Route 28 and Finlay Road intersection $590,000PROVINCETOWNRoute 6 at Province Lands Road $2,500,000SANDWICH Route 130/Water St and Main Street intersection (Town Hall Square)L $600,000SANDWICHHighway Safety Improvement Program Design(Sandwich: CotuitRoad/Harlow Road)$458,514YARMOUTH Packet Landing site improvements L $633,436Total: $86,752,105(Note: L indicates project supports Livability principles. See section 1.3.)<strong>Cape</strong> <strong>Cod</strong> <strong>Regional</strong> <strong>Transportation</strong> <strong>Plan</strong> | August 2011Chapter 1: Goals & ObjectivesPage 25
1.6 COMPARING GOALS WITH OTHER PLANSEffective transportation planning includes consideration of goals formulated at state andfederal levels, and adjacent <strong>Regional</strong> <strong>Plan</strong>ning Agencies.1.6.1 CONSISTENCY WITH FEDERAL TRANSPORTATION PLANNINGGOALSThe RTP is formulated under a federal process as required in the 2005 transportationfunding legislation known as the “Safe, Accountable, Flexible, Efficient, <strong>Transportation</strong>Equity Act: A Legacy for Users” (SAFETEA-LU). A comparison of SAFETEA-LUplanning goals with those of the RTP is presented in the following table.Chapter 1: Goals & Objectives <strong>Cape</strong> <strong>Cod</strong> <strong>Regional</strong> <strong>Transportation</strong> <strong>Plan</strong> | August 2011Page 26
TABLE 4 - GOALS COMPARED: FEDERAL VS. RTPSAFETEA-LUSupport the Economic vitality of theMetropolitan AreaIncrease the safety of the transportationsystemIncrease the security of the transportationsystemIncreasing the accessibility and mobility ofpeople and for freightProtecting and Enhancing the environment,promoting energy conservation……and promoting consistency with land useand economic development patternsEnhancing the integration and connectivityof the transportation systemPromoting efficient system managementand operationEmphasizing the preservation and efficientuse of the existing transportation systemSafety and Security◊◊Reduced CongestionAccessible, Multi-modalConnectionsSystem MaintenanceEnvironmental ProtectionCommunity OrientationEquitability<strong>Regional</strong> <strong>Transportation</strong> <strong>Plan</strong> Goals◊◊◊◊◊◊Cooperation amongStakeholders◊ ◊ ◊◊◊◊1.6.2 CONSISTENCY WITH COMMONWEALTH TRANSPORTATIONPLANNING GOALSThe RTP is formulated in cooperation with statewide planning efforts. The latestMassachusetts transportation plan (draft) is called “You Move Massachusetts.” Acomparison of state planning themes with those of the RTP is presented in the followingtable.<strong>Cape</strong> <strong>Cod</strong> <strong>Regional</strong> <strong>Transportation</strong> <strong>Plan</strong> | August 2011Chapter 1: Goals & ObjectivesPage 27
TABLE 5 - GOALS COMPARED: MASSACHUSETTS TRANSPORTATION PLAN VS. RTPSafety and SecurityReduced CongestionAccessible, MultimodalConnectionsCommonwealth of Massachusetts“You Move Massachusetts” ThemesImprove <strong>Transportation</strong> System Reliability ◊ ◊Focus More Attention on Maintaining our<strong>Transportation</strong> SystemSystem MaintenanceEnvironmental ProtectionCommunity OrientationEquitability<strong>Regional</strong> <strong>Transportation</strong> <strong>Plan</strong> GoalsDesign <strong>Transportation</strong> Systems Better ◊ ◊ ◊Encourage Shared Use of Infrastructure◊Increase Capacity by Expanding ExistingFacilities and Services◊ ◊Create a More User-Friendly <strong>Transportation</strong>System◊◊Broaden the <strong>Transportation</strong> System toServe More People◊Provide Adequate <strong>Transportation</strong> Fundingand Collect Revenue EquitablyMinimize Environmental Impacts◊Improve Access to our <strong>Transportation</strong>System◊◊◊◊◊Cooperation amongStakeholders◊1.6.3 COMPARISON WITH CAPE COD REGIONAL PLANNING GOALSThe RTP is also formulated in consultation with the regional planning agency for <strong>Cape</strong><strong>Cod</strong> – the <strong>Cape</strong> <strong>Cod</strong> Commission. Every five years, the Barnstable County ordinanceknown as the <strong>Regional</strong> Policy <strong>Plan</strong> (RPP) undergoes an update. A comparison of thecurrent RPP (approved in 2009) transportation goals with those of the RTP is presentedin the following table.Chapter 1: Goals & Objectives <strong>Cape</strong> <strong>Cod</strong> <strong>Regional</strong> <strong>Transportation</strong> <strong>Plan</strong> | August 2011Page 28
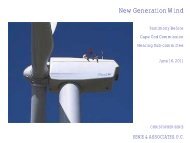
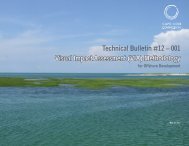
TABLE 6 - GOALS COMPARED: REGIONAL POLICY PLAN VS. RTPSafety and SecurityReduced CongestionAccessible, MultimodalConnections<strong>Transportation</strong> Goals from the <strong>Cape</strong><strong>Regional</strong> <strong>Transportation</strong> <strong>Plan</strong> Goals<strong>Cod</strong> <strong>Regional</strong> Policy <strong>Plan</strong>To improve safety and eliminate hazardsfor all users of <strong>Cape</strong> <strong>Cod</strong>’s transportation ◊◊systemTo reduce and/or offset the expectedincrease in motor vehicle trips on publicroadways, reduce dependency onautomobiles, and reduce air and noise◊ ◊ ◊ ◊pollution. To promote a balanced andefficient transportation system thatincludes alternatives to automobile travel.To maintain or improve travel times andLevel of Service on roads and intersectionsand to ensure that all road and intersectionconstruction or modifications are consistent◊ ◊ ◊ ◊with community character, historicresources, and scenic resources*The Commission conducts an inclusive public participation process during the review ofDevelopments of <strong>Regional</strong> Impact, Local Comprehensive <strong>Plan</strong>s, and other planning efforts.System MaintenanceEnvironmental ProtectionCommunity OrientationEquitabilityCooperation amongStakeholders*1.7 BACKGROUND AND DEMOGRAPHIC INFORMATIONSome concerns transcend region or mode, such as demographic changes, economictrends, or housing issues. This section addresses issues relating to <strong>Cape</strong> <strong>Cod</strong> as a region.An update of these demographics, include forecasts to RTP future milestone years isavailable in Chapter 7.1.7.1 DEMOGRAPHICSAccording to the <strong>Cape</strong> <strong>Cod</strong> Commission, from 1920 to 2000, <strong>Cape</strong> <strong>Cod</strong> was among theleading counties in Massachusetts for population growth. Between 1990 and 2000,Barnstable County added about 35,600 residents, an increase of 19.1% according to the<strong>Cape</strong> <strong>Cod</strong> <strong>Regional</strong> <strong>Transportation</strong> <strong>Plan</strong> | August 2011Chapter 1: Goals & ObjectivesPage 29
Census. The most recent estimates have shown a decline in population for <strong>Cape</strong> <strong>Cod</strong>since the 2000 Census. Barnstable County’s 2009 population estimate is 221,151residents – almost a half percent reduction from 2000. The following figure displays theCensus Bureau’s annual population estimates for Barnstable County.Between 2000 and 2009, only two counties in Massachusetts experienced negativepopulation growth: Barnstable County (-0.49%) and Berkshire County (-4.2%). Both ofthese counties were inconsistent with Massachusetts’ 3.85% positive growth. The twocounties with the most estimated growth for this time period are Nantucket County(18.93%) and Suffolk County (9.25%).FIGURE 3 - BARNSTABLE COUNTY POPULATION GROWTH 2000-2009While Barnstable County’s overall population has been estimated to have declined since2000, there has been a lot of variability between the included towns. Of the fifteen townswithin Barnstable County, five have shown positive growth. Mashpee has grown the mostduring the eight year time span, adding almost 10% to its 2000 population. Accordingto the Census, the other four towns with positive growth are Bourne, Chatham,Falmouth, and Truro. Yarmouth and Dennis have shown the greatest decline: -4.15% and-3.91%, respectively.Chapter 1: Goals & Objectives <strong>Cape</strong> <strong>Cod</strong> <strong>Regional</strong> <strong>Transportation</strong> <strong>Plan</strong> | August 2011Page 30
TABLE 7 - A COMPARISON OF CAPE COD TOWNS’ 2000-2008 POPULATION CHANGE<strong>Cape</strong> <strong>Cod</strong> Town 2000 Census 2008 Est. 00-’08 ChangeBarnstable 47,821 46,184 -3.42%Bourne 18,721 19,392 +3.58%Brewster 10,094 9,936 -1.57%Chatham 6,625 6,701 +1.15%Dennis 15,973 15,349 -3.91%Eastham 5,453 5,438 -0.28%Falmouth 32,660 33,123 +1.42%Harwich 12,386 12,298 -0.71%Mashpee 12,946 14,227 +9.89%Orleans 6,341 6,269 -1.14%Provincetown 3,431 3,376 -1.60%Sandwich 20,136 20,129 -0.03%Truro 2,087 2,125 +1.82%Wellfleet 2,749 2,724 -0.91%Yarmouth 24,807 23,778 -4.15%<strong>Transportation</strong> infrastructure on <strong>Cape</strong> <strong>Cod</strong> must accommodate those areas wherepopulation growth is attracting new residential development. Otherwise, new residentswill not be able to access jobs, shopping, schools, or other basic services.While overall population is one way to assess demand for transportation, examining thenumber of households is another indicator of the number of trips generated.Households are the start and end to almost all trips, such as trips to work, shopping, andschool. The number of households and household sizes are used by travel demandmodels to predict regional travel patterns. On <strong>Cape</strong> <strong>Cod</strong>, there are 94,822 households,with an average size of 2.28. Of all <strong>Cape</strong> towns, Barnstable has the most households with19,626, while Truro has the least with 907 (See Table below). There have also beensignificant disparities between towns regarding changes in the number of households.While Mashpee experienced almost three times as much growth in households as theentire <strong>Cape</strong> (66.4%), Provincetown actually lost households (-5.4%). For all <strong>Cape</strong> <strong>Cod</strong>,the number of households increased by 22.2% between 1990 and 2000, but the averagesize of those households decreased. This means that there are more households on <strong>Cape</strong><strong>Cod</strong> with less people. The average household shrank in size for all <strong>Cape</strong> <strong>Cod</strong> towns,except Mashpee. Bourne (-0.21), Falmouth (-0.12), and Dennis (-0.11) had the greatestdecreases in average household size in the county (See Table below). <strong>Cape</strong> <strong>Cod</strong> townsmust ensure that the changes in the number and type of trips made by these householdsare provided for by the transportation system.<strong>Cape</strong> <strong>Cod</strong> <strong>Regional</strong> <strong>Transportation</strong> <strong>Plan</strong> | August 2011Chapter 1: Goals & ObjectivesPage 31
TABLE 8 - NUMBER OF HOUSEHOLDS AND HOUSEHOLD SIZE FOR CAPE COD AND TOWNSTotalHouseholds2000Avg.HouseholdSize2000% Changefrom 1990Changefrom 1990United States 105,480,101 14.7% 2.59 -0.04Massachusetts 2,443,580 8.7% 2.51 -0.07<strong>Cape</strong> <strong>Cod</strong> 94,822 22.2% 2.28 -0.07Barnstable 19,626 18.2% 2.38 -0.02Bourne 7,439 26.1% 2.39 -0.21Brewster 4,124 21.9% 2.34 -0.08Chatham 3,160 4.5% 2.00 -0.10Dennis 7,504 21.1% 2.11 -0.11Eastham 2,396 25.6% 2.24 -0.10Falmouth 13,859 22.9% 2.30 -0.12Harwich 5,471 21.4% 2.20 -0.07Mashpee 5,256 66.4% 2.91 No changeOrleans 3,087 13.4% 2.00 -0.09Provincetown 1,837 -5.4% 1.69 -0.11Sandwich 7,335 32.0% 2.72 -0.02Truro 907 29.8% 2.18 -0.07Wellfleet 1,301 15.2% 2.11 -0.10Yarmouth 11,520 20.1% 2.68 -0.01(Source: U.S. Census)Age is an important demographic factor to be considered on <strong>Cape</strong> <strong>Cod</strong>. Between 1950and 2000, the percentage of <strong>Cape</strong> <strong>Cod</strong> residents over 65 years of age almost doubled,from 12.1% to 23.1%. Between 1990 and 2000, the over 65 population on <strong>Cape</strong> <strong>Cod</strong> grewfrom 22.0% to 23.1%. By contrast, the over 65 population of the Commonwealth grew asa proportion to the overall population, from 10% to 13.5% (Figure 3). According to theCensus, Barnstable County ranked 126 th out of 3,141 counties nationally in terms ofpercent of population over the age of 65. At the time of the 2000 Census, the totalnumber of residents on <strong>Cape</strong> <strong>Cod</strong> over 65 was 51,265, of which 57% are women. Thismeans that the regional transportation system must consider the needs of the elderly to agreater extent than other local counties. Elderly residents generally have reduced vision,increased response time, and reduced mobility compared to the overall population.These concerns must be addressed in order to ensure safety and accessibility.Of the Commonwealth’s towns with the highest percentage of residents 65 and over in2000, eight of the top ten towns were located in <strong>Cape</strong> <strong>Cod</strong>. Orleans led theChapter 1: Goals & Objectives <strong>Cape</strong> <strong>Cod</strong> <strong>Regional</strong> <strong>Transportation</strong> <strong>Plan</strong> | August 2011Page 32
Commonwealth with 36.0% of residents over 65. Chatham (34.3%), Yarmouth (30.1%),Harwich (29.6%), Dennis (28.4%), Brewster (26.2%), and Eastham (26.0%), followedbehind (Table 9). It should be noted that a higher percentage of elderly people does notequate to a higher number of elderly residents. The total elderly population is a productof the elderly percentage and the town’s total population. The transportation facilities inthese towns must be adapted to serve this population safely and conveniently.FIGURE 4 - PERCENT OF BARNSTABLE COUNTY ANDMASSACHUSETTS POPULATION AGE 65+TABLE 9 - STATE RANKING BY TOWN:PERCENT OF CAPE RESIDENTS AGE 65+(Source: U.S. Census)Teenagers comprise another demographic group that deserves special consideration.Residents aged 12-16 are old enough to be potential transportation users but are in mostcases dependent on parents or others for transportation. This means that publictransportation can offer an alternative and help 12-16 year olds gain mobility andindependence. Residents aged 17-21 are in many cases new drivers. In order to ensurethe safety of these new drivers, as well as existing drivers, the transportation systemmust be easy to use.<strong>Cape</strong> <strong>Cod</strong> <strong>Regional</strong> <strong>Transportation</strong> <strong>Plan</strong> | August 2011Chapter 1: Goals & ObjectivesPage 33
TABLE 10 - RESIDENTS AGED 12-21 ON CAPE COD, BY TOWNPopulationAged12-16% of TotalPopulationAged12-16PopulationAged17-21% of TotalPopulationAged17-21% of TotalPopulationAged12-21 RankBarnstable 3,041 6.4% 2,215 4.6% 11.0% 4Bourne 1,090 5.8% 1,339 7.2% 13.0% 2Brewster 730 7.2% 424 4.2% 11.4% 3Chatham 301 4.5% 226 3.4% 7.9% 13Dennis 870 5.4% 604 3.8% 9.2% 9Eastham 311 5.7% 208 3.8% 9.5% 8Falmouth 2,163 6.6% 1,334 4.1% 10.7% 5Harwich 681 5.5% 459 3.7% 9.2% 10Mashpee 873 6.7% 512 4.0% 10.7% 6Orleans 288 4.5% 208 3.3% 7.8% 14Provincetown 93 2.7% 113 3.3% 5.9% 15Sandwich 1,665 8.3% 978 4.9% 13.2% 1Truro 117 5.6% 68 3.3% 8.9% 11Wellfleet 172 6.2% 117 4.3% 10.5% 7Yarmouth 1,248 5.0% 896 3.6% 8.6% 12<strong>Cape</strong> <strong>Cod</strong> 13,643 6.1% 9,701 4.4% 10.5% -(Source: U.S. Census)Overall, 6.1% of <strong>Cape</strong> <strong>Cod</strong> Residents are aged 12-16. Among towns, there is variation,since 12-16 year olds generally live with their parents, and some towns have largerhouseholds than others. The town with the greatest percentage of 12-16 year olds isSandwich, at 8.3%. Following behind Sandwich are Brewster (7.2%), Mashpee (6.7%),Falmouth (6.6%), and Barnstable (6.4%). The town with the smallest percentage of 12-16 year olds is Provincetown, at 2.7% (See Table above). The data indicate that Upper<strong>Cape</strong> towns have the highest percentage of 12-16 year olds. <strong>Transportation</strong> services inthis sub-region must consider their potential use by 12-16 year olds.Residents 17-21 are generally high school and college students. College students oftenlive on <strong>Cape</strong> <strong>Cod</strong> seasonally, returning home for the summer and for school vacations.In many cases, both high school students and college students are new drivers. On <strong>Cape</strong><strong>Cod</strong>, the percentage of the population that is 17-21 is 4.4%. With the exception ofBourne, there are only a few percentage points of variation among towns, which isprobably due to the fact that students move to other regions to attend college. Bournehas the highest percentage of residents 17-21 at 7.2%. This may be related to the Mass.Maritime Academy and the Mass. Military Reservation located within the town.Chapter 1: Goals & Objectives <strong>Cape</strong> <strong>Cod</strong> <strong>Regional</strong> <strong>Transportation</strong> <strong>Plan</strong> | August 2011Page 34
Sandwich (4.9%) and Barnstable (4.3%) follow behind. Truro has the smallestpercentage of residents aged 17-21, at 3.3% (See Table on previous page). Like the 12-16year old demographic, the Upper <strong>Cape</strong> towns have higher percentages of 17-21 year olds.However, pockets of 17-21 year olds can be found in Wellfleet and Brewster. Towns withhigher percentages of 17-21 year olds must accommodate these young people in order toensure that transportation infrastructure and services are safe, convenient, and notcongested.1.7.2 ECONOMICSEconomic factors also have an influence on transportation. Better economic times meanthat people are working more, shopping more, and traveling more. Moreover, higherincome families generate more trips, in most cases. More money means that people canpurchase more gas and larger, more expensive vehicles. The types of jobs people havealso influence transportation patterns. White collar workers generally have longercommutes, while blue collar service workers are located near their work sites.Median household income on <strong>Cape</strong> <strong>Cod</strong> was $45,933 in 1999, below the statewideaverage. In fact, <strong>Cape</strong> <strong>Cod</strong>’s median household income has been below the statewideaverage for the past 30 years. However, economic growth in <strong>Cape</strong> <strong>Cod</strong> has exceeded thatof the state in the past decade. Sandwich is the highest income town in BarnstableCounty at $61,250, and has remained so for the last 30 years. By contrast, the medianhousehold income in Provincetown has remained the lowest in Barnstable County for thelast 30 years. In 1999, the median household income in Provincetown was $32,716.Between 1989 and 1999, Wellfleet had the largest growth in household income of anytown, at over 80% (See Table on next page).<strong>Cape</strong> <strong>Cod</strong> <strong>Regional</strong> <strong>Transportation</strong> <strong>Plan</strong> | August 2011Chapter 1: Goals & ObjectivesPage 35
TABLE 11 - MEDIAN HOUSEHOLD INCOME IN BARNSTABLE COUNTYChapter 1: Goals & Objectives <strong>Cape</strong> <strong>Cod</strong> <strong>Regional</strong> <strong>Transportation</strong> <strong>Plan</strong> | August 2011Page 36
FIGURE 5 - EMPLOYMENT IN BARNSTABLE COUNTY - AVERAGE MONTH, 1980-2002<strong>Cape</strong> <strong>Cod</strong> <strong>Regional</strong> <strong>Transportation</strong> <strong>Plan</strong> | August 2011Chapter 1: Goals & ObjectivesPage 37
TABLE 12 - RESIDENTS LIVING AND WORKING WITHIN CAPE COD AND TOWNS, 2000BarnstableCounty# of County ResidentsEmployed# Who Live and Workin County% of TotalWorkers99,197 84,704 85.4%# of Town ResidentsEmployed in BarnstableCounty# Who Live and Workin Town% of TotalWorkersBarnstable 23,106 12,147 52.6%Bourne 4,804 2,641 55.0%Brewster 3,064 1,345 43.9%Chatham 3,515 1,715 48.8%Dennis 5,008 2,041 40.8%Eastham 1,547 756 48.9%Falmouth 12,836 8,594 67.0%Harwich 3,772 1,554 41.2%Mashpee 4,154 1,480 35.6%Orleans 3,477 1,159 33.3%Provincetown 2,197 1,228 55.9%Sandwich 5,286 2,780 52.6%Truro 489 283 57.9%Wellfleet 1,466 622 42.4%Yarmouth 9,983 3,314 33.2%Total 84,704 41,659 49.2%(Source: U.S. Census)Between 1980 and 2000, employment on <strong>Cape</strong> <strong>Cod</strong> increased from 51,431 to 88,583, anincrease of 72.2%. Of the 88,583 jobs in Barnstable County in 2000, 84,704 were filledby <strong>Cape</strong> <strong>Cod</strong> residents. This means that 4.4% of people employed on <strong>Cape</strong> <strong>Cod</strong> commutefrom off-<strong>Cape</strong>. Similarly, 14.6% of employed <strong>Cape</strong> <strong>Cod</strong> residents work off-<strong>Cape</strong>, or14,493 people.Assume that all of those living on <strong>Cape</strong> <strong>Cod</strong> and working off-<strong>Cape</strong>, and all of those livingoff-<strong>Cape</strong> and working on <strong>Cape</strong> <strong>Cod</strong> must cross the <strong>Cape</strong> <strong>Cod</strong> Canal to reach theirdestination. This translates into 15,322 people who must cross the <strong>Cape</strong> <strong>Cod</strong> Canal daily.This creates over 30,000 trips a day, assuming that those people do not carpool, ridetransit, or take the day off. Given these assumptions, commuting trips would haveaccounted for roughly a third of average daily traffic over the canal roadways in 2000.In 2000, 85.4% of employed <strong>Cape</strong> <strong>Cod</strong> residents worked on <strong>Cape</strong> <strong>Cod</strong> and 49.2% ofthose live and work in the same town. Thus, despite the significant trips generated byChapter 1: Goals & Objectives <strong>Cape</strong> <strong>Cod</strong> <strong>Regional</strong> <strong>Transportation</strong> <strong>Plan</strong> | August 2011Page 38
long distance commuters, almost half of journey-to-work trips made by <strong>Cape</strong> <strong>Cod</strong>residents are local.The financial crisis that shattered the U.S. stock market in September of 2008 andplunged the U.S. and the rest of the industrialized world into a recession has affectedcitizens everywhere in tangible ways. One of the most salient effects of the recession hasbeen the high unemployment rate that has kept around 10% of the country’s labor forcewithout work for over a year. The most recent data for Barnstable County show 100,822people employed in a labor force of 113,733 – giving the county an unemployment rate of11.4% for December 2009. According to the U.S. Department of Labor, during thismonth, only Bristol County in Massachusetts had a higher unemployment rate (12.2%).The counties of Hampshire and Middlesex had the lowest unemployment rates inMassachusetts at 6.8% and 7.5%, respectively.FIGURE 6 - GOODS VS. SERVICE PRODUCING INDUSTRIES IN CAPE COD AND MASS.The vast majority of jobs on <strong>Cape</strong> <strong>Cod</strong>, 90.4%, are service-producing, which is higherthan the Commonwealth as whole, where 84% of jobs are service-producing. Of these,the industries with the highest number of employees in 2002 were Trade,<strong>Transportation</strong>, and Utilities (21,032), Education and Health Services (19,652), andLeisure and Hospitality (17,353). These industries also pay some of the lowest weeklywages on <strong>Cape</strong> <strong>Cod</strong>. Information services pay their employees the most, an average of$933 per week (See Table below). <strong>Transportation</strong> providers should understand the typesof jobs <strong>Cape</strong> <strong>Cod</strong> residents have, in order to properly tailor their services to meet theirneeds.<strong>Cape</strong> <strong>Cod</strong> <strong>Regional</strong> <strong>Transportation</strong> <strong>Plan</strong> | August 2011Chapter 1: Goals & ObjectivesPage 39
TABLE 13 - BARNSTABLE COUNTY EMPLOYMENT BY MAJOR INDUSTRY SECTOR, 2002Chapter 1: Goals & Objectives <strong>Cape</strong> <strong>Cod</strong> <strong>Regional</strong> <strong>Transportation</strong> <strong>Plan</strong> | August 2011Page 40FIGURE 7 - WORK DESTINATIONS OF BARNSTABLE RESIDENTSSource: American Community Survey, 2006-2008, Caliper C0rp.
The above figure shows Massachusetts’ workplace counties for Barnstable Countyresidents. Aside from the 84,705 residents employed within Barnstable County, themost popular destination is Plymouth County with 4,150 employees from BarnstableCounty. A complete table of Barnstable County journey to work origin/destinationinformation is presented at the end of this section.FIGURE 8 - WORK ORIGINS TO BARNSTABLE COUNTYSource: American Community Survey, 2006-2008, Caliper C0rp.The above figure shows Massachusetts’ origin counties for Barnstable County employees.Aside from the 84,705 workers that reside within Barnstable County, the most popularorigin is Plymouth County with 4,370 residents employed in Barnstable County. Acomplete table of Barnstable County journey to work origin/destination information ispresented at the end of this section.<strong>Cape</strong> <strong>Cod</strong> <strong>Regional</strong> <strong>Transportation</strong> <strong>Plan</strong> | August 2011Chapter 1: Goals & ObjectivesPage 41
FIGURE 9 - NET DIFFERENCE OF WORKER DESTINATIONS-ORIGINSSource: American Community Survey, 2006-2008, Caliper C0rp.The above figure shows the net difference of Massachusetts’ workplace counties lessresidence counties for Barnstable County residents/workers. Suffolk County (Boston)has the largest imbalance, employing a net 2,530 more Barnstable County Residentsthan are destined from Suffolk County for employment in Barnstable County. PlymouthCounty is the largest net contributor with 220 more residents employed in BarnstableCounty than are destined from Barnstable. A complete table of Barnstable Countyjourney to work origin/destination information is presented on the next page. Onecolumn of the table shows the number of Barnstable residents that work in each countyin Massachusetts. The next column shows the number of workers employed inBarnstable County by their county of residence.Chapter 1: Goals & Objectives <strong>Cape</strong> <strong>Cod</strong> <strong>Regional</strong> <strong>Transportation</strong> <strong>Plan</strong> | August 2011Page 42
CountyTABLE 14 - BARNSTABLE COUNTY JOURNEYS TO WORKJourney to Workfrom BarnstableJourney to Workto BarnstableNet DifferenceBarnstable 84,705 84,705 0Berkshire 50 0 50Bristol 1,265 1,390 -125Dukes 130 45 85Essex 135 90 45Franklin 40 15 25Hampden 35 55 -20Hampshire 50 10 40Middlesex 1,770 325 1,445Nantucket 135 10 125Norfolk 1,890 355 1,535Plymouth 4,150 4,370 -220Suffolk 2,765 235 2,530Worcester 440 80 360Source: American Community Survey, 2006-2008, Caliper C0rp.1.7.3 LAND USELand use patterns on the <strong>Cape</strong> have changed in the last 50 years from a village-centeredpattern of relatively dense development in centers surrounded by little or nodevelopment, to a suburban style of subdivisions and strip malls. Such changes havetransportation implications; and future land use patterns will both be affected by futuretransportation improvements and will create the need for new improvements.Land use on <strong>Cape</strong> <strong>Cod</strong> is dominated by housing and open space. According to taxassessor's data collected from 1988 to 1996, 38% of land on <strong>Cape</strong> <strong>Cod</strong> (excluding CampEdwards and Otis Air Force Base) is used for housing, while 26% is open space orrecreational land. Information developed by the <strong>Cape</strong> <strong>Cod</strong> Commission GeographicInformation System shows that an additional 30% is publicly-owned land, of whichmuch is open space. Less than 3 percent is used for employment.<strong>Cape</strong> <strong>Cod</strong> <strong>Regional</strong> <strong>Transportation</strong> <strong>Plan</strong> | August 2011Chapter 1: Goals & ObjectivesPage 43
1.7.3.1. HousingHousing is not only the most common land use on <strong>Cape</strong> <strong>Cod</strong>; it is also the one that isexperiencing the highest rate of growth. As population grows, so does the need for placesto live. In a region such as <strong>Cape</strong> <strong>Cod</strong> that tends heavily toward single-family detachedhousing, this population growth translates into an increase in the use of land forhousing. The housing density on the southern shore and the Buzzards Bay coastline isgreatest. Outer <strong>Cape</strong> development is denser in the town centers of Provincetown andEastham than the rest of the sub-region. Generally, lot sizes are largest on the <strong>Cape</strong> <strong>Cod</strong>Bay side of the <strong>Cape</strong>. Multifamily housing units are concentrated in areas, such asHyannis, downtown Wellfleet, and Dennisport. Other areas, such as Sandwich andBarnstable Village, are almost devoid of multifamily housing units. Falmouth, Yarmouth,Dennis, Chatham and parts of Barnstable are the "year-round core" of the <strong>Cape</strong>, wherethe population is still significant in the off-season. Meanwhile, Truro, Wellfleet,Eastham, and Brewster are far less densely populated, revealing the seasonal nature oftheir housing stock at present.Even though Census Bureau estimates have shown a decrease in Barnstable Countypopulation since the 2000 Census, housing units have been estimated to have increased.The following figure displays the estimated increase in housing units each year since2000.158,000156,000154,926155,556156,118Estimate Housing Units154,000152,000150,000148,000146,000147,489149,111150,472151,610152,584153,799144,000142,0002000 2001 2002 2003 2004 2005 2006 2007 2008FIGURE 10 - BARNSTABLE COUNTY HOUSING UNIT ESTIMATES 2000 - 2008(Source: U.S. Census)Chapter 1: Goals & Objectives <strong>Cape</strong> <strong>Cod</strong> <strong>Regional</strong> <strong>Transportation</strong> <strong>Plan</strong> | August 2011Page 44
FIGURE 11 - CAPE COD ZONING AND LAND USE PATTERNS1.7.3.2. Seasonal UsesIn a tourist area such as <strong>Cape</strong> <strong>Cod</strong>, lodging units such as hotel and motel rooms also playan important role in regional transportation planning. Seasonal lodging is spread inclusters throughout the <strong>Cape</strong>, including communities such as those in Provincetown,Chatham, Brewster, Harwich, Yarmouth, and Barnstable. There are also significantamounts of seasonal land uses along the south shore of the <strong>Cape</strong>.<strong>Cape</strong> <strong>Cod</strong> <strong>Regional</strong> <strong>Transportation</strong> <strong>Plan</strong> | August 2011Chapter 1: Goals & ObjectivesPage 45
1.7.3.3. Commercial and IndustrialCommercial and industrial land use varies by specific type, although generally they aremore common uses on the Upper <strong>Cape</strong> than elsewhere:Office Uses: Office land uses are concentrated in Orleans, Chatham, Falmouth, Bourne,and the Route 28 corridor from Hyannis to Dennis. To a lesser extent there is also officeuse along Route 132 and Route 6A in Sandwich.Retail Uses: Retail uses are more dispersed, although there is still a concentration alongRoute 28 from Hyannis to Dennis, Route 132 in Hyannis, Route 28 in Bourne, Route 6Ain Orleans, and Route 134 in Dennis.Manufacturing Uses: Manufacturing largely occurs inland from Barnstable to Dennis,and in Falmouth and Bourne. On the whole there is not a large amount of manufacturingon <strong>Cape</strong> <strong>Cod</strong>.Mining: Mining is not widespread on <strong>Cape</strong> <strong>Cod</strong>, although there is some sand and gravelmining in Falmouth, Bourne, and Barnstable.1.7.3.4. Open SpaceFIGURE 12 - NAUSET BAY AND THE CAPE COD NATIONAL SEASHORE IN EASTHAMAt present, a significant percentage of the land on <strong>Cape</strong> <strong>Cod</strong> is devoted to preservation asopen space, recreational land, or public land. In addition, the <strong>Cape</strong> <strong>Cod</strong> NationalChapter 1: Goals & Objectives <strong>Cape</strong> <strong>Cod</strong> <strong>Regional</strong> <strong>Transportation</strong> <strong>Plan</strong> | August 2011Page 46
Seashore on the Lower <strong>Cape</strong> not only preserves a great deal of land in that area, but alsorestricts additional growth on land already developed within its borders.In 1998, the <strong>Cape</strong> <strong>Cod</strong> Land Bank Act was passed, and in the first year nearly 800 acreswere approved for preservation across the region. Most of the parcels are forconservation or passive recreational use but some towns have purchased properties forother purposes such as future water supply well sites and trail links to the <strong>Cape</strong> <strong>Cod</strong>Pathways network.Generally, open space uses are common inland and on the outer <strong>Cape</strong>, while not ascommon on the south shore of the <strong>Cape</strong>. The <strong>Cape</strong> <strong>Cod</strong> Bay and Buzzards Bay shoresfalls somewhere in between. Both transportation and local land use decisions haveplayed a major role in the loss of open space. The one area that appears to suffer from alack of open space uses is the southern shore of the <strong>Cape</strong> from Hyannis to Harwich,where development pressures have been strong. On the rest of the <strong>Cape</strong>, "perceived"open space (undeveloped land as well as protected conservation land) is generally nothard to find, at present. Whether this condition will continue depends on thedevelopment and transportation policies adopted by the region and its towns in thefuture.<strong>Cape</strong> <strong>Cod</strong> <strong>Regional</strong> <strong>Transportation</strong> <strong>Plan</strong> | August 2011Chapter 1: Goals & ObjectivesPage 47
1.7.4 ENVIRONMENTAL JUSTICE LFIGURE 13 - MAP OF ENVIRONMENTAL JUSTICE POPULATIONS ON CAPE CODThe Commonwealth of Massachusetts identifies an area as an Environmental JusticePopulation if their annual median household income is equal to or less than 65 percentof the statewide median or their population is 25 percent minority, foreign born, orlacking English language proficiency.To best serve those with greater transportation needs on <strong>Cape</strong> <strong>Cod</strong>, Commission Staffhas identified the <strong>Cape</strong>’s Environmental Justice Areas. This may allow Commission andlocal staff and officials to target needs and shortfalls within the system, as well as toidentify where the network currently offers adequate options. The figure above showsthese Environmental Justice Areas in relation to bus services on the <strong>Cape</strong>. Assuming a“reasonable walking distance” of one-half mile to access transit, a majority of the <strong>Cape</strong>’sChapter 1: Goals & Objectives <strong>Cape</strong> <strong>Cod</strong> <strong>Regional</strong> <strong>Transportation</strong> <strong>Plan</strong> | August 2011Page 48
Environmental Justice Areas receive transit service. Future expansions to the networkshould consider these areas, currently not served by the existing transit network.1.8 CONCLUSION<strong>Transportation</strong> safety, security, congestion, accessibility, and mobility are all affected bychanges in population, housing, and economics. The remaining chapters will address thevarious modes of transportation available on <strong>Cape</strong> <strong>Cod</strong> as well as sub-regional and localissues. These chapters will focus on the history of <strong>Cape</strong> <strong>Cod</strong> transportation, current andfuture trends, and the accessibility, mobility, and connectivity of the existing system.This information is used to evaluate projects and programs, and to make informedplanning decisions for the future of transportation on <strong>Cape</strong> <strong>Cod</strong>.<strong>Cape</strong> <strong>Cod</strong> <strong>Regional</strong> <strong>Transportation</strong> <strong>Plan</strong> | August 2011Chapter 1: Goals & ObjectivesPage 49
Chapter 1: Goals & Objectives <strong>Cape</strong> <strong>Cod</strong> <strong>Regional</strong> <strong>Transportation</strong> <strong>Plan</strong> | August 2011Page 50
<strong>2012</strong> REGIONAL TRANSPORTATION PLANChapter 2: Existing ConditionsEndorsedAugust 22, 2011
Chapter 2: Table of Contents2.1 – Land Use and the Environment2.2 – Road <strong>Transportation</strong>2.3 – Bus <strong>Transportation</strong>2.4 – Rail <strong>Transportation</strong>2.5 – Water <strong>Transportation</strong>2.6 – Air <strong>Transportation</strong>2.7 – Canal Area <strong>Transportation</strong>2.8 – Sub-Regions<strong>Cape</strong> <strong>Cod</strong> <strong>Regional</strong> <strong>Transportation</strong> <strong>Plan</strong> | August 2011Chapter 2: Existing Conditions
Chapter 2: Existing Conditions <strong>Cape</strong> <strong>Cod</strong> <strong>Regional</strong> <strong>Transportation</strong> <strong>Plan</strong> | August 2011
2.1 LAND USE AND THE ENVIRONMENTThe <strong>Cape</strong> <strong>Cod</strong> Commission has always supported a strong relationship between land use,environmental issues, and transportation planning. This relationship is most evidentwhen consulting the transportation section of the <strong>Regional</strong> Policy <strong>Plan</strong> (RPP) as it relatesto the goals of the <strong>Regional</strong> <strong>Transportation</strong> <strong>Plan</strong> (RTP). The RPP relies heavily on landuse planning and environmental protection in tandem with developing transportationsolutions consistent with the <strong>Cape</strong> <strong>Cod</strong> Commission Act.This section addresses the <strong>Cape</strong>’s land use and environmental issues and includesdiscussion of a growing concern – climate change – and its potential for impact to thetransportation network.2.1.1 LAND USE VISION MAP LThe <strong>Regional</strong> Land Use Vision Map (RLUVM - adopted with the 2009 RPP) expresses avision for the future of <strong>Cape</strong> <strong>Cod</strong>. The <strong>Cape</strong> <strong>Cod</strong> Commission is working collaborativelywith all 15 towns in Barnstable County to develop this vision. The land uses arecategorized as Economic Centers, Villages, Industrial and Service Trade Areas, ResourceProtection Areas, and Other Areas. Towns where the planning board has endorsed thevision map for their community are included on the <strong>Regional</strong> Land Use Vision Map afteradoption by the Barnstable County Assembly of Delegates. The RLUVM is used to tailorminimum performance standards applied to Developments of <strong>Regional</strong> Impact (DRIs)according to planning areas. Adoption of each town’s Land Use Vision Map also allows atown to seek revisions to DRI thresholds based on the land use categories listed inCommission regulations. The intent is to encourage growth and redevelopment inappropriate areas that contain existing or proposed infrastructure – and – to discouragesprawl in more environmentally sensitive areas.Land Use Categories include: Economic Centers – Areas designated as appropriate for growth andredevelopment. These areas serve the region or sub-region and could includecharacteristics such as civic and institutional uses, retail, and mixed use.Economic Centers are defined by parcel data and/or zoning district boundaries,shown in detail on individual town maps. Developments of <strong>Regional</strong> Impact(DRI) proposed within Economic Centers benefit from some reduced minimumperformance standards during DRI review under the RPP. Industrial and Service Trade Areas – Areas designated for industrial uses,construction trades, and/or public works facilities. Areas are intended for usesthat are incompatible with residential and village settings, with a high squarefootage-to-employeeratio. Resource Protection Areas – Areas designated that warrant protection andwhere additional growth is not desired due to the presence of one or moresensitive resources. These resources shall include at a minimum Wellhead<strong>Cape</strong> <strong>Cod</strong> <strong>Regional</strong> <strong>Transportation</strong> <strong>Plan</strong> | August 2011Chapter 2.1: Land Use/EnvironmentPage 55
Protection Areas, Land Subject to Coastal Storm Flowage or Sea, Lake, andOverland Surges by Hurricanes (SLOSH) zones, historic districts, and the <strong>Cape</strong><strong>Cod</strong> National Seashore. Resource Protection Areas may also include but not belimited to wetlands, vernal pools, protected open space, and designated Districtsof Critical <strong>Plan</strong>ning Concern (DCPCs).Villages – Areas designated to preserve historic and/or community character.Consist of small, compact areas with development at a local scale. Characteristicscould include civic uses, mixed use, and/or home occupations.Other – Areas remaining after the other areas have been identified. The landuse category boundaries are based on digital data obtained from MassGIS, ArmyCorps of Engineers, NHESP, and Town GIS Departments, including town-basedzoning and parcel information.The Land Use Vision Map is presented in the following figure. Please consult the <strong>Cape</strong><strong>Cod</strong> Commission website for full explanations of assumptions and to see the latestupdate (June 18, 2010):http://www.capecodcommission.org/RPP/capevision_rpp_amend10.pdfLink for <strong>Cape</strong> <strong>Cod</strong> Commission regional mapshttp://www.capecodcommission.org/GIS/regionalmaps.htmChapter 2.1: Land Use/Environment <strong>Cape</strong> <strong>Cod</strong> <strong>Regional</strong> <strong>Transportation</strong> <strong>Plan</strong> | August 2011Page 56
FIGURE 1 - LAND USE VISION MAP<strong>Cape</strong> <strong>Cod</strong> <strong>Regional</strong> <strong>Transportation</strong> <strong>Plan</strong> | August 2011Chapter 2.1: Land Use/EnvironmentPage 57
2.1.2 LAND USES ALONG MAJOR ROADWAYSOf the major roadway corridors of Barnstable County, existing land use varies by thecharacteristics of the town or sub-region as well as along each corridor. The followingincludes a summary of these characteristics.Route 6:Adjacent land uses vary by location. In the limited access sections of the road there issome residential development and some industrial development along the corridor. Inthe sections with curb cuts there is more commercial development, including retailactivity.In addition to being the main thoroughfare for the <strong>Cape</strong> as a whole, it also is the “MainStreet” of several <strong>Cape</strong> towns. Buzzards Bay, Eastham, and to a lesser degree, Truro andWellfleet, all use Route 6 as a downtown thoroughfare. This dual purpose for the roadhas created some conflicts for this corridor.Route 28:Land use along Route 28 may vary to a greater extent than any other roadway on <strong>Cape</strong><strong>Cod</strong>. Sections between Chatham and Orleans for example are lightly settled with scenicvistas of Pleasant Bay. In the Upper <strong>Cape</strong>, Route 28’s MacArthur Boulevard is nearly afreeway with the undeveloped Massachusetts Military Reservation to the east andsprawling commercial enterprises along the west. Route 28 serves as a Main Street tonumerous villages such as Falmouth, Dennisport, Harwichport or Chatham, where closeto-the-streetbusiness and residences are complemented by the lower travel speed of theroad. In the Mid-<strong>Cape</strong> towns of Barnstable and Yarmouth, much of Route 28 iscongested due to high traffic demands and frequent curb-cuts for the many businessestaking advantage of the proximity to drive-by customers.Route 6A:Typical commercial uses include inns, motels, and cottages, restaurants, antique shops,galleries, gift shops, services such as gas stations, banks, small markets, and smallprofessional offices. Residential uses, including home occupations, mixed withchurches, municipal buildings, and open land, continue to dominate the rest of theroadway. Over 3,350 acres of vacant developable land is located within the Route 6Acorridor, most of it zoned for residential use. Development of vacant parcels that abutthe roadway or are located within or adjacent to historic resource areas and scenicviewsheds could diminish the distinctive character. Several village centers exist alongthe corridor, such as Barnstable Village, Yarmouthport, and Brewster. Several “newvillages” have also sprung up as strip development in the last 20 years, such as thedevelopment in Orleans. In addition, Sandwich Center lies just off 6A to the south.Chapter 2.1: Land Use/Environment <strong>Cape</strong> <strong>Cod</strong> <strong>Regional</strong> <strong>Transportation</strong> <strong>Plan</strong> | August 2011Page 58
Much of the corridor remains residential, or is undeveloped due to the proximity ofwetlands with Sandwich and Orleans the notable exceptions. Bike travel along thecorridor is common despite the fact that it is best suited for experienced bicyclists. Thisis due to the narrow lane widths and lack of shoulders, scenic nature of the corridor, andresidential and commercial development.2.1.3 CONTEXT SENSITIVE DESIGNTo address transportation problems with infrastructure solutions, the Federal HighwayAdministration recommends that we “…develop a transportation facility that fits itsphysical setting and preserves scenic, aesthetic, historic and environmental resources,while maintaining safety and mobility.” The concept of Context-Sensitive Design has astrong influence on design criteria for transportation projects as will be evident in theAlternatives Analysis Chapter of this RTP.FIGURE 2 - A CAPE COD SCENE2.1.4 CAPE COD ENVIRONMENTAL RESOURCES<strong>Cape</strong> <strong>Cod</strong> is rich in environmental features that both deserve and are required by statuteto be protected. Land use planning, transportation planning, and many other relatedefforts are influenced by, and have an influence on the environmental resources of <strong>Cape</strong><strong>Cod</strong>. The following figure shows a number of these features including:Wellhead Protection AreasVernal Pool BuffersWater BodiesPond Shore Buffers<strong>Cape</strong> <strong>Cod</strong> <strong>Regional</strong> <strong>Transportation</strong> <strong>Plan</strong> | August 2011Chapter 2.1: Land Use/EnvironmentPage 59
Potential Public Water Supply AreaHabitatsWetlandsFor reference, major roads and town boundaries are displayed as well.FIGURE 3 - CAPE COD SIGNIFICANT NATURAL RESOURCE AREASSource from the <strong>Cape</strong> <strong>Cod</strong> Commission:http://www.capecodcommission.org/RPP/CCSNR_08RPP0609amend0610.pdfLink for <strong>Cape</strong> <strong>Cod</strong> Commission regional maps:http://www.capecodcommission.org/GIS/regionalmaps.htmChapter 2.1: Land Use/Environment <strong>Cape</strong> <strong>Cod</strong> <strong>Regional</strong> <strong>Transportation</strong> <strong>Plan</strong> | August 2011Page 60
The <strong>Cape</strong> <strong>Cod</strong> Commission’s Geographic Information System department and NaturalResources’ staff have developed an interactive mapping technique that can be used inassessing the proximity of planned infrastructure (e.g., road improvements) and thevarious geographic layers of natural resource information. This tool will be of increasingusefulness in minimizing impacts to natural resources in the advanced planning stage oftransportation projects. This effort will result in an interactive online application thatwill allow the public to review transportation projects in the context of any naturalresource of interest.2.1.5 STORMWATER MANAGMENT<strong>Cape</strong> <strong>Cod</strong> hosts nearly 1,000 ponds and lakes. Of the 57 watersheds draining into the<strong>Cape</strong>’s coastal embayments, 46 have been identified by the U.S. EnvironmentalProtection Agency as being “nitrogen-sensitive,” of which half are currently subject toTotal Maximum daily LoadsThe issue of stormwater runoff was first addressed at the national level in Phase I of theEPA’s stormwater program in 1990. Phase I required permit coverage under theNational Pollutant Discharge Elimination System (NPDES). Those required to apply forpermits included municipal separate sewer systems that serve populations ofapproximately 100,000 people or more, and construction activity disturbing 5 or moreacres of land.“Storm Water Phase II Final Rule” is the EPA’s next step in addressing stormwaterrunoff pollution. Phase II expands upon those required to hold permits under Phase I toinclude all of the towns on <strong>Cape</strong> <strong>Cod</strong> except Provincetown, Wellfleet and Truro becausethey are considered to be "operators of MS4s (municipal separate storm sewer systems)in urbanized areas." Phase II also applies to operators of small constructions sites thatdisturb between 1 and 5 acres of land, and ten categories of industrial activity.Phase II is anticipated to further reduce adverse impacts to water quality and aquatichabitat by controlling the unregulated sources of storm water discharges that hold thegreatest likelihood of significantly contributing to stormwater pollution.2.1.6 CLIMATE CHANGEClimate change is a shift in temperature, precipitation, wind and other long-termweather patterns. According to the Massachusetts Department of EnvironmentalProtection, there is broad scientific consensus that our climate is changing - bothregionally and globally - largely due to the combustion of fossil fuels and other humanactivities that increase atmospheric concentrations of greenhouse gases, namely carbondioxide (CO2), methane (CH4) and nitrous oxide (N2O).Almost all (97%) greenhouse gas emissions in Massachusetts consist of carbon dioxidereleased in fossil fuel combustion. According to data from the US Energy Information<strong>Cape</strong> <strong>Cod</strong> <strong>Regional</strong> <strong>Transportation</strong> <strong>Plan</strong> | August 2011Chapter 2.1: Land Use/EnvironmentPage 61
Administration compiled by Environment Massachusetts, 30% of these energy-relatedC02 emissions were generated by the transportation sector. Between 1990 and 2004,estimated C02 emissions from the transportation sector in Massachusetts increased 16%,while those due to gasoline consumption increased even faster, rising 19% from 1990 to2004 (according to the Boston Indicators Project). Rising greenhouse gas emissionsfrom motor vehicles pose a major challenge to the state’s ability to meet its goal ofreducing greenhouse gas emissions below 1990 levels, as required by the GlobalWarming Solutions Act (2008). Strategies focused on VMT reduction, fuel-efficientfleets, and implementing Transit Oriented Development and are critical in meeting thesegoals.The Commission is currently participating in a federal Interagency Climate ChangeScenario <strong>Plan</strong>ning Pilot Project. Commission staff assist in bringing together multiplefederal agencies and local stakeholders to work toward a shared and practical futuredevelopment strategy. The strategy will plan for climate change impacts intransportation and land use decision-making while at the same time reducing theregion’s green house gas (GHG) emissions. A scenario planning process will be used todevelop the most desirable development strategy.Another tool in mitigating potential impacts of Climate Change is the integration of landuse planning with transportation planning via the Land Use Vision Mapping (LUVM)efforts. LUVM results are intended to reinforce Transit-Oriented Development andother forms of compact development patterns, thereby reducing VMT (and resultingclimate-changing emissions). Conversely, my melding SLOSH/A&V zones in designatingResource Protection Areas, development is discouraged in locating in such areas.Chapter 2.1: Land Use/Environment <strong>Cape</strong> <strong>Cod</strong> <strong>Regional</strong> <strong>Transportation</strong> <strong>Plan</strong> | August 2011Page 62
FIGURE 4 - POTENTIAL EFFECTS OF SEA-LEVEL RISE(Source: www.civilsocietyinstitute.org)The blue colored areas shown in the figure above are a graphic illustration of thepotential effects of sea-level rise on the low-lying regions of <strong>Cape</strong> <strong>Cod</strong>. The longer-termeffect of sea-level rise permanently disabling important portions of the transportationnetwork is a major cause for concern. In the nearer future, increased weather-basedthreats from storm surge, flooding, and hurricane wind damage highlight thevulnerability of our transportation system.The <strong>Cape</strong> <strong>Cod</strong> MPO is committed to implementing transportation strategies that willhelp reduce fossil fuel energy and GHG emissions. The <strong>Cape</strong> <strong>Cod</strong> MPO’s RTP updatedemonstrates a commitment to a transportation system that supports environmentalquality and Smart Growth strategies.To address climate change on <strong>Cape</strong> <strong>Cod</strong>, the following categories of recommendationsare proposed to address causes, improve efficiencies, and strategically protect or<strong>Cape</strong> <strong>Cod</strong> <strong>Regional</strong> <strong>Transportation</strong> <strong>Plan</strong> | August 2011Chapter 2.1: Land Use/EnvironmentPage 63
construct critical infrastructure to resist the effects of weather-based events and sea-levelrise.Smarter Fleets & Fuels: Reduction of Greenhouse GasesClean fuels and efficient vehicles can result in significant reductions in GHG production.The <strong>Cape</strong> <strong>Cod</strong> Commission continues to encourage the development of fuelinginfrastructure for bio-diesel. Biofuels are derived from plant matter that absorbs CO2 intheir growth process. This CO2 is sequestered in the biofuel and released when it isburned returning the original CO2 (green house gas) from the plant matter to theatmosphere. Unfortunately, usually energy is expended in the harvesting andproduction processes that may have been from petroleum. One of the promising sourcesof feedstock is algae. Using wastewater as a feedstock and free sunlight for theproduction, algae may be the <strong>Cape</strong>’s closest thing to “free lunch fuel” that doesn’tcompete against other food sources (e.g., corn-based ethanol). Currently, biodiesel isavailable to <strong>Cape</strong> <strong>Cod</strong> towns through Barnstable County’s procurement process.Efficient vehicles means less emissions from whatever fuel is being used. Through apartnership with the <strong>Cape</strong> <strong>Cod</strong> <strong>Regional</strong> Transit Authority, the <strong>Cape</strong> <strong>Cod</strong> MPO has andwill continue to support the purchase of fuel-efficient and alternative-fuel vehicles whenprocuring new or replacement buses.Smarter Management: Shortening Trips and Avoiding Congestion LThe <strong>Cape</strong> <strong>Cod</strong> Commission continues to encourage smarter land use patterns throughthe <strong>Cape</strong> <strong>Cod</strong> <strong>Regional</strong> Policy <strong>Plan</strong>. By encourage mixed-use and transit-orienteddevelopment, and discouraging sprawl, travelers are afforded shorter commute distancesor convenient access to commercial areas and municipal services thus reducing vehicletravel distance. Even more beneficial are the trips that can be made by public transit,bicycling, or walking.See:www.capecodcommission.org/RPPThe continued deployment of intelligent transportation systems will provide travelerswith the tools to avoid congestion. Tailpipe emissions of idling vehicles represent theworst case scenario of air pollution.See:www.gocapecod.org/congestionChapter 2.1: Land Use/Environment <strong>Cape</strong> <strong>Cod</strong> <strong>Regional</strong> <strong>Transportation</strong> <strong>Plan</strong> | August 2011Page 64
Smarter Infrastructure: Location & ProtectionConstruction of new transportation infrastructure in an area threatened by sea-level riseis probably the least desirable strategy. Notwithstanding the expense of repairing stormdamagedroadways following an initial event, there is reason to believe that future eventswould occur with ever-increasing probability. In effect, we would be “shoveling againstthe tide.”A recommended action is to perform an analysis of the transportation infrastructurelocated in threatened areas. This information will help identify needed upgrades (e.g.,raising roadbeds, retaining walls, etc.) and guide new infrastructure away fromthreatened areas.2.1.7 DOCUMENTING GREENHOUSE GAS EMISSIONS REDUCTION FORGREENDOT IMPLEMENTATIONMassDOT, using its statewide travel demand model, has provided the <strong>Cape</strong> <strong>Cod</strong> MPOwith statewide estimates of CO2 emissions resulting from the collective list of allrecommended projects in all the Massachusetts RTPs combined. Emissions areestimated in the same way as the criteria pollutants (volatile organic compounds,nitrogen oxides, and carbon monoxide) whose emissions are required for the air qualityconformity determination (for further description, see Appendix-Air QualityConformity. However, the CO2 emissions shown here are part of an effort separate fromthe conformity analysis and are not part of those federal standards and reportingrequirements.The Global Warming Solutions Act (GWSA) legislation requires reductions by 2020 andfurther reductions by 2050, relative to the 1990 baseline. The project mix from this RTP(and all other RTPs) was modeled for both 2020 and 2035 using an Action (Build) vs.Baseline (No-Build) analysis to determine the CO2 emissions attributed to the all MPO’smix of projects and smart-growth land use assumptions. The estimates of the modeledCO2 emissions are provided below:TABLE 1: MASSACHUSETTS STATEWIDE CO2 EMISSIONS ESTIMATESYearCO2Action EmissionsCO2Base EmissionsDifference(Action – Base)2010 101,514.4 101,514.4 n/a2020 105,747.5 105,856.4 -108.92035 115,034.1 115,028.0 6.1(All emissions in tons per summer day)<strong>Cape</strong> <strong>Cod</strong> <strong>Regional</strong> <strong>Transportation</strong> <strong>Plan</strong> | August 2011Chapter 2.1: Land Use/EnvironmentPage 65
As shown above, collectively, all the projects in the RTPs in the 2020 Action scenarioprovide a statewide reduction of nearly 109 tons of CO2 per day compared to the basecase. However, the 2035 Action scenario estimates an increase of about 6 tons of CO2emissions compared to the base case. It should be noted that this current analysismeasures only projects that are included in the travel demand model. Many other typesof projects that cannot be accounted for in the model (such as bicycle and pedestrianfacilities, shuttle services, intersection improvements, etc.) will be further analyzed forCO2 reductions in the next <strong>Transportation</strong> Improvement Program development cycle.This information will be updated and reported at that time.Working closely with MassDOT, the <strong>Cape</strong> <strong>Cod</strong> MPO will continue to report on its actionsto comply with the GWSA and to help meet the GHG reductions targets. As part of thisactivity, the MPO will provide further public information on the topic and will advocatefor steps needed to accomplish the MPO’s and state’s goals for greenhouse gasreductions.2.1.8 CONCLUSIONWhen planning for the <strong>Cape</strong>’s future transportation system, we ignore the environmentat our peril. By focusing on a combination of (1) a thorough understanding of thelocation and importance of the <strong>Cape</strong>’s environmental resources with, (2) a vision of landuse that mitigates impacts to the environment with efficiencies in location such astransit-oriented-development, the RTP will be instrumental in developing atransportation system that maximizes efficiency while addressing the sensitivity of <strong>Cape</strong><strong>Cod</strong>’s context.Chapter 2.1: Land Use/Environment <strong>Cape</strong> <strong>Cod</strong> <strong>Regional</strong> <strong>Transportation</strong> <strong>Plan</strong> | August 2011Page 66
2.2 ROAD TRANSPORTATIONRoads are an important component of any discussion on <strong>Cape</strong> <strong>Cod</strong> transportation. Theword “road” is derived from the word “ride” and refers to any surface that has beenprepared to make travel easier. For example, a road may have trees removed, surfacesleveled, or pavement laid down. A “right-of-way” is the linear property in whichindividuals or entities are granted the right to travel. Roads and other transportationinfrastructure are generally located within a right-of-way.Most of <strong>Cape</strong> <strong>Cod</strong> is connected by roadways. This section will address issues relating tothe roads of <strong>Cape</strong> <strong>Cod</strong>. The purpose will be to account for the existing infrastructure ofand demands on <strong>Cape</strong> <strong>Cod</strong>’s roadways.2.2.1 THE “AVERAGE” CAPE COD ROADFIGURE 1 - THE AVERAGE CAPE COD ROADThere are about 3,900 miles of road on <strong>Cape</strong> <strong>Cod</strong>. The “Average <strong>Cape</strong> <strong>Cod</strong> Road” is atwo-lane road surrounded by woods or houses. According to the MassDOT Roadwayinventory, of paved roads on <strong>Cape</strong> <strong>Cod</strong>, the mean pavement width is 21.1 feet and a lanewidth of 10.9 feet. For all roads, the average right of way is 40.9 feet wide.<strong>Cape</strong> <strong>Cod</strong> <strong>Regional</strong> <strong>Transportation</strong> <strong>Plan</strong> | August 2011Chapter 2.2: RoadwaysPage 67
2.2.2 ROAD INFRASTRUCTURE<strong>Cape</strong> <strong>Cod</strong>’s three major routes, Route 6, Route 28, and Route 6A, comprise only 5.7% of<strong>Cape</strong> <strong>Cod</strong>’s roads by mileage. The majority (78.1%) of <strong>Cape</strong> <strong>Cod</strong> roads are designated asFunctional Class “0,” or local roads. 6.2% of roads are classified as minor or major“Collector” roadways. This means that just over two-tenths of <strong>Cape</strong> <strong>Cod</strong>’s roadways areused as primary routes of travel, while the remaining nearly eight-tenths are used toaccess residential and other private areas. There are no interstate highways on <strong>Cape</strong> <strong>Cod</strong>.FIGURE 2: FUNCTIONAL CLASSIFICATIONSource: Massachusetts Roadway Inventory File 2008TABLE 1 - ROAD MILEAGE BY FUNCTIONAL CLASSInterstate Local Arterial Collector Total0 0% 3,018.7 78.1% 608.5 15.7% 238.9 6.2% 3,866.1Source: Massachusetts Roadway Inventory File 2008Chapter 2.2: Roadways <strong>Cape</strong> <strong>Cod</strong> <strong>Regional</strong> <strong>Transportation</strong> <strong>Plan</strong> | August 2011Page 68
FIGURE 3 - ROADWAY INFRASTRUCTURESource: Massachusetts Roadway Inventory File 2008All limited-access highways south/east of the <strong>Cape</strong> <strong>Cod</strong> Canal bridges are portions ofeither Route 6 or Route 28. The only limited-access portions of Route 28 are located inBourne and Falmouth. Most of Route 28 (MacArthur Boulevard) in Bourne is partialaccesscontrol with sporadic opportunities to change direction in U-turn lanes. The vastmajority of <strong>Cape</strong> <strong>Cod</strong>’s roads do not have access control.Towns in the Mid- and Upper-<strong>Cape</strong> have more road mileage than other towns on <strong>Cape</strong><strong>Cod</strong>. Barnstable and Falmouth have the most road mileage in the county, with 647.8 and474.3 miles, respectively. The Lower and Outer-<strong>Cape</strong> towns have the fewest road miles.Chatham, Orleans, Eastham, Wellfleet, Truro and Provincetown all have 140 miles ofroad or less. A smaller population and large amounts of protected land are likely factorsin the lesser road mileage.Looking at who owns <strong>Cape</strong> <strong>Cod</strong>’s roadways, 44.0% of <strong>Cape</strong> <strong>Cod</strong>’s roadways by mileageare owned by local towns. MassDOT also owns a significant 285.8 miles of roadway(7.3%), consisting of most of Route 6, Route 28, Route 6A, and portions of othernumbered routes and major roadways. Bourne has the most miles of road owned byMassDOT. These 50.5 miles of road consist of Route 6, Route 28, and the <strong>Cape</strong> <strong>Cod</strong><strong>Cape</strong> <strong>Cod</strong> <strong>Regional</strong> <strong>Transportation</strong> <strong>Plan</strong> | August 2011Chapter 2.2: RoadwaysPage 69
Canal area transportation network. Provincetown has the least amount of roadwayowned by MassDOT, with less than three miles. The majority of federally ownedroadway is located in Bourne and Sandwich, mostly due to the Massachusetts MilitaryReservation. The only Barnstable County-owned roadway is located at the CountyComplex in Barnstable Village. Roadway ownership is important because any roadwaychanges need to be approved by the roadway owners.FIGURE 4 - OWNERSHIP OF CAPE COD’S ROADWAYSSource: Massachusetts Roadway Inventory File 2008The following table identifies road ownership on <strong>Cape</strong> <strong>Cod</strong> by town. Discrepancies withtotal road mileage from any section of this chapter are a result of differences in rounding.Chapter 2.2: Roadways <strong>Cape</strong> <strong>Cod</strong> <strong>Regional</strong> <strong>Transportation</strong> <strong>Plan</strong> | August 2011Page 70
TABLE 2 - ROAD MILEAGE BY JURISDICTIONTown MassDOTTownAcceptedCounty&OtherState FederalUnacceptedn/a TotalBarnstable 42.2 354.5 0.5 70.3 180.3 647.8Bourne 50.5 96.3 0.1 25.7 40.1 175.2 387.9Brewster 12.5 58.1 10.9 90.6 38.7 210.8Chatham 7.4 66.8 41.3 24.9 140.4Dennis 14.7 147.2 58.2 54.3 274.4Eastham 6.7 51.6 4.6 42.4 32.5 137.8Falmouth 35.2 219.7 105.5 113.9 474.3Harwich 15.2 143.1 16.4 45.8 220.5Mashpee 4.0 118.2 0.1 3.0 10.0 92.6 227.9Orleans 12.2 52.3 0.9 34.8 36.1 136.3Provincetown n/a* 15.2 8.0 6.0 38.4 79.0Sandwich 28.6 153.0 1.2 27.4 23.7 135.1 369.0Truro 11.8 38.4 0.3 0.5 11.4 74.2 136.6Wellfleet 8.3 55.2 1.5 4.4 2.7 63.3 135.4Yarmouth 25.1 152.8 101.4 56.3 335.6Total 285.8 1722.4 15.5 73.6 654.8 1161.6 3913.7* Since the 2008 Road Inventory Network was created, MassDOT has relinquished ownershipof Route 6 in Provincetown to the town.Source: Massachusetts Roadway Inventory File 2008There are thousands of roadway intersections across <strong>Cape</strong> <strong>Cod</strong>. Of these intersections,114 are signalized and 24 are circular. Circular intersections refer to rotaries androundabouts. Rotaries tend to be larger in diameter, and their interior travel speed isoften faster than a modern roundabout. Roundabouts are identified by smallerdiameters and approaches that enter at a greater angle than rotaries – encouragingslower speeds. Barnstable has 36 traffic signals, which is the most of any town on <strong>Cape</strong><strong>Cod</strong>. Barnstable and Bourne have 4 circular intersections each, the most of any <strong>Cape</strong><strong>Cod</strong> town. Both Truro and Brewster have no traffic signals or traffic circles (the trafficsignals installed at the Route 124/Route 137 intersection are set to flashing mode –effectively making four-way stop control). Maintaining intersection controls isimportant to ensure safety, especially at busy intersections.<strong>Cape</strong> <strong>Cod</strong> <strong>Regional</strong> <strong>Transportation</strong> <strong>Plan</strong> | August 2011Chapter 2.2: RoadwaysPage 71
TABLE 3 - INTERSECTION TYPETotalYarmouthWellfleetTruroSandwichProvincetownOrleansMashpeeHarwichFalmouthEasthamDennisChathamBrewsterBourneBarnstableTownSignal 36 9 1 2 9 4 11 3 6 6 1 6 0 3 17 114Circle 4 4 0 1 1 1 2 1 3 0 1 3 0 0 3 24Source: <strong>Cape</strong> <strong>Cod</strong> CommissionFIGURE 5 - ROADWAY INTERSECTIONS – TRAFFIC CONTROLSource: <strong>Cape</strong> <strong>Cod</strong> CommissionChapter 2.2: Roadways <strong>Cape</strong> <strong>Cod</strong> <strong>Regional</strong> <strong>Transportation</strong> <strong>Plan</strong> | August 2011Page 72
2.2.3 SPEED LIMITSThe maximum legal speed limit on most <strong>Cape</strong> <strong>Cod</strong> highways is 55 mph. Exceptionsinclude Route 3 (60 mph) and Route 25 (65 mph) in Bourne.FIGURE 6 - SPEED LIMITS ON CAPE COD ROADWAYSSource: Massachusetts Roadway Inventory File 2008<strong>Cape</strong> <strong>Cod</strong> <strong>Regional</strong> <strong>Transportation</strong> <strong>Plan</strong> | August 2011Chapter 2.2: RoadwaysPage 73
2.2.4 ROADWAY VOLUMES1998-2008 was the first decade since the <strong>Cape</strong> <strong>Cod</strong> Commission has been countingtraffic to experience an overall negative traffic growth. During this ten-year period,traffic volumes decreased by 4.6%. Although the ten-year period from 1999-2009 alsoexperienced traffic volume decline (9.1%), there was positive growth from 2008 to 2009.Between 2008 and 2009, traffic increased by 4.5%.Not all road volumes were decreasing during the 1999-2009 decade, though. Mainthoroughfares on <strong>Cape</strong> <strong>Cod</strong> appeared to be staying fairly level or increasing while localroads were showing decreases. The Massachusetts Department of <strong>Transportation</strong>(MassDOT) maintains six permanent counter locations on or near <strong>Cape</strong> <strong>Cod</strong> on some ofthe more heavily trafficked roads. The following table displays those six locations withtheir ten-year growth, ten-year average annual growth, and one-year growth rate (2008-2009).TABLE 4: PERMANENT COUNTING STATION SUMMER TRAFFIC GROWTH (1999-2009)Permanent TrafficCounting Station10 YearTotalGrowth10 YearAverageAnnualGrowth RateOne YearGrowth Rate2008-2009#15: Route 6 E of 149 (Exit 5) -1.07% -.11% 4.06%#20: Route 3 N of Bourne TL 10.63% 1.01% 2.77%#707: Bourne Bridge -1.99% -0.20% 4.57%#708: Sagamore Bridge -1.46% -0.15% 2.06%#709: Route 28 E of HigginsCrowell -13.28% -1.42% -0.55%#7351: Route 28 W of Old Post Rd. -4.39%* -0.75%* 1.93%All MHD Stations -0.80%** -0.08%** 2.47Source: 2009 <strong>Cape</strong> <strong>Cod</strong> Traffic Counting ReportWith the exception of Permanent Counter #709, traffic volumes showed minimaldecline. Counter #20 was the only site to have positive growth since 1999, with over 10%more traffic.When including all <strong>Cape</strong> <strong>Cod</strong> roads in the analysis, no region in the county experiencepositive growth between 1999 and 2009. The following table exhibits the ten-yearnegative traffic growth for each region on <strong>Cape</strong> <strong>Cod</strong>.Chapter 2.2: Roadways <strong>Cape</strong> <strong>Cod</strong> <strong>Regional</strong> <strong>Transportation</strong> <strong>Plan</strong> | August 2011Page 74
TABLE 5 - CAPE COD SUMMER TRAFFIC GROWTH (1999-2009)10 Year AverageNumber of 10 Year TotalRegionAnnualComparisons GrowthGrowth RateUpper <strong>Cape</strong> 112 -5.99% -0.62%Mid-<strong>Cape</strong> 86 -10.35% -1.09%Lower <strong>Cape</strong> 76 -11.87% -1.26%Outer <strong>Cape</strong> 56 -13.74% -1.47%All Roads 330 -9.05% -0.95%“Upper” = Bourne, Sandwich, Falmouth, Mashpee“Mid” = Barnstable, Yarmouth, Dennis“Lower” = Harwich, Chatham, Brewster, Orleans“Outer” = Eastham, Wellfleet, Truro, ProvincetownSource: 2009 <strong>Cape</strong> <strong>Cod</strong> Traffic Counting ReportWhen analyzing traffic growth by region, it appears that traffic has experienced the leastdecline near the bridges, and the most decline furthest from the mainland. The followingfigure depicts the average annual decline in traffic for each region of <strong>Cape</strong> <strong>Cod</strong>.FIGURE 7: AVERAGE ANNUAL GROWTH RATE % (1999-2009)Source: 2009 <strong>Cape</strong> <strong>Cod</strong> Traffic Counting Report<strong>Cape</strong> <strong>Cod</strong> <strong>Regional</strong> <strong>Transportation</strong> <strong>Plan</strong> | August 2011Chapter 2.2: RoadwaysPage 75
At most traffic counting locations, year-round average daily traffic is estimated usingMassDOT Adjustment Factors in combination with summer traffic counts. Theseadjustment factors are calculated based on continuous traffic counts from MassDOTpermanent counters. The <strong>Cape</strong> <strong>Cod</strong> MPO has advocated for an expansion of permanentcounting stations into more areas of <strong>Cape</strong> <strong>Cod</strong> in several editions of the RTP.The following figure shows year-round average daily traffic volumes on major <strong>Cape</strong> <strong>Cod</strong>roads. Heaviest travel occurs on the <strong>Cape</strong> <strong>Cod</strong> Canal road and canal bridges and theMid-<strong>Cape</strong> Highway.FIGURE 8 –YEAR-ROUND AVERAGE DAILY ROADWAY VOLUMESSource: MassHighway Road Inventory 2008Chapter 2.2: Roadways <strong>Cape</strong> <strong>Cod</strong> <strong>Regional</strong> <strong>Transportation</strong> <strong>Plan</strong> | August 2011Page 76
2.2.5 LEVEL OF SERVICELevel of Service is determined by dividing the volume of the roadway by its capacity. Theresulting figure represents at what percentage of capacity a roadway is operating.Various ranges of the volume-to-capacity ratio are categorized into letter scores. Level ofService A is the best, while level of Service F is the worst (see following table).TABLE 6 - LEVEL OF SERVICE DEFINITIONSLevel ofServiceVolume-to-Capacity RatioA 0.00 – 0.60B 0.61 – 0.70C 0.71 – 0.80D 0.81 – 0.90E 0.91 – 1.00InterpretationLow volumes; primarily free-flowing operations. Density islow, and vehicles can freely maneuver within the trafficstream. Drivers can maintain their desired speeds with littleor no delay.Stable flow with potential for some restriction of operatingspeeds due to traffic conditions. Maneuvering is only slightlyrestricted. The stopped delays are not bothersome, anddrivers are not subject to appreciable tension.Stable operations; however, the ability to maneuver is morerestricted by the increase in traffic volumes. Relativelysatisfactory operating speeds prevail, but adverse signalcoordination or longer queues cause delays.Approaching unstable traffic flow, where small increases involume could cause substantial delays. Most drivers arerestricted in their ability to maneuver and in their selectionof travel speeds. Comfort and convenience are low buttolerable.Operations characterized by significant approach delays andaverage travel speeds of one-half to one-third the free flowspeed. Flow is unstable and potential for stoppages of briefduration.F 1.01+Forced-flow operations with high approach delays at criticalsignalized intersections. Speeds are reduced substantially,and stoppages may occur for short or long periods of timebecause of downstream congestion.Source: Highway Capacity ManualThe <strong>Cape</strong> <strong>Cod</strong> Travel Demand Model can be used to estimate the level of service of <strong>Cape</strong><strong>Cod</strong>’s major roadways. Currently, this model is still under development. Preliminaryresults of the model are shown in the following two figures. The first figure shows<strong>Cape</strong> <strong>Cod</strong> <strong>Regional</strong> <strong>Transportation</strong> <strong>Plan</strong> | August 2011Chapter 2.2: RoadwaysPage 77
estimated traffic volumes, the second figure shows estimated Level of Service. Bothfigures represent current average summer p.m. peak hour conditions:FIGURE 9 - ESTIMATED 2006 TRAFFIC FLOWSChapter 2.2: Roadways <strong>Cape</strong> <strong>Cod</strong> <strong>Regional</strong> <strong>Transportation</strong> <strong>Plan</strong> | August 2011Page 78
FIGURE 10 - ESTIMATED ROADWAY LEVEL OF SERVICE<strong>Cape</strong> <strong>Cod</strong> <strong>Regional</strong> <strong>Transportation</strong> <strong>Plan</strong> | August 2011Chapter 2.2: RoadwaysPage 79
2.2.6 PAVEMENT MANAGEMENTThe pavement management process is conducted with the intent to keep the roadwaysystem in the best possible condition with the most efficient use of available funds.There are distinct advantages to managing pavement condition and significant costsavings that can take place with preventative or rehabilitation measures rather thanwaiting until a road is in need of reconstruction. The goal of the pavement managementprocess is for all federal aid-eligible roads to be maintained in “excellent” condition.To understand the condition of the regional roadway system, it is necessary to evaluateexisting conditions with on-site data collection. Sophisticated programs use specializedvehicles with automated detectors to collect data. A more common, and less expensive,method is a visual “window survey” conducted by an individual trained in pavementcondition evaluation. As seen on the following table, the <strong>Cape</strong> <strong>Cod</strong> Region possesses738.98 miles of roadway eligible for federal funding. Of those miles, 541.19 are underthe jurisdiction of the <strong>Cape</strong>’s local communities.As seen in the above table, MassDOT evaluated 85.25 miles of <strong>Cape</strong> <strong>Cod</strong>’s federal aideligible roads under municipal jurisdiction for pavement condition. 22.51 of those milesare in “excellent” condition, almost 30 miles are in “good” condition, 22.47 miles are in“fair” condition, and about 12 miles of evaluated roads are in “poor” condition. Thefollowing chart below depicts the breakdown of road conditions for those 85.25 miles ofroadways under municipal jurisdiction that have been evaluated.Chapter 2.2: Roadways <strong>Cape</strong> <strong>Cod</strong> <strong>Regional</strong> <strong>Transportation</strong> <strong>Plan</strong> | August 2011Page 80
MassDOT evaluates roads under their own jurisdiction and a selection of municipallyownedroadways. The following map identifies the 85.25 miles of roadways that havebeen evaluated (shown in red) and the 455.94 miles that lack evaluation (shown in blue).FIGURE 11 - PAVEMENT CONDITIONElsewhere in the Commonwealth, several <strong>Regional</strong> <strong>Plan</strong>ning Agencies have a morecomprehensive Pavement Management System, where they have 100% (or near 100%) offederal aid eligible roads evaluated. With all roads assessed, they have been able togenerate a cost estimate to improve all roads within the system.Based on costs estimated by the Old Colony <strong>Plan</strong>ning Council, improving a “Good” roadto “Excellent” requires $40,400 per mile; improving from “Fair” requires $405,146 permile; and improving from “Poor” requires $697,980 per mile. Improving all of <strong>Cape</strong><strong>Cod</strong>’s municipally-owned Federal-Aid roadways to “Excellent” requires $118,944,832.While “Excellent” pavement is the ultimate goal of the MPO, this figure is well in excessof the financial constraints outlined in this RTP.A strategy is required to responsibly allocate available funding to maintaining andimproving pavement condition on <strong>Cape</strong> <strong>Cod</strong>. As can be observed by the costs listed<strong>Cape</strong> <strong>Cod</strong> <strong>Regional</strong> <strong>Transportation</strong> <strong>Plan</strong> | August 2011Chapter 2.2: RoadwaysPage 81
above, allowing pavement to deteriorate to the lowest condition requires a significantlymagnified cost to improve. To get closer to the MPO’s ultimate goal, resources spent onimproving “Fair” pavement would result in far more miles of resulting “Excellent”pavement than directing resources to “Poor” pavement. Nevertheless, “Poor” pavementcannot be ignored. Therefore, the strategy of this RTP is to evenly divide investmentacross the lower two categories. Based on expected resources identified in this RTP, thefollowing table lists the resulting totals of each category:TABLE 7 – CHANGE IN PAVEMENT CONDITION – IMPROVEMENT STRATEGYPavementConditionBasePercentBaseMilesImprovementCostMilesImprovedNewMilesNewPercentExcellent 26.40% 142.87 - 183.32 33.87%Good 32.96% 178.38 - 178.38 32.96%Fair 26.36% 142.66 $ 10,367,772 25.59 117.07 21.63%Poor 14.28% 77.28 $ 10,367,772 14.85 62.43 11.54%Totals 100.00% 541.19 $ 20,735,545 40.44 541.19 100%Implementation of this strategy results in overall improvement of pavement quality. Thepercentage of “Excellent” municipally-owned Federal-Aid roadways increases from 26 to34 percent. “Good” roadways are maintained at 33%. “Fair” roadways are reduced from26 to 22%, and “Poor” roadways are reduced from 14 to 12 percent.The <strong>Cape</strong> <strong>Cod</strong> Commission is currently engaged in an active pavement condition datacollection effort. Beginning with the FY <strong>2012</strong> Unified <strong>Plan</strong>ning Work Program, a greatlyexpanded Pavement Management System effort will be underway. Results of theseefforts will provide the <strong>Cape</strong> <strong>Cod</strong> MPO & <strong>Cape</strong> <strong>Cod</strong> towns with more up-to-date andaccurate data for improved pavement funding decision-making.2.2.7 AUTO OWNERSHIPBased on census reports, over 131,000 vehicles are owned by <strong>Cape</strong> <strong>Cod</strong> households. It isimportant to note that the census is conducted in April and does not represent the peak(nor the annual low) condition. The majority of <strong>Cape</strong> <strong>Cod</strong> households, or 62.5%, ownmore than one vehicle. On average, <strong>Cape</strong> <strong>Cod</strong> households own 1.7 vehicles. Only 3% of<strong>Cape</strong> <strong>Cod</strong> households do not own a vehicle. According to the Census, this is higher thanboth the 34.9% of Boston households that do not own a car, and the 12.7% ofMassachusetts’ households who do not own a car. The dependence of <strong>Cape</strong> <strong>Cod</strong>Chapter 2.2: Roadways <strong>Cape</strong> <strong>Cod</strong> <strong>Regional</strong> <strong>Transportation</strong> <strong>Plan</strong> | August 2011Page 82
households on automobiles is due to the low density of housing, jobs, and retail land usesand the lack of viable transit alternatives.40,000Household Car Ownership on <strong>Cape</strong> <strong>Cod</strong>: 200035,192Number of Households30,00020,00010,00025,5158,38102,1811,9525620 1 2 3 4 5+Number of Vehicles Per HouseholdFIGURE 12 - HOUSEHOLD CAR OWNERSHIP ON CAPE COD: 2000The following figure shows average auto ownership by household. Not that for all areaswhere data are available (e.g., no data available for portions of the MassachusettsMilitary Reservation), there is at least one automobile per household. Many areas havemore than two automobiles per household on average. No areas had less than oneautomobile per household on average.<strong>Cape</strong> <strong>Cod</strong> <strong>Regional</strong> <strong>Transportation</strong> <strong>Plan</strong> | August 2011Chapter 2.2: RoadwaysPage 83
FIGURE 13 - AUTO OWNERSHIP ON CAPE CODSource: US Census 2000Chapter 2.2: Roadways <strong>Cape</strong> <strong>Cod</strong> <strong>Regional</strong> <strong>Transportation</strong> <strong>Plan</strong> | August 2011Page 84
2.2.8 COMMUTER TRAFFICOn average 20% of trips made daily by individuals are work-related. According to censusdata, 90% of <strong>Cape</strong> <strong>Cod</strong> residents commute to work in an automobile, either bythemselves or in a carpool. Taken together, this means that commuter traffic is animportant component of road transportation.FIGURE 14 - COMMUTER MODE CHOICE AMONG CAPE COD RESIDENTSSource: Research Triangle Institute, 1991In 2000, 85.4% of employed <strong>Cape</strong> <strong>Cod</strong> residents worked on <strong>Cape</strong> <strong>Cod</strong> and 49.2% ofthose live and work in the same town according to the Census. Thus, despite thesignificant trips generated by long distance commuters, almost half of journey-to-worktrips made by <strong>Cape</strong> <strong>Cod</strong> residents are local.Several roads serve as major commuter corridors. Route 6 serves long distancecommuters. Traffic at the entrance and exit ramps of the Mid <strong>Cape</strong> Highway can becomecongested at peak hours as commuting traffic attempts to transfer from Route 6 to thelocal road network, or vice versa. Exit 6 to Route 132 in Barnstable, and Exit 7 to WillowStreet in Yarmouth can become particularly congested, as well as Exit 10 in Harwich.Route 6 in the Outer <strong>Cape</strong> can also become congested during peak hours. Route 28 also<strong>Cape</strong> <strong>Cod</strong> <strong>Regional</strong> <strong>Transportation</strong> <strong>Plan</strong> | August 2011Chapter 2.2: RoadwaysPage 85
serves commuter traffic, specifically traffic between Falmouth and Bourne, andFalmouth and the Mid-<strong>Cape</strong>. Peak hour traffic on Route 28 from downtown Falmouth toSandwich Road can experience high congestion. Understanding local commutingpatterns will help planning efforts to address capacity limitations and peak hourcongestion.Another major area of congestion on <strong>Cape</strong> <strong>Cod</strong> is within the <strong>Cape</strong> <strong>Cod</strong> Canaltransportation network. Given current employment figures, commuting trips accountedfor roughly one-third of average daily traffic over the canal roadways in 2000. Themajority of those trips are from commuters going off <strong>Cape</strong> (see figure below).COMMUTING TRENDS FOR BARNSTABLECOUNTY, 1960-2000COMMUTING BEHAVIORS FOR BARNSTABLECOUNTY TOWNS, 2000 CENSUSFIGURE 15 - COMMUTING TRENDS AND PATTERNSSource: <strong>Cape</strong> Trends, <strong>Cape</strong> <strong>Cod</strong> CommissionChapter 2.2: Roadways <strong>Cape</strong> <strong>Cod</strong> <strong>Regional</strong> <strong>Transportation</strong> <strong>Plan</strong> | August 2011Page 86
The following table lists for each <strong>Cape</strong> <strong>Cod</strong> town the number of workers residing in eachtown along with the location of employment. Bourne had the highest percentage ofresident workers traveling to employment outside Barnstable County (34.9 %), in partdue to its relative proximity to off-<strong>Cape</strong> employment centers. In contrast, only 3.7% ofProvincetown workers leave the <strong>Cape</strong> for work in part due to the travel time from thecounty line.TABLE 8 - BARNSTABLE COUNTY COMMUTING PATTERNS, BY TOWN, 2000 CENSUS<strong>Cape</strong> <strong>Cod</strong> <strong>Regional</strong> <strong>Transportation</strong> <strong>Plan</strong> | August 2011Chapter 2.2: RoadwaysPage 87
The following table lists the most popular cites or towns that employ <strong>Cape</strong> residents. Thecity of Boston alone comprises 19% of the off-<strong>Cape</strong> employment.TABLE 9 - TOP DESTINATIONS OF RESIDENTS COMMUTING FROM BARNSTABLE COUNTY,APRIL 2000Chapter 2.2: Roadways <strong>Cape</strong> <strong>Cod</strong> <strong>Regional</strong> <strong>Transportation</strong> <strong>Plan</strong> | August 2011Page 88
The following figure graphically shows surrounding counties that employ <strong>Cape</strong> residentsas well as provide workers traveling to Barnstable County. The left half of each bar chart,shown in blue, indicates the relative number of <strong>Cape</strong> <strong>Cod</strong> residents who are employed ineach county. The right half of each bar chart indicated in red, show the relative numberof workers from each county who are employed on <strong>Cape</strong> <strong>Cod</strong>. As mentioned above,Boston (Suffolk and Norfolk Counties) is a major attractor of <strong>Cape</strong> workers but does notserve as a large residence-base for employees traveling to Barnstable County. PlymouthCounty does serve as the largest off-<strong>Cape</strong> county sending workers and also is a majoremployer of <strong>Cape</strong> residents.FIGURE 16 - COMMUTING PATTERNS (DESTINATIONS OF CAPE COD RESIDENTS)2.2.9 VISITOR TRAFFICA mainstay of the summer economy is the influx of visitors during the summer season.The figure below illustrates a sample of the geographically-diverse and plentiful selectionof attractions. Areas shaded in purple include the many beaches and marinas locatedthroughout the <strong>Cape</strong>. Green-shaded areas include attractions such as parks, golfcourses, etc.<strong>Cape</strong> <strong>Cod</strong> <strong>Regional</strong> <strong>Transportation</strong> <strong>Plan</strong> | August 2011Chapter 2.2: RoadwaysPage 89
FIGURE 17 - VISITOR ATTRACTIONS ON CAPE CODNote: Map features have been enlarged with a 0.1 mile buffer to provide better visibilityRoute 28 License Plate SurveyThe <strong>Cape</strong> <strong>Cod</strong> Commission conducted a license plate survey on September 29, 2009 inthe towns of Yarmouth and Barnstable. License plates were recorded in an effort todetermine route choice for westbound vehicles from Route 28 in West Yarmouth toRoute 28 in Centerville (Barnstable). It was possible to locate each vehicle withMassachusetts license plate to a zip code of origin. The following figure depicts theregistered location (by zip code) of each matched Massachusetts plate.Chapter 2.2: Roadways <strong>Cape</strong> <strong>Cod</strong> <strong>Regional</strong> <strong>Transportation</strong> <strong>Plan</strong> | August 2011Page 90
FIGURE 18: LICENSE PLATE STUDY: MA PLATE REGISTERED RESIDENCE (ZIP CODE)Source: <strong>Cape</strong> <strong>Cod</strong> CommissionOut of state visitors recorded during this study were identified by their non-Massachusetts license plate. Of those non-Massachusetts vehicles, the majority wereregistered in Florida (42 total). It is likely that these vehicles belonged to people whoown housing in both states, rather than just temporarily visiting <strong>Cape</strong> <strong>Cod</strong>. AfterFlorida, the majority of non-Massachusetts plates hailed from the northeast, with thelargest numbers coming from New York (37), Rhode Island (18), Connecticut (14), andNew Jersey (7). The following figure shows the registered states from vehicles visitingthe study area from outside Massachusetts.<strong>Cape</strong> <strong>Cod</strong> <strong>Regional</strong> <strong>Transportation</strong> <strong>Plan</strong> | August 2011Chapter 2.2: RoadwaysPage 91
FIGURE 19: LICENSE PLATE STUDY: NON-MASSACHUSETTS STATE OF ORIGINSource: <strong>Cape</strong> <strong>Cod</strong> CommissionChapter 2.2: Roadways <strong>Cape</strong> <strong>Cod</strong> <strong>Regional</strong> <strong>Transportation</strong> <strong>Plan</strong> | August 2011Page 92
2.2.10 FREIGHT TRAFFICThis section includes information regarding patterns of freight traffic on <strong>Cape</strong> <strong>Cod</strong>,focusing primarily on trucks and their travel patterns. There are over 204 miles ofdesignated truck routes under state authority (shown in the following figure). FHWAestimates that truck traffic will increase on <strong>Cape</strong> <strong>Cod</strong> during the next 20 years.Estimates for the years 1998 and 2020 are shown in the two figures on the followingpages.FIGURE 20 - DESIGNATED TRUCK ROUTES UNDER STATE AUTHORITYSource: Massachusetts Roadway Inventory File 2008<strong>Cape</strong> <strong>Cod</strong> <strong>Regional</strong> <strong>Transportation</strong> <strong>Plan</strong> | August 2011Chapter 2.2: RoadwaysPage 93
FIGURE 21 - ESTIMATED AVERAGE ANNUAL DAILY TRUCK TRAFFIC: 1998Source: FHWAChapter 2.2: Roadways <strong>Cape</strong> <strong>Cod</strong> <strong>Regional</strong> <strong>Transportation</strong> <strong>Plan</strong> | August 2011Page 94
FIGURE 22 - ESTIMATED AVERAGE ANNUAL DAILY TRUCK TRAFFIC: 2020Source: FHWA<strong>Cape</strong> <strong>Cod</strong> <strong>Regional</strong> <strong>Transportation</strong> <strong>Plan</strong> | August 2011Chapter 2.2: RoadwaysPage 95
2.2.11 BRIDGES<strong>Cape</strong> <strong>Cod</strong>’s bridges serve many important functions, one of which is to permit travel overwaterways. The Bourne Bridge and Sagamore Bridge permit vehicular travel over the<strong>Cape</strong> <strong>Cod</strong> Canal. If not for the canal bridges, a motorist would have to use a ferry toreach <strong>Cape</strong> <strong>Cod</strong>. Due to their significance, the canal bridges are discussed at length inanother section of the RTP. Several other bridges connect motorists to places that theywould not be able to reach normally by car. The bridges to Osterville Grand Island inBarnstable and to Lieutenant Island in Wellfleet are perfect examples. Other bridgesmake travel more convenient by connecting two sides of a waterway. The Bass River,Swan Pond River, and Centerville River crossings allow vehicles to travel more directly totheir destinations, without having to drive out of their way in order to avoid waterways.Another function of <strong>Cape</strong> <strong>Cod</strong>’s bridges is to provide grade separation. At-gradeintersections would not work on many roadways, such as Route 6, due to high trafficvolumes or safety concerns. Interchanges and overpasses along Route 6 and the accesscontrolled portion of Route 28 help to separate roadway traffic and permit safe travel.Railroad crossings may also present safety concerns. Several bridges on <strong>Cape</strong> <strong>Cod</strong>separate roadways from railroad tracks. For all these reasons, bridges play an importantrole in the <strong>Cape</strong> <strong>Cod</strong> transportation system.<strong>Cape</strong> <strong>Cod</strong> has over one hundred bridges, primarily located along coastlines and Route 6(see following figure). Forty-two bridges are over waterways, including the <strong>Cape</strong> <strong>Cod</strong>Canal, Bass River, and other small creeks and inlets. Forty–three of <strong>Cape</strong> <strong>Cod</strong>’s bridgesare overpasses, underpasses, or waterway crossings for Route 6. Sixteen of <strong>Cape</strong> <strong>Cod</strong>’sbridges are overpasses or waterway crossings for Route 28. Falmouth has the mostbridges of any <strong>Cape</strong> <strong>Cod</strong> town, given its many bays and inlets and the access-controlledportion of Route 28 (see following table). The oldest bridge on <strong>Cape</strong> <strong>Cod</strong> is the northerncrossing of Palmer Avenue over the Bay Colony Railroad tracks, which was constructedin 1896 (see following figure). The newest bridges in Barnstable County are the newRoute 3 overpasses, built in 2006 as part of the Sagamore Flyover.Chapter 2.2: Roadways <strong>Cape</strong> <strong>Cod</strong> <strong>Regional</strong> <strong>Transportation</strong> <strong>Plan</strong> | August 2011Page 96
TABLE 10 - BRIDGE CONDITIONS OF CAPE COD, BY TOWNTotalBridgesFunctionalBridgesFunctionallyObsoleteBridgesStructurallyDeficientBridgesBourne 10 6 4 0Sandwich 9 3 6 1Falmouth 25 18 7 1Mashpee 0 0 0 0Barnstable 16 7 9 0Yarmouth 9 5 4 0Dennis 13 5 6 2Harwich 8 5 3 0Chatham 1 0 0 1Brewster 1 1 0 0Orleans 4 3 1 0Eastham 1 1 0 0Wellfleet 3 2 1 0Truro 2 2 0 0Provincetown 0 0 0 0<strong>Cape</strong> <strong>Cod</strong> 102 55 42 5Source: AASHTO 2010The Bourne Bridge and Sagamore Bridge, both under the jurisdiction of the Army Corpof Engineers, are not included in the AASHTO ratings, nor are any of the various railbridges.The condition of bridges on <strong>Cape</strong> <strong>Cod</strong> is important given their functions. Bridges arerated on a scale of 0 to 100 by the American Association of State Highway and<strong>Transportation</strong> Officials (AASHTO) according to their type, lane widths, age, structuralconditions, and other factors. A higher score indicates a better condition, while a lowerscore indicates a poorer condition. Scores of 50 or lower qualify for replacement. Of the102 rated bridges on <strong>Cape</strong> <strong>Cod</strong>, only 9 are rated below 50. However, 58 bridges wererated between 50 and 80. As these bridges age, their ratings will decrease. Beingmindful of potential bridgework to be completed in the next 30 years will ensure thetimely replacement of poorly rated bridges.<strong>Cape</strong> <strong>Cod</strong> <strong>Regional</strong> <strong>Transportation</strong> <strong>Plan</strong> | August 2011Chapter 2.2: RoadwaysPage 97
FIGURE 23 - THE BRIDGES OF BARNSTABLE COUNTYAt the time of the last RTP (based on 2006 data), the average bridge rating was 73.6.Four years later, the average is now 72.9 – a decline of less than one. 42 bridges arecurrently identified as functionally obsolete, which is an increase of five since the lastRTP. The number of structurally deficient brings has decreased during that time period– from seven to four.Chapter 2.2: Roadways <strong>Cape</strong> <strong>Cod</strong> <strong>Regional</strong> <strong>Transportation</strong> <strong>Plan</strong> | August 2011Page 98
FIGURE 24 - THE NORTHERN CROSSING OF PALMER AVENUE OVER THE BAY COLONYRAILROAD TRACKS IN FALMOUTHBridges are also identified as structurally deficient or functionally obsolete. Theseclassifications identify bridges that are eligible for various federal and state funding. Abridge is considered structurally deficient if it is closed, restricted to light vehicles, orrequires immediate rehabilitation to remain open. <strong>Cape</strong> <strong>Cod</strong> has seven structurallydeficient bridges. Dennis is the town with the most structurally deficient bridges (seeprevious table). A bridge is considered functionally obsolete if it does not meet thecurrent standards for deck geometry, approach roadway alignment, clearance, or loadcarrying capacity. <strong>Cape</strong> <strong>Cod</strong> has 42 functionally obsolete bridges, with Barnstable havingthe most of any town (see previous table). Many of <strong>Cape</strong> <strong>Cod</strong>’s bridges are consideredfunctionally obsolete due to narrow lane widths or a low level of service. Several projectsare currently underway through the <strong>Transportation</strong> Improvement Program (TIP) toaddress structurally deficient bridges on <strong>Cape</strong> <strong>Cod</strong>. Ensuring that <strong>Cape</strong> <strong>Cod</strong>’s bridges arefunctional and structurally sufficient will improve safety and traffic flow.<strong>Cape</strong> <strong>Cod</strong> <strong>Regional</strong> <strong>Transportation</strong> <strong>Plan</strong> | August 2011Chapter 2.2: RoadwaysPage 99
FIGURE 25 - STRUCTURALLY DEFICIENT AND FUNCTIONALLY OBSOLETE BRIDGES ON CAPECOD2.2.12 U.S. ROUTE 6U.S. Route 6 runs from Provincetown, Massachusetts all the way to Bishop, California,and is the longest continuous route in the United States. On <strong>Cape</strong> <strong>Cod</strong>, Route 6 is themajor transportation corridor, particularly for those traveling long distances. Fromwhere it enters Barnstable County in Buzzards Bay until its end in Provincetown, itprovides a primarily limited-access high-speed means of traveling along the spine of the<strong>Cape</strong> both for private automobiles and for public transit. The Route 6 corridor in theOuter <strong>Cape</strong>, where the roadway does not have limited access, also contains segments ofthe Claire Saltonstall Bikeway, or State Bicycle Route 1. There are four primary sectionsof Route 6 on <strong>Cape</strong> <strong>Cod</strong> that can be identified by their roadway characteristics.Buzzards Bay to Sagamore BridgeFrom where it enters the county in Buzzards Bay to where it crosses the <strong>Cape</strong> <strong>Cod</strong> Canalat the Sagamore Bridge Route 6 is a two- to four-lane road with curb cuts on both sides.Chapter 2.2: Roadways <strong>Cape</strong> <strong>Cod</strong> <strong>Regional</strong> <strong>Transportation</strong> <strong>Plan</strong> | August 2011Page 100
The Sagamore Rotary, located north of the Sagamore Bridge, was eliminated by 2006.This new grade separated intersection provides for a direct connection between Route 3and the Sagamore Bridge and, according to MassDOT, will help relieve the congestionthat occurs on either side of the bridge frequently during the summer.As part of the Canal Area <strong>Transportation</strong> system, this section of Route 6 is discussed atgreater length in a later section of this chapter.FIGURE 26 - SCENIC HIGHWAY (ROUTE 6), WEST OF BOURNEDALE ROADSagamore Bridge to Exit 9, DennisFrom the Sagamore Bridge to just after Exit 9 in Dennis, Route 6 is a four-lane limitedaccesshighway with a grass shoulder and rest areas.<strong>Cape</strong> <strong>Cod</strong> <strong>Regional</strong> <strong>Transportation</strong> <strong>Plan</strong> | August 2011Chapter 2.2: RoadwaysPage 101
FIGURE 27 - ROUTE 6 AT EXIT 4 IN SANDWICHFIGURE 28 - ROUTE 6 BETWEEN EXITS 8 AND 9 (MID-CAPE)Exit 9, Dennis to Orleans RotaryFrom Dennis to the Orleans/Eastham rotary the road narrows to two lanes but remainslimited-access, with a raised median and yellow reflective post delineators to reduceChapter 2.2: Roadways <strong>Cape</strong> <strong>Cod</strong> <strong>Regional</strong> <strong>Transportation</strong> <strong>Plan</strong> | August 2011Page 102
crossovers from one direction of traffic to the other. The divider is low enough to allowemergency vehicles to straddle the raised median for emergency access. This section isactually built on what was designed to be one direction of a divided highway.FIGURE 29 - ROUTE 6 BETWEEN EXITS 9 AND 10 (LOWER CAPE)Orleans Rotary to ProvincetownRoute 6 in the Outer <strong>Cape</strong> area was generally a consolidation of existing roadways andevolved over time since the 1930s. Short sections of the original Route 6 have beenretained for local access for road straightening projects. In northern Truro andProvincetown, the original Route 6 became Route 6A.Finally, from the Orleans Rotary until the road’s end in Provincetown the road is onceagain a two- to four- lane road with curb cuts on both sides, although a grassed mediandoes limit crossovers on sections of Route 6 in Truro and Provincetown.<strong>Cape</strong> <strong>Cod</strong> <strong>Regional</strong> <strong>Transportation</strong> <strong>Plan</strong> | August 2011Chapter 2.2: RoadwaysPage 103
FIGURE 30 - ROUTE 6 NORTH OF GOVERNOR PRENCE ROAD, EASTHAM (OUTER CAPE)TABLE 11 - CONSTRUCTION TIMELINE OF THE MID-CAPE HIGHWAY: 1950-1971Year<strong>Complete</strong>d ConfigurationSegment Description1950 2 lanes Sagamore Bridge to Hyannis (exit 6)1954 2 more lanes (4 total) Sagamore Bridge to Hyannis (exit 6)1955 2 lanes Hyannis (exit 6) to Dennis (exit 9)1956 2 lanes Dennis (exit 9) to Harwich/Brewster (exit 11)1958 2 lanes Harwich/Brewster (exit 11) to Orleans (exit 12)1959 2 lanes Orleans (exit 12) to Orleans/Eastham Rotary1967 2 more lanes (4 total) Hyannis (exit 6) to Yarmouth (exit 7)1971 2 more lanes (4 total) Yarmouth (exit 7) to Dennis (exit 9)SafetyThe primary debate surrounding Route 6 has been the balance between safety, capacity,and the environment. Some want to increase capacity through structural improvementsChapter 2.2: Roadways <strong>Cape</strong> <strong>Cod</strong> <strong>Regional</strong> <strong>Transportation</strong> <strong>Plan</strong> | August 2011Page 104
to accommodate high levels of traffic safely. The levels of traffic between Dennis andOrleans are lower than those between Sandwich and Dennis, but still above what manyconsider the capacity of a two-lane highway with limited access and unpaved shoulders.The Route 6 interchanges are among the most dangerous intersections on <strong>Cape</strong> <strong>Cod</strong>. Onthe Outer-<strong>Cape</strong>, the intersection of Route 6 and Brackett Road is also an intersection ofsafety concern. Since January of 2007, there have been eleven fatal crashes on Route 6 –six on the limited access portion of the highway, and five on the Outer-<strong>Cape</strong>. Four of theOuter-<strong>Cape</strong> crashes occurred in Wellfleet, and the other occurred in Truro.Similarly, on the Outer <strong>Cape</strong>, many have sought some way to increase safety forpedestrians and cars along Route 6. In addition, the proliferation of curb cuts along thatsegment of the road has caused increased congestion and increased the potential forcrashes. Also, in the segment along the Canal, traffic tends to travel faster than theroadway geometry design speed. Safety issues are discussed in greater detail in anotherchapter of the RTP.CongestionTraffic flow along the corridor is reasonable in the winter but often operates poorly in thesummer. During peak travel periods in the summer it is not unusual for westboundtraffic to be stopped for several miles east of the Sagamore Bridge. Average Daily Traffic(ADT) volumes, mileage, and Vehicle Miles Traveled (VMT) are presented in thefollowing table:<strong>Cape</strong> <strong>Cod</strong> <strong>Regional</strong> <strong>Transportation</strong> <strong>Plan</strong> | August 2011Chapter 2.2: RoadwaysPage 105
TABLE 12 - TRAFFIC VOLUMES & MILEAGE: ROUTE 6TownSummerADTAnnualADT MilesAvg. DailyVehicleMilesTraveled(VMT)Bourne* 65,694 49,258 1.71 84,230Sandwich 60,023 46,818 6.90 323,043Barnstable 61,449 46,391 8.28 384,120Yarmouth 56,307 43,920 4.56 200,274Dennis 44,458 34,678 2.04 70,742Harwich 33,429 26,075 5.63 146,799Brewster 22,587 17,618 2.92 51,445Orleans 20,308 15,840 3.6 57,024Eastham 28,122 21,936 6.12 134,245Wellfleet 21,856 17,048 8.56 145,929Truro 15,542 12,123 9.93 120,383Provincetown 9,153 7,139 3.8 27,129Total 64.05 1,745,362* south/east of Sagamore BridgeSource: MassDOT and <strong>Cape</strong> <strong>Cod</strong> Commission 2009 Traffic VolumesNote: Annual ADT Estimates Based on MassDOT Adjustment FactorsThe following figure details the traffic volume between each interchange on the limitedaccess portion of Route 6. This length of road begins at the Sagamore Bridge in the westand ends at the Eastham Rotary in the east. Between the bridge and Exit 9 in Dennis,Route 6 is two lanes in each direction separated by a grassy median. East of Exit 9, thehighway is one lane in each direction separated by a narrow paved berm. The heaviestvolumes are near the Sagamore Bridge, west of Exit 6 in Barnstable (which leads towardsHyannis), and east of Exit 7 (another Hyannis exit for travelers from the Lower or Outer<strong>Cape</strong>).Chapter 2.2: Roadways <strong>Cape</strong> <strong>Cod</strong> <strong>Regional</strong> <strong>Transportation</strong> <strong>Plan</strong> | August 2011Page 106
Land UseFIGURE 31: ROUTE 6 LIMITED ACCESS VOLUMESAdjacent land uses vary by location. In the limited access sections of the road there issome residential development and some industrial development along the corridor. Inthe sections with curb cuts there is more commercial development, including retailactivity.In addition to being the main thoroughfare for the <strong>Cape</strong> as a whole, it also is the “MainStreet” of several <strong>Cape</strong> towns or villages. Buzzards Bay, Eastham, and to a lesser degree,Truro and Wellfleet, all use Route 6 as a downtown thoroughfare. This dual purpose forthe road has created some conflicts for this corridor.2.2.13 STATE ROUTE 28State Route 28 begins at the New Hampshire border and enters Barnstable County atCohasset Narrows on the border of Bourne/Wareham. Route 28 runs for almost sixtyfivemiles crossing the <strong>Cape</strong> <strong>Cod</strong> Canal and passing through villages adjacent to BuzzardsBay/Nantucket Sound/the Atlantic Ocean from Bourne to Orleans Center. Route 28 is aregional roadway but it does not provide very direct inter-regional travel options in mostcases. Some alternative routes to 28 include Route 151, Buck Island Road, Great WesternRoad, Upper and Lower County Roads, Route 39 and, for longer trips, Route 6. Thecross section of Route 28 varies greatly throughout the <strong>Cape</strong>. However, there are threeprimary sections to Route 28, which are identifiable by their roadway characteristics.Buzzards Bay to Bourne RotaryRoute 28 consists of four lanes from the county line across the Bourne Bridge to theBourne Rotary.<strong>Cape</strong> <strong>Cod</strong> <strong>Regional</strong> <strong>Transportation</strong> <strong>Plan</strong> | August 2011Chapter 2.2: RoadwaysPage 107
Bourne Rotary to Palmer Avenue, FalmouthRoute 28 consists of four lanes, divided by a grassy median, from the Bourne Rotary toSaconesset Hills in Falmouth. The western side of Route 28 in Bourne from the BourneRotary to the Otis Rotary (MacArthur Boulevard) allows property access. Vehicles canreverse direction via a number of U-turn areas in the median.FIGURE 32 - ROUTE 28 NORTH, SOUTH OF THE OTIS ROTARY IN BOURNEChapter 2.2: Roadways <strong>Cape</strong> <strong>Cod</strong> <strong>Regional</strong> <strong>Transportation</strong> <strong>Plan</strong> | August 2011Page 108
Palmer Avenue, Falmouth to Orleans RotaryFrom Palmer Avenue in Falmouth, Route 28 is predominately two lanes to theintersection of Old Stage Road in Barnstable. Route 28 then transitions to four Lanesfrom Old Stage Road to Phinneys Lane in Barnstable and then predominately is twolanes from Phinneys Lane to the Orleans/Eastham Rotary.FIGURE 33 - ROUTE 28 NORTH OF JONES ROAD/DAVID STRAITS, FALMOUTH (UPPER CAPE)<strong>Cape</strong> <strong>Cod</strong> <strong>Regional</strong> <strong>Transportation</strong> <strong>Plan</strong> | August 2011Chapter 2.2: RoadwaysPage 109
FIGURE 34 - ROUTE 28, EAST OF ROUTE 149 IN BARNSTABLE (MID-CAPE)FIGURE 35 - ROUTE 28 IN SOUTH YARMOUTH (MID-CAPE)Chapter 2.2: Roadways <strong>Cape</strong> <strong>Cod</strong> <strong>Regional</strong> <strong>Transportation</strong> <strong>Plan</strong> | August 2011Page 110
FIGURE 36 - ROUTE 28 EAST OF ROUTES 124 AND 39 (LOWER CAPE)SafetyFIGURE 37 - ROUTE 28 NORTH OF ROUTE 39 IN ORLEANS (LOWER CAPE)Route 28 has a variety of conditions ranging from a limited access, divided highway to atwo lane roadway. Route 28 includes many of <strong>Cape</strong> <strong>Cod</strong>’s highest crash locations. Basedon data from 2006-2008, Route 28’s most dense areas of concern are in Buzzards Bay,downtown Falmouth, and from Yarmouth Road in Hyannis to the Harwich town line.Since January 2007, there have been nine fatal crashes on Route 28. Fatal crashes wereconcentrated on MacArthur Boulevard in Bourne and in Barnstable between theCenterville Mall and the Airport Rotary. Safety issues are discussed in greater detail inanother chapter of the RTP.<strong>Cape</strong> <strong>Cod</strong> <strong>Regional</strong> <strong>Transportation</strong> <strong>Plan</strong> | August 2011Chapter 2.2: RoadwaysPage 111
CongestionTraffic flow along the corridor is generally heavy during the summer, with gridlockoccurring in many locations. However, the level of traffic varies greatly along thecorridor. Much of the Route 28 corridor is congested during summer peak hours. Trafficalso slows when there is an incident or construction.One major problem along the Route 28 corridor is providing for modes other than theautomobile. Public transit (<strong>Cape</strong> <strong>Cod</strong> RTA’s SeaLine & Hyannis-Orleans services) isavailable for some sections. Sidewalks are available in some village centers. Bicycleaccommodation is for the most part non-existent.TownTABLE 13 - TRAFFIC VOLUMES & MILEAGE: ROUTE 28SummerADTAnnualADTMilesAvg. DailyVehicleMilesTraveled(VMT)Bourne 42,848 33,315 8.7 289,843Falmouth 20,917 16,315 14.6 238,200Mashpee 24,671 19,244 3.7 71,201Barnstable 25,717 20,060 10.4 208,619Yarmouth 22,044 17,195 5.2 89,412Dennis 15,112 11,787 3.4 40,077Harwich 13,701 10,687 6.4 68,395Chatham 12,737 9,935 7.3 72,526Orleans 13,091 10,211 4.9 50,034Total 64.6 1,128,306Source: <strong>Cape</strong> <strong>Cod</strong> Commission 2009 Traffic VolumesNote: Annual ADT Estimates Based on MassDOT Adjustment FactorsChapter 2.2: Roadways <strong>Cape</strong> <strong>Cod</strong> <strong>Regional</strong> <strong>Transportation</strong> <strong>Plan</strong> | August 2011Page 112
2.2.14 ROUTE 6ARoute 6A on <strong>Cape</strong> <strong>Cod</strong> is one of the oldest travel corridors in the country. Originally apath used by Native Americans, it was later adopted by colonists for travel fromPlymouth out to Eastham. Later it served as state Route 6 until the construction of thecurrent Route 6 in the 1950s. Today it is also known as the Old Kings Highway and is astate Scenic Byway.Roadway CharacteristicsRoute 6A is a narrow and windy two lane road with little or no shoulder. One exceptionto this is the four-lane cross section in Orleans. Because of the narrow shoulders, passingzones are limited and biking can be difficult. Some segments have sidewalks (forexample, in Barnstable Village, Brewster, and Orleans) but often it is difficult to travelalong this corridor any way other than by automobile.FIGURE 38 - ROUTE 6A WEST OF WILLOW STREET (MID-CAPE)<strong>Cape</strong> <strong>Cod</strong> <strong>Regional</strong> <strong>Transportation</strong> <strong>Plan</strong> | August 2011Chapter 2.2: RoadwaysPage 113
SafetyFor the years 2005 and 2006, the town along Route 6A with the most crashes wasBrewster with over 120 crashes. This is more than double that of Bourne, which had thesecond most with just fewer than 60 (however Bourne has only one twelfth the mileageof Brewster). During this time span, Route 6A in Sandwich experienced a fatal crash andYarmouth experienced two. There have been no fatal crashes on Route 6A since.Another conflicting issue is the scenic nature of Route 6A and the current process forfunding roadway rehabilitation projects which require upgrading the width andalignment to modern standards. An ongoing initiative by the <strong>Cape</strong> <strong>Cod</strong> Commission is todevelop rural road design guidelines that will provide “footprint roadway” options topreserve the character of scenic roadways such as Route 6A. Safety issues are discussedin greater detail in another chapter of the RTP.CongestionTraffic flow along the corridor is generally heavy during the summer but rarely stopped.However, the level of traffic varies greatly along the corridor. Average Daily Traffic(ADT) volumes, mileage, and Vehicle Miles Traveled (VMT) are presented in thefollowing table:Much of the Route 6A corridor is congested during summer peak hours. In fact, a majorproblem along the Route 6A corridor is how to provide for modes other than theautomobile. Several studies have been conducted on this subject, including a bicycleaccommodation study and an Alternate Modes Assessment was conducted for theCommission in 1995. An updated “Route 6A Corridor Management <strong>Plan</strong>” was producedin 2010. Recommendation from this study was the reduction of speed limits to 35 MPHand accommodation of alternate mode users such as pedestrians, bicyclists and publictransportation users.Chapter 2.2: Roadways <strong>Cape</strong> <strong>Cod</strong> <strong>Regional</strong> <strong>Transportation</strong> <strong>Plan</strong> | August 2011Page 114
TownTABLE 14- TRAFFIC VOLUMES & MILEAGE: ROUTE 6ASummerADTAnnualADTMilesAvg. DailyVehicleMilesTraveled(VMT)Bourne 13,932 10,867 0.6 6,520Sandwich 10,439 8,142 7.5 61,068Barnstable 8,257 6,440 8.4 54,097Yarmouth 15,048 11,737 3.7 43,428Dennis 9,790 7,636 4.3 32,835Brewster 14,546 11,346 7.8 88,499Orleans 20,432 15,936 1.7 27,092Total 34.0 313,539Source: <strong>Cape</strong> <strong>Cod</strong> Commission 2004-2005 Traffic VolumesNote: Annual ADT Estimates Based on MassDOT Adjustment FactorsLand UseAdjacent land uses vary by location. Several village centers exist along the corridor, suchas Barnstable Village, Yarmouthport, and Brewster. Several “new villages” have alsosprung up as strip development in the last 20 years, such as the development in Orleans.In addition, Sandwich Center lies just off 6A to the south. Much of the corridor remainsresidential, or is undeveloped due to the proximity of wetlands with Sandwich andOrleans the notable exceptions. Bike travel along the corridor is common despite thefact that it is best suited for experienced bicyclists. This is due to the scenic nature of thecorridor, relatively low vehicle speeds, and residential and commercial development.With the exception of the portion of the roadway in Orleans from Route 6 Exit 12 to theEastham Rotary, development along Route 6A is reviewed for appropriateness bycommittees of the Old King’s Highway Historic District.2.2.15 CONCLUSIONRoadways are the most important element of the <strong>Cape</strong>’s transportation system. Whilemostly serving automobile traffic, they also provide space for public transit as well ascurrent and potential future corridors for pedestrians and cyclists. The RTP shouldensure that maintenance, safety improvements, and needed congestion relief projectsand programs are funded and implemented.<strong>Cape</strong> <strong>Cod</strong> <strong>Regional</strong> <strong>Transportation</strong> <strong>Plan</strong> | August 2011Chapter 2.2: RoadwaysPage 115
Chapter 2.2: Roadways <strong>Cape</strong> <strong>Cod</strong> <strong>Regional</strong> <strong>Transportation</strong> <strong>Plan</strong> | August 2011Page 116
2.3 BUS TRANSPORTATIONFIGURE 1: BUS ROUTES AND CONNECTIONS ON CAPE CODSource: SmartGuide.org<strong>Cape</strong> <strong>Cod</strong> <strong>Regional</strong> <strong>Transportation</strong> <strong>Plan</strong> | August 2011Chapter 2.3: Bus <strong>Transportation</strong>Page 117
A bus is a motorized form of land transportation intended to carry passengers. Besidesluggage, buses also carry some freight. The word bus is a shortened version of omnibus,derived from Latin, which means “for everyone.”On <strong>Cape</strong> <strong>Cod</strong>, 1.22% of workers commute to work via public transportation according tothe Census. This includes local and interregional bus service. Sandwich Village has thelargest percentage of workers commuting by public transportation. This is probably dueto the interregional bus service to Boston available at the Sagamore Park-and-Ride Lot.Although the majority of the distance of their commute is by public transportation, mostof these workers do drive across the Sagamore Bridge to reach the lot. Orleans, Dennis,Hyannis, Falmouth, and Sandwich also have several areas where workers are usingpublic transportation to commute to work (Figure 2). It is clear that workers living near local bus routes are not using them in highpercentages, nor are public transportation users primarily clustered around <strong>Cape</strong> <strong>Cod</strong>’sdowntown areas.FIGURE 2: PUBLIC TRANSPORTATION USE ON CAPE CODSource: U.S. CensusChapter 2.3: Bus <strong>Transportation</strong> <strong>Cape</strong> <strong>Cod</strong> <strong>Regional</strong> <strong>Transportation</strong> <strong>Plan</strong> | August 2011Page 118
2.3.1 HYANNIS TRANSPORTATION CENTERThe Hyannis <strong>Transportation</strong> Center was built in 2002 as a hub for <strong>Cape</strong> <strong>Cod</strong>’stransportation needs. The building is a two story, 17,000 square foot facility located nearthe intersection of Main Street and Center Street in Hyannis at the end of the rail tracks.The property has entrances from Route 28, Center Street, and Ridgewood Avenue. Thefacility includes a bus terminal and a connection to the <strong>Cape</strong> <strong>Cod</strong> Central Railroadterminal. Additionally, there is parking space available for 220 cars on an eight-acre lot.The building itself is owned and operated by the <strong>Cape</strong> <strong>Cod</strong> <strong>Regional</strong> Transit Authority(CCRTA). The Hyannis <strong>Transportation</strong> is open 7 days a week, excepting holidays, fromearly morning to 8:30pm. Inside, travelers are offered several amenities, such as Wi-Fiinternet, vending machines, an ATM, and restrooms. Route maps are posted throughoutthe facility and announcements of arrivals and departures are made over the loudspeaker system. Additional travel information is available at the information desk.FIGURE 3: HYANNIS TRANSPORTATION CENTER, NORTH SIDE<strong>Cape</strong> <strong>Cod</strong> <strong>Regional</strong> <strong>Transportation</strong> <strong>Plan</strong> | August 2011Chapter 2.3: Bus <strong>Transportation</strong>Page 119
FIGURE 4: HYANNIS TRANSPORTATION CENTER, WEST SIDEFIGURE 5: BUS TERMINAL AT THE HYANNIS TRANSPORTATION CENTERChapter 2.3: Bus <strong>Transportation</strong> <strong>Cape</strong> <strong>Cod</strong> <strong>Regional</strong> <strong>Transportation</strong> <strong>Plan</strong> | August 2011Page 120
FIGURE 6: TAXI PICK-UP AND DROP OFF AT THE HYANNIS TRANSPORTATION CENTERThe Hyannis <strong>Transportation</strong> Center brings together local and interregional bus services,rail facilities, and connections to air and ferry service. Plymouth and Brockton, PeterPan, and Bonanza Bus lines all make daily use of the bus terminal facilities. Four RTAbus lines make stops at the Hyannis <strong>Transportation</strong> Center, as well as two RTA shuttles.These transit lines provide connections to ferry service in Hyannis and air service andrental car service at Barnstable Municipal Airport. Plymouth and Brockton service fromBoston and Provincetown, and Peter Pan service from Providence and New York makestops at the Hyannis <strong>Transportation</strong> Center. There is also an area designated for Taxiservice pick-up and drop-off. Nearby ferry service to Martha’s Vineyard and Nantucketis accessible by local transit. Given the variety of transportation options available, theHyannis <strong>Transportation</strong> Center is sometimes also referred to as the Hyannis IntermodalCenter.2.3.2 OTHER BUS TERMINALSIn addition the Hyannis <strong>Transportation</strong> Center, several other locations serve as busterminals and stops throughout <strong>Cape</strong> <strong>Cod</strong>.<strong>Cape</strong> <strong>Cod</strong> <strong>Regional</strong> <strong>Transportation</strong> <strong>Plan</strong> | August 2011Chapter 2.3: Bus <strong>Transportation</strong>Page 121
2.3.2.1 MacMillan Pier and Bus DepotFIGURE 7: AERIAL VIEW OF THE MACMILLAN PIER IN PROVINCETOWNMacMillan Pier in Provincetown is located at the intersection of Commercial Street andRyder Street. The facility is open Monday through Saturday from 9am to 6pm and isclosed on Sundays and holidays. MacMillan Pier includes a bus depot, ferry terminal,and a parking facility open seven days a week. The bus depot serves as a terminal forPlymouth and Brockton service from Hyannis and Boston. The <strong>Cape</strong> <strong>Cod</strong> <strong>Regional</strong><strong>Transportation</strong> Authority’s (CCRTA) seasonal Provincetown Shuttle makes scheduledstops at the facility on its way to Race Point, Provincetown Municipal Airport and NorthTruro. Ferry service to Plymouth and Boston is also available seasonally. MacMillanPier is located in the heart of downtown Provincetown, with access to restaurants, hotelsand shopping. The site of MacMillan Pier is also being studied as the possible locationfor a local intermodal center similar to the Hyannis <strong>Transportation</strong> Center, but smallerin size.Chapter 2.3: Bus <strong>Transportation</strong> <strong>Cape</strong> <strong>Cod</strong> <strong>Regional</strong> <strong>Transportation</strong> <strong>Plan</strong> | August 2011Page 122
2.3.2.2 Falmouth Bus DepotThe Falmouth Bus Depot is located on Depot Avenue in Falmouth. The building itselfused to be a railway station. After rail service to Woods Hole was suspended, thebuilding was converted into a bus terminal. The facility is open 7 days a week, exceptingholidays, from 5am to 5pm. Limited parking is available. The Falmouth Bus Depotserves as a destination for local transit and interregional bus service, and providesconnections to various ferry terminals. Peter Pan service from Boston to Woods Holestops at the Falmouth Bus Depot. Additionally, the RTA’s Hyannis-Falmouth SeaLineservice and the seasonal WHOOSH Trolley will make stops at the Bus Depot uponrequest. These transit services provide connections to the ferry terminals at Woods Holeand Falmouth Marina. Beyond the available transit services, the Shining Sea Bikepath islocated next to the depot along the former rail right-of-way. Given its proximity todowntown, the Falmouth Bus Depot also provides access to restaurants, hotels andshopping.2.3.2.3 Woods Hole Steamship Authority PiersThe Steamship Authority piers in Woods Hole are also used as a bus terminal. Acrossfrom the ferry terminal is a small Peter Pan ticket facility and place for buses to pick-upand drop-off. Peter Pan buses continue from the Steamship Authority Piers to Boston.Due to the demand for ferry service, parking for the bus terminal is extremely limited.Travelers using the bus terminal can make use of amenities at the ferry terminalincluding restrooms, food service, an ATM, and places to sit. Additionally, the ShiningSea Bikepath terminates at the Steamship Authority Pier, providing bicycle access todowntown Falmouth and points north. Nearby Wood Hole offers restaurants, hotels andshopping.FIGURE 8: AERIAL VIEW OF THE STEAMSHIP AUTHORITY PIERS IN WOODS HOLE<strong>Cape</strong> <strong>Cod</strong> <strong>Regional</strong> <strong>Transportation</strong> <strong>Plan</strong> | August 2011Chapter 2.3: Bus <strong>Transportation</strong>Page 123
2.3.2.4 Tedeschi Food Shop in BourneTedeschi Food Shop on Trowbridge Road in Bourne also serves as a stop forinterregional bus service. The location was selected due to its proximity to the BourneBridge and Route 25. Peter Pan makes stops at Tedeschi on its route from Boston toWoods Hole and on its route from Providence to Hyannis. In this way there is anopportunity for travelers to make a transfer. Tedeschi food Shop is open from 5:30am to11pm every day, including holidays. Tickets can be purchased inside Tedeschi and aportion of their parking lot is available for commuters.2.3.3 PARK-AND-RIDE LOTSBesides bus terminals, there are several parking facilities that serve as stops for local andinterregional bus service. Four park-and-ride lots are located across <strong>Cape</strong> <strong>Cod</strong>.MassDOT owns the Sagamore, Barnstable, and Harwich Park-and-Ride Lots, while theCCRTA owns the Hyannis Park-and-Ride Lot.2.3.3.1 Sagamore Park-and-Ride LotThe Sagamore Park-and-Ride Lot is located by Interchange 1a in Bourne, near Routes 3and 6. In early 2009, the lot has been expanded to a total of 396 parking spacesreplacing a temporary lot capacity of 348 spaces. Sagamore Park-and-Ride Lot isaccessed by Plymouth and Brockton on its Boston to Hyannis route. In this way it servesas a commuter stop for those traveling to work in Boston, Logan International Airportand other points north.Based on 18 observations taken between 2008 and 2010 by the <strong>Cape</strong> <strong>Cod</strong> Commission,the average demand of the lot was 72%. The peak parking demand was observed in Juneof 2008 with 352 parked vehicles (97.5% of the existing capacity of the temporary lot).The most recent observation, in August 2010 shows 292 vehicles (73.7%).Chapter 2.3: Bus <strong>Transportation</strong> <strong>Cape</strong> <strong>Cod</strong> <strong>Regional</strong> <strong>Transportation</strong> <strong>Plan</strong> | August 2011Page 124
FIGURE 9: AERIAL VIEW OF THE SAGAMORE PARK-AND-RIDE LOTSource: Google Images.(Note: current Park-and-Ride Lot is darker new pavement to the left of the image. TemporaryPark-and-Ride Lot shown to the right.)2.3.3.2 Barnstable Park-and-Ride LotThe Barnstable Park-and-Ride Lot is located off Exit 6 of Route 6 in Barnstable. The lotwas expanded to 365 parking spaces in August 2001. As part of the expansion, two newshelters were installed and currently appear to be in good condition. This lot has a rampdirectly onto Route 6 westbound, making it convenient for motorists and buses. The Exit6 facility is adjacent to amenities such as restrooms, food service, a convenience store,ATMs, fuel, and a seating area. The Barnstable Mobil Mart located inside is open 24hours and sells tickets for interregional bus service. The Barnstable Park-and-Ride Lot isused as a stop for the Plymouth and Brockton route from Hyannis to Boston and for thePeter Pan route from Hyannis to Providence. The CCRTA’s Barnstable Villager serviceprovides local bus service to the Route 132 entrance to the Park-and-Ride lot, withconnections to Barnstable Village, Route 132, and Hyannis.<strong>Cape</strong> <strong>Cod</strong> <strong>Regional</strong> <strong>Transportation</strong> <strong>Plan</strong> | August 2011Chapter 2.3: Bus <strong>Transportation</strong>Page 125
FIGURE 10: BUS SHELTERS AT BARNSTABLE PARK-AND-RIDE LOTFIGURE 11: PARKING AVAILABLE AT BARNSTABLE PARK-AND-RIDE LOTChapter 2.3: Bus <strong>Transportation</strong> <strong>Cape</strong> <strong>Cod</strong> <strong>Regional</strong> <strong>Transportation</strong> <strong>Plan</strong> | August 2011Page 126
The lot experiences heavy usage, often near or over-capacity. For the 32 observationstaken by the Commission staff in 2008-2010, the average observed demand was 85% ofcapacity. The peak parking demand was observed in June 2008 with 346 parkedvehicles (95% of capacity).2.3.3.3 Harwich Park-and-Ride LotThe Harwich Park-and-Ride Lot is located off Exit 10 of Route 6 on Route 124. The lothas 75 parking spaces. The lot is available as a stop (on-demand) for the CCRTA’s FlexService.Due to its location, size and amount of service, the Harwich Park-and-Ride Lot haslimited usage. For the 18 observations taken by the <strong>Cape</strong> <strong>Cod</strong> Commission staff in 2008-2010, the average observed demand was 25% of capacity. The peak parking demand wasobserved in August 2008, with 67 parked vehicles (89% of capacity). However, thenumber of vehicles parking at the Harwich Park-and-Ride Lot may have increased due tothe new Flex service.2.3.3.4 Hyannis Park-and-Ride LotThe Hyannis Park-and-Ride Lot is located at the Hyannis <strong>Transportation</strong> Center. Thereis room for 225 vehicles. Long-term parking (over 30 minutes) is officially available on apay-basis. The lot has access to all of the bus services and user amenities at the Hyannis<strong>Transportation</strong> Center.2.3.4 INTERREGIONAL BUS SERVICEInterregional bus service transports travelers to and from <strong>Cape</strong> <strong>Cod</strong>. Some examples arebus service from Hyannis to New York City, or Boston to Provincetown. Users ofinterregional bus service include commuters who work in Boston, Logan Airport users,and those traveling or vacationing. Two bus companies serve <strong>Cape</strong> <strong>Cod</strong>’s interregionalservice needs.2.3.4.1 Plymouth and Brockton Street Railway CompanyThe Plymouth and Brockton Street Railway (P&B) was established in 1888, as a localservice provider for the area. At the time, the Old Colony Railroad was providingpassenger service regionally, but not locally. In 1889, founders Charles Stone and EdwinWebster purchased the Plymouth and Kingston Street railway, which had been createdjust 3 years earlier. According to P&B, the electric trolley cars carried passengers to andfrom work, and on weekend “joy rides.” In 1914, a mile long connection to SagamoreBeach and the Sagamore Depot was made. As part of the project, a wooden rail bridgewas built over the first <strong>Cape</strong> <strong>Cod</strong> Canal near the location of the current Sagamore Bridge.After suffering losses following World War I, the company reorganized to provide busservice. Street railway tracks were abandoned and replaced by motor coaches<strong>Cape</strong> <strong>Cod</strong> <strong>Regional</strong> <strong>Transportation</strong> <strong>Plan</strong> | August 2011Chapter 2.3: Bus <strong>Transportation</strong>Page 127
throughout the South Shore. Plymouth and Brockton’s final electric trolley run wasmade on June 28, 1928 between Jabez Corner and Kingston. The company waspurchased by the Anzuoni family in 1948, who continue to operate and manage thePlymouth and Brockton Street Railway to this day. P&B serves 25 cities and towns fromBoston to <strong>Cape</strong> <strong>Cod</strong> and is partially subsidized by the Massachusetts Bay <strong>Transportation</strong>Authority (MBTA), MassPort, and the <strong>Cape</strong> <strong>Cod</strong> <strong>Regional</strong> Transit Authority (CCRTA).FIGURE 12: PLYMOUTH AND KINGSTONSTREET RAILWAY CARFIGURE 13: PLYMOUTH AND BROCKTONSTREET RAILWAY CARFIGURE 14: AN OLDER BUS MODEL FROM FIGURE 15: AN OLDER BUS MODEL FROMPLYMOUTH AND BROCKTONPLYMOUTH AND BROCKTONSource: Plymouth & Brockton Street RailwayFIGURE 16: PLYMOUTH AND BROCKTON BUS AT THE HYANNIS TRANSPORTATION CENTERSource: Plymouth & Brockton Street RailwayChapter 2.3: Bus <strong>Transportation</strong> <strong>Cape</strong> <strong>Cod</strong> <strong>Regional</strong> <strong>Transportation</strong> <strong>Plan</strong> | August 2011Page 128
Current Plymouth and Brockton service stretches from Logan International Airport toProvincetown. There are two primary routes. The first route is between Hyannis andProvincetown. This route is operated 4 times daily in both directions during thesummer. The bus makes several stops along the Outer <strong>Cape</strong> route (See Table below).Plymouth and Brockton also offers a discounted taxi service for Outer <strong>Cape</strong> passengers.Passengers can request this service from the bus driver in Hyannis, who will then radiofor a taxi to meet passengers at their respective terminal.TABLE 1: PLYMOUTH AND BROCKTON, OUTER CAPE STOPSStop NameHyannisHarwichOrleansEasthamNorthEasthamSouthWellfleetWellfleetTruroNorth TruroProvincetownLocationHyannis <strong>Transportation</strong> CenterHarwich Park-and-Ride LotCVS @ Main St. & Route 6ATown Hall @ Rt. 6 and Samoset Rd.Village Green @ Rt. 6 and Brackett Rd.Farrell’s Market, Rt. 6Town Hall, Main St.Post Office and Jam’s Store, Route 6ADutra’s Market, Route 6AChamber of Commerce, MacMillan WharfThe second route is between Hyannis and points in Boston. Stops in Boston includeLogan International Airport, Park Square & 200 Stuart Street, and South Station<strong>Transportation</strong> Center. In addition, several stops are made along the way both on andoff <strong>Cape</strong> (See Table below). Generally, morning service is geared towards gettingpassengers from Hyannis to Boston, while afternoon service focuses on the return tip.During the summer, Plymouth and Brockton makes 23 one-way weekday trips fromHyannis to Logan International Airport. On the weekend, Plymouth and Brocktonmakes 17 trips. Plymouth and Brockton also makes 27 one-way weekday trips betweenHyannis and South Station during the summer. 19 of these trips stop at both Logan andSouth Station. Additionally, the bus makes 8 one-way weekday stops for commuters atthe <strong>Transportation</strong> Building at Park Square. Total operations are reduced during the falland winter to reflect the lower demand for travel.<strong>Cape</strong> <strong>Cod</strong> <strong>Regional</strong> <strong>Transportation</strong> <strong>Plan</strong> | August 2011Chapter 2.3: Bus <strong>Transportation</strong>Page 129
TABLE 2: PLYMOUTH AND BROCKTON, HYANNIS – BOSTON STOPSStop NameHyannisBarnstableSagamorePlymouthRocklandBostonBostonBostonLocationHyannis <strong>Transportation</strong> CenterBarnstable Park-and-Ride LotSagamore Park-and-Ride LotRt. 3 Exit 5 Info Center Park-and-Ride LotRt. 3 & Rt. 228 Park-and-Ride LotSouth Station <strong>Transportation</strong> CenterPark Square & 200 Stuart StreetLogan International AirportFIGURE 17: PLYMOUTH AND BROCKTON BUS ROUTESChapter 2.3: Bus <strong>Transportation</strong> <strong>Cape</strong> <strong>Cod</strong> <strong>Regional</strong> <strong>Transportation</strong> <strong>Plan</strong> | August 2011Page 130
2.3.4.2 Bonanza Bus Lines / Peter Pan Bus LinesGeorge Sage founded Bonanza Bus Lines in Newport, RI in 1955. Soon after thecompany began acquiring new bus lines and expanding service beyond its original 50-mile route system between Providence, Newport, and Fall River. Service to Hyannis wasadded in 1958. By 1965, the “Short Line,” as it was then called, had service to Boston,New Bedford, Springfield, and beyond. Bonanza became the largest independent busline in New England in 1974 when it began service from Hartford, CT to New York City.Service from Boston to Woods Hole, with connections to ferry service, began in 1978.After merging with Coach USA in 1998, the company was purchased by Peter Pan BusLines in 2003, along with three other New England affiliates of Coach USA. GeorgeSage, the original founder of the “Short Line” was brought back as a consultant to PeterPan, bringing the company full circle. Additionally, Peter Pan has partnered withGreyhound to provide ticketing services, more connections and increased service.Currently, the Bonanza Bus network, as operated by Peter Pan, includes a 1,560-mileroute system serving New England and beyond.FIGURE 18: PETER PAN BUS AT THE HYANNIS TRANSPORTATION CENTER<strong>Cape</strong> <strong>Cod</strong> <strong>Regional</strong> <strong>Transportation</strong> <strong>Plan</strong> | August 2011Chapter 2.3: Bus <strong>Transportation</strong>Page 131
Peter Pan and Bonanza Bus Lines provide two routes serving <strong>Cape</strong> <strong>Cod</strong>. The first route isbetween Woods Hole and Boston. Stops are made in Falmouth and Bourne. A total of 11round trips are made daily during the summer, as well as an early morning trip fromBoston to Woods Hole on weekdays and Saturdays. Service is reduced in the winter toreflect reduced demand.TABLE 3: PETER PAN / BONANZA, WOODS HOLE – BOSTON ROUTE STOPSStop NameWoods HoleFalmouthBourneBostonLocationSteamship Authority PiersFalmouth Bus Depot, Depot Ave.Tedeschi’s Food Shop, Trowbridge Rd.South Station <strong>Transportation</strong> CenterThe second route run by Peter Pan and Bonanza on <strong>Cape</strong> <strong>Cod</strong> is the Hyannis toProvidence, RI bus. Six round trips are made daily in the summer. Stops are made inBarnstable, Bourne, New Bedford, Fall River, and Providence. Of these trips, only twoearly morning stops are made at Kennedy Plaza in Providence, RI. Service is reduced inthe winter in order to accommodate demand.TABLE 4: PETER PAN / BONANZA, HYANNIS – PROVIDENCE ROUTE STOPSStop NameHyannisBarnstableBourneNew BedfordFall RiverProvidenceProvidenceLocationHyannis <strong>Transportation</strong> CenterBarnstable Park-and-Ride LotTedeschi’s Food Shop, Trowbridge Rd.SRTA Terminal, Elm StreetSRTA Terminal, Second StreetBonanza Bus TerminalKennedy PlazaConnections can be made at a number of stops along each route. For example, bustransportation to New York City is available after a transfer in Providence, RI. Moreover,the stop in Bourne allows a bus connection between Woods Hole and Hyannis. The trip,including transfer, would take anywhere between 1.5 and 2 hours.Chapter 2.3: Bus <strong>Transportation</strong> <strong>Cape</strong> <strong>Cod</strong> <strong>Regional</strong> <strong>Transportation</strong> <strong>Plan</strong> | August 2011Page 132
FIGURE 19: PETER PAN / BONANZA BUS ROUTES2.3.5 CAPE COD REGIONAL TRANSIT AUTHORITYThe <strong>Cape</strong> <strong>Cod</strong> <strong>Regional</strong> Transit Authority (CCRTA) is the agency in charge of operatingand maintaining public transit services on <strong>Cape</strong> <strong>Cod</strong>. According to the 2008 NationalTransit Database, the CCRTA service area is 395 square miles, covering the Barnstableurbanized zone and all of Barnstable County. The CCRTA is an independent publicagency, governed by a board of directors. The 15 <strong>Cape</strong> <strong>Cod</strong> towns each appoint oneboard member to represent their interests in the CCRTA. The CCRTA offers severaltypes of services, including Fixed Route service, Flexible Route service, and DemandResponse or Paratransit service. These services are not operated directly by the CCRTA,but are contracted.<strong>Cape</strong> <strong>Cod</strong> <strong>Regional</strong> <strong>Transportation</strong> <strong>Plan</strong> | August 2011Chapter 2.3: Bus <strong>Transportation</strong>Page 133
TABLE 5: CAPE COD LOCAL BUS SERVICE CONSUMPTIONAND SUPPLY, 2008The CCRTA fleet consists of95 buses and vans, with anaverage age of 4.6 years.Using this fleet, the CCRTArecorded 797,711 unlinkedtrips * in 2008. This is anincrease from the 778,430unlinked trips in 2007.These passengers werecarried 11,056,780 milesacross <strong>Cape</strong> <strong>Cod</strong> in 2008.The CCRTA fleet is run at91% capacity for fixed-routeservice, and roughly 95% forSource: 2008 National Transit Databasedemand response service,according to the National Transit Database.The CCRTA receives funding from multiple sources. Operations are funded by farerevenues, local funds, state funds, federal assistance, and contracts. These funds arethen spent on employee salaries and on purchased transportation (See Table on the nextpage). Ranging from a high of 42.9% in 1998 to a low of 3.5% in 2005, then rising andfalling to 9.5% in 2008, fare revenues have fluctuated as a percentage of total operatingfunds. To keep pace, state, federal, and local funding have increased as a percentage oftotal operating funds, partly due to subsidies for experimental ticketing services in theOuter <strong>Cape</strong>. Overall, this means that the CCRTA, as virtually all transit agencies are,continues to be dependent on external sources for its operations. The suddendisappearance of these funding sources may lead to a cutback in services.In 2006, the RTA released a new, simpler fare structure. A one-way trip cost $1, withdiscounts for senior citizens. Some transfers are free, while most cost $1. Monthly andSummer Day Passes are also available. Moreover, the fares are now uniform across theRTA system, making it easier for riders to understand and to use public transit. Thismay encourage more ridership and increase the amount collected in fares.* When passengers board a transit line without having made a transfer, this is referred to as anunlinked trip. It is a way to measure ridership without double counting.Chapter 2.3: Bus <strong>Transportation</strong> <strong>Cape</strong> <strong>Cod</strong> <strong>Regional</strong> <strong>Transportation</strong> <strong>Plan</strong> | August 2011Page 134
TABLE 6: FUNDING FOR OPERATIONS BY THE CCRTA, 2008Total Operating FundsTotal Operating ExpensesFareRevenuesLocalFundsStateFundsFederalFundsOtherFunds$1,050,612 9%Salary/Wages/Benefits $702,834 6.3%$1,406,354 13%Materials and Supplies $21,237 0.2%$3,446,324 31% Purchased$9,977,333 90.1%<strong>Transportation</strong>$2,122,176 19%Other Expenses $372,496 3.4%$3,048,434 28%Total $11,073,900 Total $11,073,900Source: 2008 National Transit DatabaseTABLE 7: FUNDING FOR CAPITAL IMPROVEMENTS BY THE CCRTA, 2008Total Capital FundsTotal Capital ExpensesLocal Funds $0 0% Revenue Vehicles $3,065,661 80%State FundsSystems and$0 0%$1,374,700 36%GuidewaysFederal FundsFacilities and$510,531 13%$2,479,010 64%StationsOther Funds $0 0% Other $277,518 7%Total $3,853,710 Total $3,853,710Source: 2008 National Transit Database<strong>Cape</strong> <strong>Cod</strong> <strong>Regional</strong> <strong>Transportation</strong> <strong>Plan</strong> | August 2011Chapter 2.3: Bus <strong>Transportation</strong>Page 135
$1,348$1,245 $1,273 $1,231$1,104Thousands$4,000$3,500$3,53750.0%45.0%$3,000$3,14140.0%35.0%$2,50030.0%$2,000$1,500$1,854$1,687$1,50325.0%20.0%$1,000$810$1,05115.0%10.0%$500$2775.0%$01996 1997 1998 1999 2000 2001 2002 2003 2004 2005 2006 2007 20080.0%Fare RevenuesFares as a Percent of Total RevenuesFIGURE 20: CCRTA FARE REVENUES AND FARES AS A PERCENT OF TOTAL REVENUESSource: 1996-2008 National Transit DatabaseFunding for capital improvements varies from year to year. For example, the CCRTAreceived millions of dollars in capital improvement funding from state and federalsources between 2001 and 2003 for the construction of the Hyannis <strong>Transportation</strong>Center. In 2008, the CCRTA received $3,065,661 from federal sources for capitalimprovements. That money was used to purchase new vehicles (See previous Table).The performance of the CCRTA can be measured in several different ways. In terms ofservice efficiency, it costs $2.95 for every mile the CCRTA travels and $49.94 for everyhour that the CCRTA operates. Moreover, the cost of transporting the average passengerhas been rising for the past four years. This increase can be partly attributed to the highcost of demand response services (Figure 22).Chapter 2.3: Bus <strong>Transportation</strong> <strong>Cape</strong> <strong>Cod</strong> <strong>Regional</strong> <strong>Transportation</strong> <strong>Plan</strong> | August 2011Page 136
TABLE 8: PERFORMANCE MEASURES FOR CAPE COD REGIONAL TRANSIT AUTHORITY, 2008CCRTABusDemandResponse OverallService EfficiencyOperating Expense perVehicle Revenue Mile$4.31 $2.43 $2.95Operating Expense perVehicle Revenue Hour$53.73 $47.65 $49.94Cost EffectivenessOperating Expense perPassenger Mile$0.61 $1.77 $1.00Operating Expense perUnlinked Passenger Trip$10.47 $17.84 $13.88Service EffectivenessUnlinked Passenger Tripsper Vehicle Revenue Mile0.41 0.14 0.21Unlinked Passenger Tripsper Vehicle Revenue Hour5.13 2.67 3.60Source: 2008 National Transit Database<strong>Cape</strong> <strong>Cod</strong> <strong>Regional</strong> <strong>Transportation</strong> <strong>Plan</strong> | August 2011Chapter 2.3: Bus <strong>Transportation</strong>Page 137
$3.50$3.00$3.08$2.95$2.50$2.31$2.44$2.50$2.59 $2.61 $2.65Expense per Mile$2.00$1.50$1.00$0.50$0.002001 2002 2003 2004 2005 2006 2007 2008YearFIGURE 21: OPERATING EXPENSE PER VEHICLE REVENUE MILESource: 2001-2008 National Transit DatabaseChapter 2.3: Bus <strong>Transportation</strong> <strong>Cape</strong> <strong>Cod</strong> <strong>Regional</strong> <strong>Transportation</strong> <strong>Plan</strong> | August 2011Page 138
$25.001,000,000900,000Expense in Dollars$20.00$15.00$10.00$5.00$8.87$11.11$12.63$13.31800,000700,000600,000500,000400,000300,000200,000Annual Number of Unlinked Trips100,000$0.00534,180 788,819 653,149 605,65002001 2002 2003 2004YearAnnual Number of Unlinked TripsExpense per Trip: OverallExpense per Trip: Fixed RouteExpense per Trip: Demand ResponseFIGURE 22: OPERATING EXPENSE PER UNLINKED PASSENGER TRIPSource: 2001-2008 National Transit Database<strong>Cape</strong> <strong>Cod</strong> <strong>Regional</strong> <strong>Transportation</strong> <strong>Plan</strong> | August 2011Chapter 2.3: Bus <strong>Transportation</strong>Page 139
FIGURE 23: CAPE COD REGIONAL TRANSIT AUTHORITY SYSTEM MAPSource: <strong>Cape</strong> <strong>Cod</strong> <strong>Regional</strong> Transit Authority2.3.6 FIXED ROUTE BUS SERVICEFixed Route bus service is the traditional form of transit. Vehicles follow specific routesand stop at designated areas. Fixed Route service on <strong>Cape</strong> <strong>Cod</strong> is slightly different, inthat CCRTA buses (with the exception of the Flex) stop anywhere along their route whenflagged. The CCRTA offers several fixed route services. All CCRTA fixed route buseshave bicycle racks, designed to carry two bicycles. In addition, all fixed route buses arewheelchair accessible and equipped with low floors, ramps or lifts. Service animals arethe only animals allowed to board the buses. The CCRTA offers four year-round andthree summer seasonal fixed-route services.Chapter 2.3: Bus <strong>Transportation</strong> <strong>Cape</strong> <strong>Cod</strong> <strong>Regional</strong> <strong>Transportation</strong> <strong>Plan</strong> | August 2011Page 140
2.3.6.1 Hyannis-Falmouth Service: “SeaLine”FIGURE 24: SEALINE ROUTE MAPSource: <strong>Cape</strong> <strong>Cod</strong> <strong>Regional</strong> Transit AuthorityTABLE 9: SEALINE RIDERSHIP, FY2009, FY2010FY’09 FY’10July 6,840 7,230August 7,707 7,465September 7,930 9,796October 7,583 9,203November 6,310 7,969December 6,593 8,168January 6,028 7,394February 6,294 6,680March 7,033 8,862April 6,696 8,913May 7,264 9,234June 7,368 10,293Total 83,646 101,207Avg. Riders / 558 675Day** - Assuming 250 Days of Operation (No Weekends, No Federal Holidays)Source: <strong>Cape</strong> <strong>Cod</strong> <strong>Regional</strong> Transit Authority<strong>Cape</strong> <strong>Cod</strong> <strong>Regional</strong> <strong>Transportation</strong> <strong>Plan</strong> | August 2011Chapter 2.3: Bus <strong>Transportation</strong>Page 141
FIGURE 25: SEALINE BUS PARKED NEAR JONES ROAD AND ROUTE 28The Hyannis-Falmouth service known as the SeaLine runs from the Hyannis<strong>Transportation</strong> Center to the Falmouth Mall on Route 28. Passengers can board the busat any of the 10 designated stops, or flag the driver anywhere along the route to stop.During the summer, the SeaLine makes 9 round trips, beginning at 5:30am and endingat 7:30pm. Buses are schedule to run every 90 minutes, with a complete one-way triptaking one hour and operating seven days per week. Service is reduced during the winterin order to reflect lower demand. The first two trips, made before 8:00am, skip theCenterville and Osterville stops, continuing straight down Route 28, and ending at theSteamship Authority Docks in Woods Hole. The SeaLine will also stop at the BarnstableMunicipal Airport upon request. The SeaLine connects to the WHOOSH Trolley inWoods Hole and to most other lines at the Hyannis <strong>Transportation</strong> Center. Freetransfers are available to the WHOOSH Trolley.Chapter 2.3: Bus <strong>Transportation</strong> <strong>Cape</strong> <strong>Cod</strong> <strong>Regional</strong> <strong>Transportation</strong> <strong>Plan</strong> | August 2011Page 142
2.3.6.2 Hyannis-Orleans Service: “H2O”FIGURE 26: HYANNIS TO ORLEANS “H2O” ROUTE MAPSource: <strong>Cape</strong> <strong>Cod</strong> <strong>Regional</strong> Transit Authority<strong>Cape</strong> <strong>Cod</strong> <strong>Regional</strong> <strong>Transportation</strong> <strong>Plan</strong> | August 2011Chapter 2.3: Bus <strong>Transportation</strong>Page 143
TABLE 10: H2O RIDERSHIP, FY 2009, FY 2010FY’09 FY’10July 8,832 9,379August 9,191 9,181September 8,224 9,247October 6,771 8,443November 5,362 6,804December 5,337 7,052January 5,176 6,687February 5,192 6,249March 5,737 7,694April 5,870 8,356May 7,052 9,259June 9,137 13,731Total 81,897 102,082Avg. Riders / 546 681Day** - Assuming 250 Days of Operation (No Weekends, No Federal Holidays)Source: <strong>Cape</strong> <strong>Cod</strong> <strong>Regional</strong> Transit AuthorityThe Hyannis-Orleans service, also known as the H2O Line, runs from the Hyannis<strong>Transportation</strong> Center to the Stop and Shop on Routes 28/6A in Orleans. Passengerscan board the bus at any of the 17 designated stops, or flag the driver anywhere along theroute to stop. During the summer, the Hyannis-Falmouth Breeze makes 8 round trips,beginning at 5:45am and ending at 6:30pm. Buses are scheduled to run about every 2hours, with the complete one-way trip taking 1 hour and 40 minutes and operate sevendays per week including holidays through Labor Day. Service is reduced during thewinter in order to reflect lower demand. During the Orleans to Hyannis trip, the busstops at the <strong>Cape</strong> <strong>Cod</strong> Hospital only upon request. Moreover, the bus travels and stopsonly on Route 28 before 8:00am. Passengers riding the Hyannis-Orleans Breeze cantransfer to the Flex at three locations in Harwichport and Orleans, and to most otherlines at the Hyannis <strong>Transportation</strong> Center.Chapter 2.3: Bus <strong>Transportation</strong> <strong>Cape</strong> <strong>Cod</strong> <strong>Regional</strong> <strong>Transportation</strong> <strong>Plan</strong> | August 2011Page 144
2.3.6.3 Barnstable VillagerFIGURE 27: BARNSTABLE VILLAGER BUSPARKED IN THE BARNSTABLE COUNTYCOMPLEX FIGUREFIGURE 28: ROUTE MAP FOR BARNSTABLE VILLAGERFIGURE 29: DETAIL OF CCRTA SERVICES INDOWNTOWN HYANNISSource: <strong>Cape</strong> <strong>Cod</strong> <strong>Regional</strong> Transit Authority<strong>Cape</strong> <strong>Cod</strong> <strong>Regional</strong> <strong>Transportation</strong> <strong>Plan</strong> | August 2011Chapter 2.3: Bus <strong>Transportation</strong>Page 145
TABLE 11: “VILLAGER” RIDERSHIP, FY 2009, FY 2010FY’09 FY’10July 5,286 3,688August 5,463 3,981September 3,892 4,339October 3,431 4,092November 2,994 3,491December 2,716 3,806January 2,531 3,092February 2,796 3,443March 2,840 3,552April 3,215 3,634May 3,267 3,243June 3,051 3,370Total 41,452 43,731Avg. Riders / 276 292Day** - Assuming 250 Days of Operation (No Weekends, No Federal Holidays)Source: <strong>Cape</strong> <strong>Cod</strong> <strong>Regional</strong> Transit AuthorityThe Barnstable Villager service runs from the Hyannis <strong>Transportation</strong> Center to theBarnstable County Complex on Route 6A and Barnstable Harbor. Passengers can boardthe bus at any of the 8 designated stops, or flag the driver anywhere along the route tostop. During the summer, the Barnstable Villager Breeze makes 26 round trips,beginning at 7:30am and ending at 9:30pm. Between 8:00am and 8:00pm, buses arescheduled to run every 30 minutes, with the complete one-way trip scheduled to take 50minutes seven days per week. Service is reduced during the winter in order toaccommodate lower demand. The Barnstable Villager will stop at the BarnstableMunicipal Airport upon request. Passengers riding the Villager can transfer to mostother lines at the Hyannis <strong>Transportation</strong> Center.2.3.6.4 Hyannis ShuttleThe Hyannis Shuttle is the summer service from the Hyannis <strong>Transportation</strong> Center toseveral beaches in the Hyannis area. Passengers can board the bus at any of the 6designated stops, or flag the driver anywhere along the route to stop. The HyannisShuttle makes 19 round trips, beginning at 8:00am and ending at 5:30pm. Buses arescheduled to run 30 minutes, with the complete round trip taking 30 minutes, 7 days perweek including holidays through Labor Day. Passengers riding the Hyannis Shuttle cantransfer to most other lines at the Hyannis <strong>Transportation</strong> Center.Chapter 2.3: Bus <strong>Transportation</strong> <strong>Cape</strong> <strong>Cod</strong> <strong>Regional</strong> <strong>Transportation</strong> <strong>Plan</strong> | August 2011Page 146
TABLE 12: HYANNIS SHUTTLE RIDERSHIP, FY 2009, FY 2010FY’09 FY’10July 7,939 3,545August 7,761 4,248September 292 693October - May -0- -0-June 178 440Total 16,170 8,926Source: <strong>Cape</strong> <strong>Cod</strong> <strong>Regional</strong> Transit Authority2.3.6.5 Provincetown/Truro ShuttleThe Shuttle serves Downtown Provincetown, Provincetown Airport, Race Point Beach,Herring Cove Beach, and North Truro. Three routes comprise the Shuttle service. TheNorth Truro Shuttle travels from MacMillan Pier to Dutra’s Market in North Truro. TheAirport/Race Point Beach Shuttle runs from MacMillan Pier to Provincetown MunicipalAirport and Race Point Beach. The Herring Cove Beach Shuttle runs from MacMillanPier to Herring Cove Beach and First Pilgrims Park. During the summer, shuttles runevery 20 minutes, between 9:00am and 12:45am. From 7:00am to 9:00am, the NorthTruro Shuttle runs every 60 minutes. The Shuttle runs seven days a week, includingholidays. During the off-season, the Shuttle continues operation seven days a week, butbeach stops are eliminated and shuttle frequencies are reduced. There is no Shuttleservice during the winter months. Passengers riding the North Truro Shuttle maytransfer to the Flex bus for free at Dutra’s Market in North Truro.<strong>Cape</strong> <strong>Cod</strong> <strong>Regional</strong> <strong>Transportation</strong> <strong>Plan</strong> | August 2011Chapter 2.3: Bus <strong>Transportation</strong>Page 147
TABLE 13: PROVINCETOWN/TRURO SHUTTLE RIDERSHIP, FY 2009, FY 2010FY’09 FY’10July 20,739 22,819August 25,873 27,046September 3,553 6,789October - April -0- -0-May 1,491 1,422June 4,856 8,025Total 56,512 66,098Source: <strong>Cape</strong> <strong>Cod</strong> <strong>Regional</strong> Transit AuthorityFIGURE 30: PROVINCETOWN SHUTTLE ROUTE MAPSource: <strong>Cape</strong> <strong>Cod</strong> <strong>Regional</strong> Transit Authority2.3.6.6 The WHOOSH TrolleyThe WHOOSH Trolley, or the Woods Hole Trolley, runs from the Falmouth Mall to theSteamship Authority Docks in Woods Hole. Passengers can board the bus at any of the10 designated stops, or flag the driver anywhere along the route to stop. During thesummer, the WHOOSH Trolley schedule varies by day, making at least 20 trips per daybetween 9:30am and 7:30pm. Buses are scheduled to run every 30 minutes, with thecomplete round trip taking 1 hour. Service is available on Saturdays, Sundays, andholidays. There is no winter service due to the lower demand. Service to the FalmouthBus Depot is available upon request. Free transfers are available to the Hyannis-Falmouth Breeze.Chapter 2.3: Bus <strong>Transportation</strong> <strong>Cape</strong> <strong>Cod</strong> <strong>Regional</strong> <strong>Transportation</strong> <strong>Plan</strong> | August 2011Page 148
TABLE 14: WHOOSH TROLLEY RIDERSHIP, FY 2009, FY 2010FY’09 FY’10July 8,647 10,187August 11,289 10,367September 225 1,594October - AprilMayJune 1,812 1,837Total 21,973 23,985Source: <strong>Cape</strong> <strong>Cod</strong> <strong>Regional</strong> Transit AuthorityFIGURE 31: THE WHOOSH TROLLEY ROUTE MAPSource: <strong>Cape</strong> <strong>Cod</strong> <strong>Regional</strong> Transit Authority<strong>Cape</strong> <strong>Cod</strong> <strong>Regional</strong> <strong>Transportation</strong> <strong>Plan</strong> | August 2011Chapter 2.3: Bus <strong>Transportation</strong>Page 149
2.3.7 DEMAND RESPONSE BUS SERVICEDemand response bus service, also known as paratransit, addresses the needs ofpassengers who cannot use standard transit services. Demand response buses do not usea route system, but instead pick up passengers at scheduled locations and times, often attheir homes or offices.2.3.7.1 B-Bus ServiceThe B-Bus operates year round, seven days a week, with the exception of some holidays.In order to use the service, passengers must call the RTA at least one day in advanceduring normal business hours to schedule a pick up and drop off. A telecommunicationsdevice is available for the hearing impaired. Users must be flexible with their pick upand drop off times, in order to allow the driver time to pick up other users. Priorityservice is given to elderly and disabled users.The B-Bus fare system operates on a pre-paid account system. B-Bus operators informusers how much their ride will cost, and then deduct it from their account. When theaccount needs refilling, operators will inform the user. Fares are usually explained whenusers call to schedule service. Regular users will be advised what their average monthlyride costs are so as to allow them to deposit enough money into their pre-paid account.Many passengers use the B-Bus to get to work or school, shopping trips, doctor’sappointments, and even trips to medical centers in Boston. Each B-Bus can carry up to19 passengers. Utilizing 60 buses, the B-Bus comprises a major portion of the CCRTA’sservices and carries over 300,000 passengers a year.2.3.7.2 ADA Paratransit ServiceThe Americans with Disabilities Act (ADA) is a federal law passed in 1990, which statesthat individuals with disabilities are entitled to a comparable level of publictransportation service as individuals without disabilities. In order to comply with theADA, the CCRTA offers a demand response, or paratransit, that is comparable to theirfixed route services. This paratransit service operates within ¾ mile of existing routesand runs during the same hours as existing bus services. Trips may be requested duringnormal business hours. This new service is referred to as ADA Paratransit Service.The service is available to people with physical, mental, cognitive, and visualimpairments that prevent them from boarding or disembarking fixed route services,from recognizing destinations, from understanding bus transfers, or from distinguishingbetween different buses in different routes. Residents who think they may qualify areencouraged to contact the CCRTA to request an application.Chapter 2.3: Bus <strong>Transportation</strong> <strong>Cape</strong> <strong>Cod</strong> <strong>Regional</strong> <strong>Transportation</strong> <strong>Plan</strong> | August 2011Page 150
2.3.8 FLEXIBLE ROUTE BUS SERVICE: “THE FLEX”FIGURE 32: FLEX ROUTE MAPSource: <strong>Cape</strong> <strong>Cod</strong> RTA<strong>Cape</strong> <strong>Cod</strong> <strong>Regional</strong> <strong>Transportation</strong> <strong>Plan</strong> | August 2011Chapter 2.3: Bus <strong>Transportation</strong>Page 151
TABLE 15: “FLEX” SERVICE RIDERSHIP, FY 2009, FY 2010FY’09 FY’10July 11,317 10,850August 11,679 11,670September 4,163 5,761October 2,764 3,191November 2,083 2,213December 1,997 2,143January 1,813 2,065February 1,540 1,888March 1,952 2,424April 2,364 3,011May 3,083 3,829June 5,318 7,519Total 50,073 56,564Avg. Riders / 334 377Day** - Assuming 250 Days of Operation (No Weekends, No Federal Holidays)Source: <strong>Cape</strong> <strong>Cod</strong> RTAFlexible route service combines fixed route service and demand response service. Aflexible route bus will have an established route, but can also be ‘flexible’ and makedeviations from its route to pick up and drop off passengers. The Flex is the flexibleroute service offered by the CCRTA.The Flex route stretches from Harwichport to North Truro. The route is extended toProvincetown during the winter while the Shuttle service is suspended. Along this route,the Flex picks up passengers at any of 18 designated stops. Of these 18 designated stops,7 are “Main Stops.” This means that the Flex bus always makes a stop, usually withinfive minutes of schedule. The remaining 11 stops are “In-Between Stops,” and the Flexonly stops when a passenger is waiting, or to drop off a passenger by request. The timeof these stops vary.The bus can also “flex” off its route up to ¾ of a mile to pick up passengers who cannotreach a regular stop. Users must call the RTA at least two hours in advance in order toschedule a Flex bus pick up or drop off. The fare for a one-way “off-route trip” is $2.TTY service is available for the deaf or hearing impaired.Each Flex Bus is 12 feet wide and 29 feet long, with a seating capacity of 25.Additionally, each bus has bio-diesel capability. Low floors and hydraulic drops provideaccessibility to disabled users. Bicycle racks on the front of the Flex bus can carry up totwo bicycles.Chapter 2.3: Bus <strong>Transportation</strong> <strong>Cape</strong> <strong>Cod</strong> <strong>Regional</strong> <strong>Transportation</strong> <strong>Plan</strong> | August 2011Page 152
FIGURE 33: A FLEX BUS PARKED AT THE HYANNIS TRANSPORTATION CENTERDuring the summer, the Flex bus is scheduled to make 28 trips per day between 6:00amand 8:00pm. Buses are scheduled to run every 30 minutes, with a one-way trip taking 1hour and 50 minutes. Service is available seven days a week in the summer. Service isreduced during the winter in order to reflect lower demand. Transfers are available tothe Hyannis-Orleans Breeze and Plymouth and Brockton service. Free transfers areavailable to the North Truro Shuttle.2.3.9 GREATER ATTLEBORO-TAUNTON REGIONAL TRANSIT AUTHORITYThe Greater Attleboro-Taunton <strong>Regional</strong> Transit Authority (GATRA) is the agency incharge of operating and maintaining public transit services for 17 member communitiesin Southeastern Massachusetts. According to the National Transit Database, GATRA’sservice area is 72 square miles and includes Attleboro, Middleborough, Plymouth,Taunton, and Wareham. GATRA also serves <strong>Cape</strong> <strong>Cod</strong> with the Onset-Wareham Link(OWL), with stops in Bourne.<strong>Cape</strong> <strong>Cod</strong> <strong>Regional</strong> <strong>Transportation</strong> <strong>Plan</strong> | August 2011Chapter 2.3: Bus <strong>Transportation</strong>Page 153
The OWL is a fixed route bus service, comprised of 4 “links” or routes, serving Warehamand Bourne. Link 2 connects Route 6/28, Onset Village, and Bourne. The three stops in<strong>Cape</strong> <strong>Cod</strong> are Main Street in Buzzards Bay, Tedeschi’s on Trowbridge Road, and BourneOaks. Link 2 runs buses every hour from 8:00am to 6:30pm, Monday through Saturday.This amounts to 10 buses daily. There is no service on Sunday. The last two buses of theday do not stop at Bourne Oaks. Like the fixed route RTA services, passengers can boardat any point on the route by waving down the driver. Fares are $1 for a one-way trip,with discounts for the elderly, the disabled, students, and children. Monthly passes arealso available. Via the OWL service, those living and working in Buzzards Bay areconnected to Southeastern Massachusetts and to interregional bus service at Tedeschi’son Trowbridge Road.FIGURE 34: GATRA ONSET WAREHAM LINK SERVICESource: Greater Attleboro Taunton <strong>Regional</strong> Transit Authority2.3.10 BUS TRANSPORTATION ACCESSIBILITYBus transportation accessibility refers to how easy it is to reach and to use transit.Accessible transit is located within walking distance (one-half mile or less) or in placesthat are convenient to other modes of transportation. Moreover, accessible transitaccommodates all users, making it easy to understand route and stop information,purchase tickets, board, ride, and get off. There are many different ways in which theseconcerns are addressed on <strong>Cape</strong> <strong>Cod</strong>.Chapter 2.3: Bus <strong>Transportation</strong> <strong>Cape</strong> <strong>Cod</strong> <strong>Regional</strong> <strong>Transportation</strong> <strong>Plan</strong> | August 2011Page 154
Local bus transit services cover key populations and areas on <strong>Cape</strong> <strong>Cod</strong>. According to adetailed analysis performed for the 2007 RTP, of the 412 square miles in BarnstableCounty, 36.5% are within one-half mile of local bus transit services. As far as populationcoverage, 45.4% of Barnstable County residents are within one-half mile of local bustransit services. The areas and populations covered are mainly along the Route 28corridor and Route 6 in the Outer <strong>Cape</strong>. However, some population centers in Bourne,Falmouth, Dennis, and Sandwich are not being addressed (Figure 35). Routes along Route 6A and Route 28A could fill these gaps in service. Yet,even though almost half of <strong>Cape</strong> <strong>Cod</strong>’s population is located near transit services, the2000 census reports that only 1.22% of residents use transit to commute. Therefore,other factors must be reducing the desirability of transit.TABLE 16: LAND AND PERSONS NEAR TRANSIT ROUTES, BREAKOUT BY TOWN AND BY REGIONPopulation (2000 Census) Area (mi 2 )% Within % Within% WithinTotalTotal¼ Mile ½ Mile¼ Mile% Within½ MileBarnstable 47,821 40.4% 58.2% 62.63 21.5% 35.8%Bourne 18,721 10.1% 19.7% 41.29 4.4% 8.4%Brewster 10,094 68.0% 74.0% 25.43 51.6% 61.9%Chatham 6,625 46.0% 79.1% 17.05 24.9% 45.2%Dennis 15,973 17.4% 30.6% 21.05 11.4% 22.8%Eastham 5,453 93.9% 98.1% 14.35 71.2% 85.3%Falmouth 32,660 20.5% 39.6% 45.93 12.4% 23.6%Harwich 12,386 74.1% 86.4% 22.58 66.2% 80.4%Mashpee 12,946 8.3% 16.3% 25.79 7.3% 15.7%Orleans 6,341 50.0% 68.0% 14.47 36.9% 50.7%Provincetown 3,431 87.2% 98.5% 9.85 31.2% 54.8%Sandwich 20,136 0.0% 0.0% 44.01 0.0% 0.0%Truro 2,087 93.3% 96.4% 21.71 61.0% 76.7%Wellfleet 2,749 94.8% 97.7% 20.32 64.3% 74.5%Yarmouth 24,807 21.7% 33.0% 25.32 16.0% 24.6%Upper <strong>Cape</strong> 84,463 11.5% 22.2% 157.03 6.0% 11.7%Mid-<strong>Cape</strong> 88,601 31.0% 46.2% 109.27 18.2% 30.7%Lower <strong>Cape</strong> 35,446 62.8% 78.2% 79.53 47.3% 61.5%Outer <strong>Cape</strong> 13,720 92.3% 97.9% 66.24 59.8% 74.6%All <strong>Cape</strong> <strong>Cod</strong> 222,230 32.4% 45.4% 412.07 25.9% 36.5%Sources: U.S. Census and <strong>Cape</strong> <strong>Cod</strong> <strong>Regional</strong> Transit Authority, 2007 RTP<strong>Cape</strong> <strong>Cod</strong> <strong>Regional</strong> <strong>Transportation</strong> <strong>Plan</strong> | August 2011Chapter 2.3: Bus <strong>Transportation</strong>Page 155
The transportation needs of some population groups must be considered in particular.Environmental justice populations include low income households, foreign bornresidents, non-English speaking residents, and minorities. Environmental Justicepopulation areas are determined by the U.S. Census Bureau. On <strong>Cape</strong> <strong>Cod</strong>, allenvironmental justice population centers are served by at least one local bus transitroute. However, the connections and destinations of those transit routes may stillimpede environmental justice populations. For example, the population in Buzzards Bayhas access to the OWL service. Yet, that service does not connect to any other local busservice on <strong>Cape</strong> <strong>Cod</strong>. Surveys are needed to determine where environmental justicepopulations want to go, so that transit services can be tailored to their needs.FIGURE 35: LAND AND PERSONS NEAR TRANSIT ROUTESSources: U.S. Census and <strong>Cape</strong> <strong>Cod</strong> <strong>Regional</strong> Transit AuthorityChapter 2.3: Bus <strong>Transportation</strong> <strong>Cape</strong> <strong>Cod</strong> <strong>Regional</strong> <strong>Transportation</strong> <strong>Plan</strong> | August 2011Page 156
FIGURE 36: ENVIRONMENTAL JUSTICE POPULATIONS NEAR TRANSIT ROUTESSources: U.S. Census and <strong>Cape</strong> <strong>Cod</strong> <strong>Regional</strong> Transit Authority<strong>Cape</strong> <strong>Cod</strong> <strong>Regional</strong> <strong>Transportation</strong> <strong>Plan</strong> | August 2011Chapter 2.3: Bus <strong>Transportation</strong>Page 157
FIGURE 37: ELDERLY AND MINOR POPULATIONS NEAR TRANSIT ROUTESSources: U.S. Census and <strong>Cape</strong> <strong>Cod</strong> <strong>Regional</strong> Transit AuthorityAs a group with no transportation options of their own, teenagers also deserveconsideration when discussing transit services. Because they are not yet old enough todrive, children between 12 and 16 years old must rely on parents for transportation. Byproviding teenagers access to local bus transit services, they are able to travel moreindependently and more often. Teenagers use transit services to commute to school,work, participate in extra-curricular activities, and to meet with friends. Where transitservices are available, parents also have greater flexibility because they will not alwaysneed to drive their children to all of these destinations.Many children aged 12 to 16 are served by local bus services on <strong>Cape</strong> <strong>Cod</strong>. In the Outer<strong>Cape</strong>, the Flex bus provides transit services to students at Nauset High School. In 2006,35% of all Flex riders were between the ages if 12 and 16. Moreover, many teenagers arelocated less than one-half mile from a transit route (Figure 37). However, someteenagers in areas such as North Dennis and parts of the Upper <strong>Cape</strong> are not beingserved. Providing local bus services to these populations will help them to become moreindependent and more active.Chapter 2.3: Bus <strong>Transportation</strong> <strong>Cape</strong> <strong>Cod</strong> <strong>Regional</strong> <strong>Transportation</strong> <strong>Plan</strong> | August 2011Page 158
The transit needs of the elderly must also be addressed. Due to their limited mobility,senior citizens must often rely upon transit services to reach shopping centers, doctors’offices, and even employment. In many cases, senior citizens may not be able to walk toa bus stop or may need special assistance to board and ride. According to the U.S.Census, 23.1% of <strong>Cape</strong> <strong>Cod</strong> residents are over 65 years of age (compared to the statewideaverage of 13.5%). Local bus services seek to address these issues. All local buses arewheelchair accessible, as are many of the P&B interregional buses. Additionally, the Flexbuses have low floors and a ramp that can be lowered for those who need it. Seniorcitizens also receive a discounted fare. The transit routes themselves reach many elderlypopulations and destinations, especially in the Outer and Lower <strong>Cape</strong>. The Flex bus andB-Bus services can also meet elderly riders at their door. Moreover, because they aregiven priority, even senior citizens living away from fixed route services have access totransit through the B-Bus. As a result, the elderly on <strong>Cape</strong> <strong>Cod</strong> have good access totransit services.Many of the same issues confronting the elderly also restrict transit access for thedisabled. Reduced pricing, wheelchair accessible buses and demand response servicesare helpful. On the OWL bus, personal care assistants may ride for free if they registerwith GATRA. Moreover, both the RTA and GATRA have DDT information lines for thehearing impaired. Many improvements can still be made. Signs and other informationneed to be produced in large print and Braille for the visually impaired. Bus stops andshelters located on major roadways need to have crosswalks and pedestrian signals, withaudible and visual crossing cues. This will enable all users to access bus stops safely. Byimproving access for everyone, more people will be able and willing to ride transitservices.Much of <strong>Cape</strong> <strong>Cod</strong> is connected by bus transportation. The Route 28 and Outer <strong>Cape</strong>Route 6 corridors are well served by local transit. Long distance routes to Boston andProvidence are also well covered by interregional service. There is also mobility betweenpopulation centers such as Hyannis, Falmouth, Orleans and Provincetown. However,local bus services in Bourne have no mobility beyond Buzzards Bay. Much of Bourne,Sandwich and North Dennis are also unserved by transit. Addressing these gaps willconnect more users to more destinations and improve mobility.Examining specific stops on each local bus route shows that bus services are reachingmany popular destinations. These destinations include shopping centers, beaches,senior and community centers, town halls, and post offices, and other transportationmodes such as air and ferry. Moreover, the number of destinations available to the useris increased by the ability to wave down or stop a bus anywhere on its route. This type ofservice provides a great deal of mobility in areas where commercial and residentialactivity is disparate.Transit services on <strong>Cape</strong> <strong>Cod</strong> also connect users to many other forms of transportation.All park-and-ride lots, except Sagamore, also serve as stops for local and interregional<strong>Cape</strong> <strong>Cod</strong> <strong>Regional</strong> <strong>Transportation</strong> <strong>Plan</strong> | August 2011Chapter 2.3: Bus <strong>Transportation</strong>Page 159
service. Moreover, connections to local bus services are available at all interregional busstops on <strong>Cape</strong> <strong>Cod</strong>, except the Sagamore Park-and-Ride Lot. Many bicycle paths androutes, such as the <strong>Cape</strong> <strong>Cod</strong> Rail Trail, Shining Sea Bike Path, and Claire SaltonstallBikeway, are also located near local and interregional transit stops. All ferry terminalsare within one-half mile of transit services. Local bus routes are available to allcommercial airports offering passenger carrier service. In this way, transit connects andintegrates all other forms of transportation on <strong>Cape</strong> <strong>Cod</strong>.While some bus transportation on <strong>Cape</strong> <strong>Cod</strong> operates on a regular and frequent basis,some does not. Interregional bus service operates on a regular and well publishedschedule. Several P&B and Peter Pan buses run daily to Boston and Providence, oftenevery hour. The Flex bus has also met much success, partly due to the regularity of itsschedule. However, other local bus services, such as the Hyannis-Falmouth line are notfrequent enough for many riders. Traffic on major roadways also delays many localbuses, such as the Barnstable Villager, making them less dependable. Offering morebuses in a more dependable manner will improve rider mobility and encourage morepeople to use transit services.Chapter 2.3: Bus <strong>Transportation</strong> <strong>Cape</strong> <strong>Cod</strong> <strong>Regional</strong> <strong>Transportation</strong> <strong>Plan</strong> | August 2011Page 160
2.3.11 CAPE COD REGIONAL TRANSIT AUTHORITY VISIONDuring the public outreach for development of the RTP, the <strong>Cape</strong> <strong>Cod</strong> <strong>Regional</strong> TransitAuthority shared information on progress made to improve public transportation andproposals to improve it further:2.3.11.1 Projects Accomplished with Prior FundingNew hourly service on fixed-route servicesCreation of a Mobility Management VisionCreated a Multi-Modal Taskforce to improve seamless inter-modal connectionsLaunched an upgraded CCRTA website (http://www.capecodrta.org/)Simplified the b-bus fare: Created an easier billing structure that eliminatesfuture ridesProvided 17 Mobility Assistance Program (MAP) vehicles to various townsthroughout <strong>Cape</strong> <strong>Cod</strong>Have begun construction of <strong>Cape</strong> <strong>Cod</strong> style bus shelters throughout <strong>Cape</strong> <strong>Cod</strong>Upgraded paratransit software to provide state-of-the-art optimization ofschedulingPurchased two Inter-City Bus Replacements (public-private partnerships forinter-regional connections)Awarded a contract for electronic fare systems that are interoperable with theMBTA’s Charlie Card and parking management systemsWorking with the Volpe National <strong>Transportation</strong> Systems Center and the <strong>Cape</strong><strong>Cod</strong> National Seashore to improve parking management in the lower cape, usingadvanced technology.2.3.11.2 Projects We Must Accomplish through the Long-Range<strong>Regional</strong> <strong>Transportation</strong> <strong>Plan</strong> Mobility Management <strong>Transportation</strong> Call CenterThe <strong>Cape</strong> <strong>Cod</strong> <strong>Regional</strong> Transit Authority (CCRTA) will incorporate the latesttechnology into a one-stop transportation traveler call center to coordinatetransportation on all travel modes and to manage eligibility and specialtransportation requirements for a coordinated human services transportationbrokerage. Mobility management is a strategic approach to service coordination andcustomer service with the CCRTA assuming a broader role in coordinating the fullrange of mobility services in the <strong>Cape</strong> <strong>Cod</strong> tourist economy that promotes greaterefficiency and increased service effectiveness using public transportation resources. Energy Efficient Paratransit VehiclesThe CCRTA will purchase ten (10) accessible minibuses for a revitalized paratransitservice that will coordinate human services transportation and general public dial-a-<strong>Cape</strong> <strong>Cod</strong> <strong>Regional</strong> <strong>Transportation</strong> <strong>Plan</strong> | August 2011Chapter 2.3: Bus <strong>Transportation</strong>Page 161
ide transportation (DART) in underserved or high demand regions of <strong>Cape</strong> <strong>Cod</strong>,particularly for elderly individuals and persons with disabilities. Expansion of Next-Gen Mobile Data Terminals to ParatransitThe CCRTA will deploy the latest mobile data technology in their paratransit fleet,including state-of-the-art displays, global positioning systems (GPS), automaticvehicle location (AVL) systems, in-vehicle navigation systems, and digital drivermanifests and mobile data collection on passenger services. This equipment supportsthe mobility management call center functions by providing real-time informationfor dial-a-ride passengers on the location of their scheduled vehicle. Next Bus Stop Announcements and Automatic Passenger Counting.The CCRTA will build on the state-of-the-art mobile data terminals (MDTs) andcomputer assisted scheduling and dispatching systems (CASD) to add technology tothe MDTs to provide next bus stop announcements/displays on board regional andlocal fixed route services. Automatic passenger counters will also be attached to theMDTs, freeing the driver from manually counting passengers and yielding improvedservice planning data. Web 2.0 Integrated Intermodal Traveler Information over the WebThe CCRTA will provide a number of customer enhancements using the latestinternet technology, including intermodal trip planning, displays at malls andintermodal terminals that provide real-time mapping of transit vehicle locations,estimated time of arrival (ETA), real-time displays for major destinations andmultimodal terminals, ETA displays at bus shelters, and smartphone applications. MBTA-Compatible Electronic Fare Systems on Transit and Inter-City BusesThe CCRTA is deploying an electronic fare system (EFS) on all CCRTA fixed routeand paratransit vehicles that will be interoperable with the Massachusetts BayTransit Authority. <strong>Plan</strong>s are underway at the state-level that will deploy this EFSsystem on inter-city buses connecting <strong>Cape</strong> <strong>Cod</strong> with Boston, Providence and NewYork City as well as cities throughout Massachusetts. Ultimately, this electronicpayment system will include parking as well as transit components, promoting a carlesson <strong>Cape</strong> <strong>Cod</strong> experience. Construction of Enhanced Bus SheltersThe CCRTA is building and deploying architecturally appropriate <strong>Cape</strong> <strong>Cod</strong> style busshelters that are intelligent, accessible, and energy efficient. These improvements area part of the Transit Enhancement Initiative on <strong>Cape</strong> <strong>Cod</strong> to increase ridership,provide real-time customer information and amenities that make using transit easierand more convenient for the consumer, particularly for individuals with disabilities. Operational Assistance for Dial-A-Ride <strong>Transportation</strong> (DART).This CCRTA initiative will provide 100% ARRA operating assistance to support newdrivers and support staff to drive the ten new vehicles purchase in task 2.02 (above)that will provide dial-a-ride transportation (DART) in underserved and high demandareas of <strong>Cape</strong> <strong>Cod</strong>. In particular, this revitalized <strong>Cape</strong> <strong>Cod</strong> RTA DART service willbenefit the growing population of elderly individuals and persons with disabilitiesChapter 2.3: Bus <strong>Transportation</strong> <strong>Cape</strong> <strong>Cod</strong> <strong>Regional</strong> <strong>Transportation</strong> <strong>Plan</strong> | August 2011Page 162
through a coordinated service of human service transportation and general publicdial-a-ride transportation.2.3.12 CONCLUSIONBus transportation is a major form of public transportation on <strong>Cape</strong> <strong>Cod</strong>. Plymouth andBrockton and Peter Pan / Bonanza serve the interregional needs of the <strong>Cape</strong>, while theCCRTA and GATRA serve the local needs. The Hyannis <strong>Transportation</strong> Center,Falmouth Bus Depot, MacMillan Wharf, park-and-ride lots, and other locations serve asbus stops and transfer points. Yet, despite the availability of transit, only 1.22% of <strong>Cape</strong><strong>Cod</strong> residents use transit to commute to work. The highest public transportation usageis in Sandwich, where workers use interregional bus service to commute to Boston. Withthe introduction of new services, such as the Flex, transit use may increase compared toautomobile usage. For example, a 2006 survey indicated that 20.7% of Flex ridersreported that they were making trips to work. Further improving accessibility andmobility for bus transportation users on <strong>Cape</strong> <strong>Cod</strong> will encourage more people to usetransit and reduce the number of people driving alone over <strong>Cape</strong> <strong>Cod</strong>’s roads.<strong>Cape</strong> <strong>Cod</strong> <strong>Regional</strong> <strong>Transportation</strong> <strong>Plan</strong> | August 2011Chapter 2.3: Bus <strong>Transportation</strong>Page 163
Chapter 2.3: Bus <strong>Transportation</strong> <strong>Cape</strong> <strong>Cod</strong> <strong>Regional</strong> <strong>Transportation</strong> <strong>Plan</strong> | August 2011Page 164
2.4 RAIL TRANSPORTATIONRail <strong>Transportation</strong> on <strong>Cape</strong> <strong>Cod</strong> has a history of over 150 years. Currently, there are53.8 miles of track on <strong>Cape</strong> <strong>Cod</strong>, with different segments owned by the MassachusettsDepartment of <strong>Transportation</strong> and federal agencies.2.4.1 HISTORY OF RAILROADS ON CAPE CODIn 1848, the first railroad tracks on <strong>Cape</strong> <strong>Cod</strong> were laid from Middleboro to Sandwich bythe <strong>Cape</strong> <strong>Cod</strong> Branch Railroad. After tracks were built as far as Hyannis andYarmouthport in 1854, the <strong>Cape</strong> <strong>Cod</strong> Branch Railroad became the <strong>Cape</strong> <strong>Cod</strong> Railroad. In1865, railroad tracks were built from Yarmouthport to Orleans. These tracks wereacquired by the <strong>Cape</strong> <strong>Cod</strong> Railroad three years later. As rail service increased during themid-1800s, sailing packets and stage coaches became less numerous. Tracks reachedWoods Hole and Provincetown in 1872 as <strong>Cape</strong> <strong>Cod</strong> Railroad merged with Old Colonyand Newport to become the OldColony Railroad. The Harwichand Chatham Spur, which wasthe final segment of rail trackbuilt on <strong>Cape</strong> <strong>Cod</strong>, was completedin 1887. The Old Colony Railroadwas leased to New York, NewHaven, and Hartford Railroad in1894. In 1910, the Buzzards BayRailroad Bridge was completedover the first <strong>Cape</strong> <strong>Cod</strong> Canal,which was under construction.After the canal was widened in1933-35, a new railroad bridgewas constructed. At the time, theFIGURE 1 - EXISTING RAILROAD BRIDGE SPANNINGTHE CANALvertical lift railroad bridge wasthe longest of its kind in theworld.After a century of expansion, rail on <strong>Cape</strong> <strong>Cod</strong> saw a dramatic decline. The introductionof the automobile, a poor economy, and war led to the decline of rail service on <strong>Cape</strong><strong>Cod</strong>. Regular passenger service to Provincetown was suspended in 1938. Then, between1950 and 1959, the Mid-<strong>Cape</strong> Highway was constructed between Sagamore and Orleans.The Mid-<strong>Cape</strong> Highway allowed automobiles greater access to the <strong>Cape</strong> than before, andgreater competition with rail services. In 1957, rail service to Woods hole wasdiscontinued. Two years later, decreased ridership put an end to year round passengerrail service on <strong>Cape</strong> <strong>Cod</strong>. Freight trains continued service until the mid-1960s. <strong>Cape</strong> <strong>Cod</strong>railroad tracks were traded to the bankrupt Penn Central in 1969 and purchased by the<strong>Cape</strong> <strong>Cod</strong> <strong>Regional</strong> <strong>Transportation</strong> <strong>Plan</strong> | August 2011Chapter 2.4: RailPage 165
Commonwealth of Massachusetts in 1976. According to the Massachusetts Departmentof Conservation and Recreation (DCR), the station houses were razed or vandalizedfollowing the rail’s decline in usage. Rail tracks from Provincetown to Route 134 inDennis were dismantled and a portion of the rail right-of-way was converted into the<strong>Cape</strong> <strong>Cod</strong> Rail Trail by the DCR. According to the history provided by the FalmouthBikeways Committee, tracks from Palmer Avenue in Falmouth to the ferry terminal inWoods Hole were converted into the Shining Sea Bikepath in 1976. In 2009, the ShiningSea Bikepath was extended northward, creating a total of 10.7 miles of paved path.Further segments are slated for conversion to bikepaths including a segment fromDennis to Station Avenue in Yarmouth. Today, The Massachusetts Department of<strong>Transportation</strong> (MassDOT) owns the majority of rail tracks on <strong>Cape</strong> <strong>Cod</strong>, with othersections of track owned by the federal government or Army Corps of Engineers.FIGURE 2: MAP SHOWING CAPE COD RAILROADS, CIRCA 1880Source: www.capetrain.org/history.phpA weekend-only summer train known as the “<strong>Cape</strong> <strong>Cod</strong>der” was offered by Amtrak from1986 until 1996 under contract with the Commonwealth of Massachusetts. The servicetraveled overnight between New York City and Hyannis, with intermediate stops inChapter 2.4: Rail <strong>Cape</strong> <strong>Cod</strong> <strong>Regional</strong> <strong>Transportation</strong> <strong>Plan</strong> | August 2011Page 166
Wareham, Buzzards Bay, and Sandwich. During the summer of 1988, Amtrak alsooffered service from New York City to Falmouth, but discontinued the service when statesubsidies were discontinued. Low ridership prevented the continued success of the“<strong>Cape</strong> <strong>Cod</strong>der” service. In 1995, Amtrak forced passengers to transfer in Providence,leading to a drop in ridership of almost three-quarters. The <strong>Cape</strong> <strong>Cod</strong> Transit TaskForce’s Five-Year Public <strong>Transportation</strong> <strong>Plan</strong> states the “<strong>Cape</strong> <strong>Cod</strong>der” service wasdiscontinued in 1996. According that report, resumption of this service is noteconomically feasible for the foreseeable future due to financial and equipmentconstraints, as well as a lack of subsidy.The Commonwealth had contracted with the <strong>Cape</strong> <strong>Cod</strong> & Hyannis Railroad to provideservice to Boston from Hyannis and Falmouth for approximately 3-5 years in the 1980s.Service was discontinued when the state went into recession.2.4.2 RAIL INFRASTRUCTUREFIGURE 3: CAPE COD RAIL LINE AND BRANCHESThere are many ways to consider rail infrastructure on <strong>Cape</strong> <strong>Cod</strong>. One way is to think ofrail tracks as a series of lines and branches. Much like the way the roots of a tree feed thetrunk with nutrients and water, the branches of a railroad feed the mainline with railtraffic. <strong>Cape</strong> <strong>Cod</strong> has a single rail line, the <strong>Cape</strong> <strong>Cod</strong> Line, with three branches.<strong>Cape</strong> <strong>Cod</strong> <strong>Regional</strong> <strong>Transportation</strong> <strong>Plan</strong> | August 2011Chapter 2.4: RailPage 167
Together, they form a network of rail infrastructure which serves the freight andrecreational needs of <strong>Cape</strong> <strong>Cod</strong> residents and visitors.TABLE 1: RAIL TRACKS ON CAPE CODTotalMi.Percentof Total<strong>Cape</strong> <strong>Cod</strong> Total 53.8By Rail Line <strong>Cape</strong> <strong>Cod</strong> Line 32.0 59.5%Hyannis Branch 4.4 8.2%Otis Branch 10.4 19.3%Woods Hole Branch 7.0 13.0%By Owner Federally Owned 9.8 18.2%Army Corps of Engineers 0.2 0.3%MassDOT 43.8 81.4%By Town Barnstable 11.2 20.8%Bourne 14.4 26.8%Dennis 1.2 2.2%Falmouth 4.0 7.4%Mashpee 0.4 0.8%Sandwich 14.8 27.5%Yarmouth 7.8 14.5%2.4.2.1 <strong>Cape</strong> <strong>Cod</strong> LineWaterways and railroad branches divide the <strong>Cape</strong> <strong>Cod</strong> Line into four segments. The firstsegment is located in Buzzards Bay in Bourne. Tracks start at a bridge over the CohassetNarrows and run to the foot of the <strong>Cape</strong> <strong>Cod</strong> Canal Railroad Bridge (Figure 4 and Figure5). This segment is owned by the Massachusetts Department of <strong>Transportation</strong>(MassDOT) and leased to <strong>Cape</strong> Rail, Inc. According to a study done for the <strong>Cape</strong> <strong>Cod</strong>Transit Task Force, these tracks are rated for 30 MPH travel. The Bourne Chamber ofCommerce currently occupies the former Buzzards Bay Station building south of MainStreet (Figure 6). The rail platform at this station is still in existence, as well as a switchleading to an out of service side track. Formerly, a short spur ran east into what is nowBridge Park. In total, the segment is 0.71 miles long, has two bridges over the CohassetNarrows and <strong>Cape</strong> <strong>Cod</strong> Canal, and one road crossing at Academy Ave.Chapter 2.4: Rail <strong>Cape</strong> <strong>Cod</strong> <strong>Regional</strong> <strong>Transportation</strong> <strong>Plan</strong> | August 2011Page 168
FIGURE 4: RAIL TRACKS LEADING SOUTH TOTHE CAPE COD CANAL BRIDGEFIGURE 5: RAIL TRACKS LEADING NORTH TOTHE COHASSET NARROWSFIGURE 6: OLD DEPOT STATION, CURRENTLY BOURNE CHAMBER OF COMMERCEThe <strong>Cape</strong> <strong>Cod</strong> Line continues over the <strong>Cape</strong> <strong>Cod</strong> Canal Railroad Bridge to the CanalJunction where the Woods Hole Branch splits off the south. It is here that the secondsegment of the <strong>Cape</strong> <strong>Cod</strong> Line continues, following the <strong>Cape</strong> <strong>Cod</strong> Canal and then runningalongside Route 6A through Sandwich and Barnstable. Out of service side tracks andformer stations can be seen in West Barnstable. Only a platform remains in SandwichStation, located off of Jarves Street. West Barnstable Station, located on Route 149 inBarnstable, has been preserved even though it is no longer in use. The <strong>Cape</strong> <strong>Cod</strong> Linecontinues to the Yarmouth wye at Willow Street in Yarmouth. Here, the Hyannis Branchturns south, while the <strong>Cape</strong> <strong>Cod</strong> Line continues to the east. An out of service anddisconnected segment of track sits to the north of the main line and stretches several<strong>Cape</strong> <strong>Cod</strong> <strong>Regional</strong> <strong>Transportation</strong> <strong>Plan</strong> | August 2011Chapter 2.4: RailPage 169
hundred feet on either side of Willow Street (Figure 11). MassDOT owns this segmentof the <strong>Cape</strong> <strong>Cod</strong> Line, from the <strong>Cape</strong> <strong>Cod</strong> Canal to Yarmouthport, and leases it to <strong>Cape</strong>Rail, Inc. The Transit Task Force study also rated this segment for 30 MPH travel. Intotal, the segment contains 23.31 miles of track, one bridge over Mill Creek in Sandwich,4 grade separated roadway crossings, and 40 total roadway crossings.FIGURE 7: RAIL TRACKS WEST OF THESAGAMORE BRIDGEFIGURE 8: RAIL TRACKS EAST OF MARY DUNNRD. IN BARNSTABLEFIGURE 9: RAIL TRACKS AND SWITCH WESTOF WILLOW STREET IN YARMOUTHFIGURE 10: RAIL CROSSING AT WILLOWSTREET IN YARMOUTH, FACING EASTEast of Willow Street, the <strong>Cape</strong> <strong>Cod</strong> Line continues towards Dennis on its third segment.This is the easternmost section of railroad still in use on <strong>Cape</strong> <strong>Cod</strong>. It extends fromWillow Street in Yarmouth to the Yarmouth Waste Management Facility just west ofStation Avenue. The connection to the Waste Management Facility can be made fromthe mainline in either direction. As with the rest of the <strong>Cape</strong> <strong>Cod</strong> Line, MassDOT ownsthis entire segment and leases it to <strong>Cape</strong> Rail, Inc. In total, the segment contains 3.38miles of track, the grade separated crossing of Route 6, and 23 total roadway crossings.Chapter 2.4: Rail <strong>Cape</strong> <strong>Cod</strong> <strong>Regional</strong> <strong>Transportation</strong> <strong>Plan</strong> | August 2011Page 170
FIGURE 11: AN OUT OF SERVICE TRACK RUNSSEVERAL HUNDRED FEET ON EITHER SIDE OFWILLOW STREET IN YARMOUTHFIGURE 12: RAIL TRACKS EAST OF WILLOWSTREET IN YARMOUTHFIGURE 13: RAIL TRACKS IN YARMOUTH,FACING WEST.THE SHINY METAL SURFACE OF THE RAILTRACKS INDICATES THEIR CONTINUED USE.FIGURE 14: RAIL TRACKS IN YARMOUTH WESTOF STATION AVENUE.ALONG WITH THE STOP SIGN, STOPPERS ONTHE TRACKS PREVENT TRAINS FROM GOINGTOO FAR.The last segment of the <strong>Cape</strong> <strong>Cod</strong> line, starts at the Yarmouth Waste ManagementFacility east of Station Avenue and crosses the Bass River via a bridge. The <strong>Cape</strong> <strong>Cod</strong>Line used to continue all the way to Provincetown, with the Chatham Branch startingwest of Route 124 in Harwich. However, the tracks were dismantled and a portion of theright-of-way was converted into the <strong>Cape</strong> <strong>Cod</strong> Rail Trail, which serves bicycle users andrecreational purposes. Currently, however, the <strong>Cape</strong> <strong>Cod</strong> Line extends as far as Route134 in Dennis. This final segment of track is out of service, abandoned, and not usableby train. Vegetation has encroached upon the rail tracks, crossing signals have been leftin disrepair, and road crossings have been paved over (Figure 16). MassDOT owns theright-of-way and is negotiating a lease with the towns of Yarmouth and Dennis. <strong>Plan</strong>s<strong>Cape</strong> <strong>Cod</strong> <strong>Regional</strong> <strong>Transportation</strong> <strong>Plan</strong> | August 2011Chapter 2.4: RailPage 171
for the westerly extension of the Rail Trail through Yarmouth to Willow Street arecurrently under design.FIGURE 15: RAIL TRACKS EAST OF STATIONAVENUE IN YARMOUTHFIGURE 16: RAIL TRACKS EAST OF GREATWESTERN ROAD, YARMOUTH.THE RAIL TRACKS HAVE BEEN PAVED OVER,WHILE VEGETATION AND A BOULDER BLOCKTHE WAY.FIGURE 17: BASS RIVER RAIL BRIDGE, FACINGWESTFIGURE 18: OUT OF SERVICE RAIL TRACKSWEST OF ROUTE 134 IN DENNISIn sum, the <strong>Cape</strong> <strong>Cod</strong> Line is the backbone of rail service on <strong>Cape</strong> <strong>Cod</strong>. It stretches 31.09miles, and includes 3 bridges over waterways, 8 grade separated roadway crossings, and51 total roadway crossings. The <strong>Cape</strong> <strong>Cod</strong> Line forms the majority of regional railinfrastructure. It serves as the only access to <strong>Cape</strong> <strong>Cod</strong> by rail, and is used by both MassCoastal freight services and <strong>Cape</strong> <strong>Cod</strong> Central Railroad.Chapter 2.4: Rail <strong>Cape</strong> <strong>Cod</strong> <strong>Regional</strong> <strong>Transportation</strong> <strong>Plan</strong> | August 2011Page 172
2.4.2.2 Hyannis BranchThe Hyannis Branch begins at the Yarmouth wye at Willow Street in Yarmouth andtravels south. The historic Hyannis Roundhouse, located between Route 28 and MainStreet in Barnstable, has been converted into a nightclub and warehouses. The rail yardis now used for the Hyannis <strong>Transportation</strong> Center and as a rail yard for CCCRR. Arestaurant and a furniture store now occupy part of the site. The terminus of theHyannis Branch is a station for the CCCRR. Originally, the Hyannis Branch continuedfrom the rail yard south to a port facility in the Outer Harbor of Hyannis Harbor. Theport and rail connection were dismantled however, and the right of way converted intoOld Colony Road. MassDOT owns the Hyannis Branch and leases it to <strong>Cape</strong> Rail, Inc.This segment has also been rated for 30 MPH travel. In total, the Hyannis Branchcontains 4.39 miles of track, 2 grade separated crossings under Route 6, and 6 totalroadway crossings.FIGURE 19: RAIL TRACKS WEST OF WILLOWSTREET, FACING NORTHFIGURE 20: THE HYANNIS RAIL YARD, WITHCCCRR CARS PARKED ON THE SIDE TRACKS<strong>Cape</strong> <strong>Cod</strong> <strong>Regional</strong> <strong>Transportation</strong> <strong>Plan</strong> | August 2011Chapter 2.4: RailPage 173
FIGURE 21: THE TERMINUS OF THE HYANNIS BRANCH AT THE CCCRR STATION2.4.2.3 Woods Hole BranchThe Woods Hole Branch begins at the Canal Junction, splitting off from the <strong>Cape</strong> <strong>Cod</strong>Line and traveling south through Bourne and Falmouth. Three depot stations along theroute, in Monument Beach, Pocasset, and Cataumet, have been converted to other uses.The tracks continue south to the Otis Junction just south of Old County Road inFalmouth (Figure 22). An out of service side track, runs from Old Main Road to the OtisJunction (Figure 23). MassDOT owns this entire segment and leases it to <strong>Cape</strong> Rail, Inc.Moreover, this portion of the Woods Hole Branch has been rated for 30 MPH travel. Intotal, the segment contains 8.43 miles of track, 2 bridges over waterways, 5 gradeseparated roadway crossings, and 17 total road crossings.Chapter 2.4: Rail <strong>Cape</strong> <strong>Cod</strong> <strong>Regional</strong> <strong>Transportation</strong> <strong>Plan</strong> | August 2011Page 174
FIGURE 22: RAIL TRACKS AT THE OTISJUNCTION.THE LEFT TRACK RUNS EAST TO THE OTISAIR FORCE BASE. THE RIGHT TRACK RUNSSOUTH TO PALMER AVENUE AND THE END OFTHE SHINING SEA BIKE PATH.FIGURE 23: RAIL TRACKS NORTH OF OLDCOUNTY ROAD IN FALMOUTHThe final segment of the Woods Hole Branch runs from the Otis Junction to the overpassat the southern crossing of Palmer Avenue. These tracks are out of service and notusable by train. Vegetation has encroached upon the rail tracks, crossing signals havebeen left in disrepair, and road crossings have been paved over (Figure 24, Figure 25and Figure 26). MassDOT has sold the right-of-way to the Town of Falmouth to beconverted to an extension of the Shining Sea Bike Path. In total, the segment contains5.82 miles of track, a bog sluiceway north of Fox Lane, 4 grade separated roadwaycrossings, and 14 road crossings.Originally, the Woods Hole Line continued south with stations at Depot Street and thecurrent Steamship Authority port at Woods Hole. Originally built in 1872, this section ofthe Woods Hole line has been dismantled. The station at Depot Street now serves as abus terminal, while the right-of-way has been converted into the Shining Sea Bikepath.<strong>Cape</strong> <strong>Cod</strong> <strong>Regional</strong> <strong>Transportation</strong> <strong>Plan</strong> | August 2011Chapter 2.4: RailPage 175
FIGURE 24: A BUSH GROWS IN THE MIDDLEOF THE WOODS HOLE LINEFIGURE 25: A CROSSING SIGNAL AT OLD DOCKROAD OVERGROWN WITH VEGETATIONFIGURE 26: THE WOODS HOLE LINE HAS BEENPAVED OVER AT OLD DOCK ROADFIGURE 27: OTIS BRANCH RAIL TRACKS, EASTOF ROUTE 28A2.4.2.4 Otis BranchFrom the Otis Junction, the Otis Branch runs east into the Otis Air Force Base (Figure27). Inside the base, the track splits into several terminals, with one track running as fareast as Mashpee. The entire set of track is federally owned, with use by <strong>Cape</strong> Rail, Inc.In total, the segment contains 10.51 miles of track, 3 grade separated roadway crossings,and 15 total roadway crossings.2.4.2.5 <strong>Cape</strong> <strong>Cod</strong> Canal Railroad BridgeIn order to enter <strong>Cape</strong> <strong>Cod</strong>, trains must cross the <strong>Cape</strong> <strong>Cod</strong> Railroad Bridge (Figure 28).In 1910, the Buzzards Bay Railroad Bridge was completed over the first <strong>Cape</strong> <strong>Cod</strong> Canal,which was under construction at the time. When the canal was reconstructed in 1933, anew railroad bridge had to be built over the widened waterway. Since the railroad gradecould not be easily raised, the Army Corps of Engineers constructed a vertical liftChapter 2.4: Rail <strong>Cape</strong> <strong>Cod</strong> <strong>Regional</strong> <strong>Transportation</strong> <strong>Plan</strong> | August 2011Page 176
ailroad bridge. The new bridge was completed in December of 1935 and was the longestbridge of its kind at the time. Recently, the <strong>Cape</strong> <strong>Cod</strong> Railroad Bridge underwent amajor rehabilitation effort, in large part through $25 million in Federal funds. Normallythe bridge remains in the “up” position (Figure 30), allowing marine traffic access through the canal, and is lowered for railservice as needed. Marine traffic has statutory right-of-way over rail traffic. A panel inthe bridge’s control room allows the controller to raise and lower the bridge. Themechanisms to control the interlocking rail, however, are located within the BuzzardsBay Tower in Buzzards Bay, Bourne (Figure 29). The bridge is 806 feet long, 297 feethigh and has a high water clearance of 136 feet.FIGURE 28: AERIAL VIEW OF THE CAPE CODRAILROAD BRIDGEFIGURE 29: BUZZARDS BAY TOWER HOUSING RAILCONTROL MECHANISMS<strong>Cape</strong> <strong>Cod</strong> <strong>Regional</strong> <strong>Transportation</strong> <strong>Plan</strong> | August 2011Chapter 2.4: RailPage 177
FIGURE 30: CAPE COD RAILROAD BRIDGE FROM BRIDGE PARK, IN THE “UP” POSITIONFIGURE 31: RAIL INFRASTRUCTURE AND OWNERSHIP ON CAPE CODChapter 2.4: Rail <strong>Cape</strong> <strong>Cod</strong> <strong>Regional</strong> <strong>Transportation</strong> <strong>Plan</strong> | August 2011Page 178
2.4.3 SIGNALS AND CROSSINGSTABLE 2: RAIL INFRASTRUCTURE THROUGHOUT CAPE CODRailroad Crossingsat <strong>Cape</strong> <strong>Cod</strong> RoadsTotalGradeSeparatedGatedSignalizedSignedOther\None<strong>Cape</strong> <strong>Cod</strong> Total 102 22 4 26 19 31<strong>Cape</strong> <strong>Cod</strong> Line 62 10 3 20 11 18Hyannis Branch 6 2 1 - 1 2Otis Branch 15 3 - - 2 10Woods Hole Branch 19 7 - 6 5 1Locally Owned 13 4 - 5 3 1Federally Owned 15 3 - 2 - 10MassDOT 73 15 4 27 13 14Barnstable 18 1 3 8 4 2Bourne 27 11 - 6 5 5Dennis 3 - - - - 3Falmouth 6 4 - 1 - 1Sandwich 33 2 1 11 3 16Yarmouth 15 4 - 1 6 4Exclusive rights-of-way can limit the interaction of rail and other modes, makingrail transportation safer and faster. However, crossing at roadways can poseproblems if the intersection is not properly signed and designed. Currently on<strong>Cape</strong> <strong>Cod</strong>, there are 66 at-grade roadway intersections along active rail lines.Some, such as the railroad crossing at Route 28 in Barnstable, can actuallyinterfere with roadway traffic and cause congestion and delays. Of those, 21 arenot gated, signalized or signed. Although most of these are minor roadways, theydo represent a potential for mishap. Moreover, there are 18 grade separatedroadway crossings, as well as 5 bridges over waterways along active rail lines.These bridges and overpasses must be maintained in order to ensure continueduse. If rail service on <strong>Cape</strong> <strong>Cod</strong> is to be increased, further study of railroadcrossings may be necessary to ensure safety and prevent interruptions to roadwaytraffic.<strong>Cape</strong> <strong>Cod</strong> <strong>Regional</strong> <strong>Transportation</strong> <strong>Plan</strong> | August 2011Chapter 2.4: RailPage 179
2.4.4 FREIGHT SERVICEFIGURE 32: MASS COASTAL RAILROAD CAPE COD SERVICEFreight service is the primary use of <strong>Cape</strong> <strong>Cod</strong>’s rails. After many years of suspended railservice, CONRAIL formed in 1976 to provide freight service. CONRAIL owned the railtracks on the <strong>Cape</strong> <strong>Cod</strong> Line as far as Sandwich and worked under contract with theCommonwealth of Massachusetts for tracks beyond that point. After CONRAILannounced plans to suspend <strong>Cape</strong> <strong>Cod</strong> freight service in 1981, the Commonwealth ofMassachusetts purchased the affected lines. It then contracted Bay Colony Railroad totake over freight service in 1982. The Commonwealth of Massachusetts, throughMassDOT, still owns most railroad tracks on <strong>Cape</strong> <strong>Cod</strong> today, with MassachusettsCoastal Railroad (a company of <strong>Cape</strong> Rail, Inc.) operating under contract to providefreight service.Currently, the primary use of <strong>Cape</strong> <strong>Cod</strong>’s rails is for freight transportation by MassCoastal. Mass Coastal is a short line freight railroad serving <strong>Cape</strong> <strong>Cod</strong> and southeasternMassachusetts between Middleboro, Otis Air Force Base, Hyannis, and South Yarmouth.The majority of <strong>Cape</strong> <strong>Cod</strong>’s solid waste is transported to the SEMASS trash-to-energyplant in Rochester, MA via Mass Coastal’s Energy Train. Other freight Mass Coastalcarries includes food, construction materials, chemicals, heavy equipment amongstmany other things.Chapter 2.4: Rail <strong>Cape</strong> <strong>Cod</strong> <strong>Regional</strong> <strong>Transportation</strong> <strong>Plan</strong> | August 2011Page 180
FIGURE 33: MASS COASTAL ENERGY TRAINSource: www.masscoastal.com/train-energy.php2.4.5 PASSENGER SERVICECurrently, the only passenger service on <strong>Cape</strong> <strong>Cod</strong> is a scenic/dinner train offered by<strong>Cape</strong> <strong>Cod</strong> Central Railroad – a subsidiary of <strong>Cape</strong> Rail, Inc. There is, however, plans foroffering a commuter line from Buzzards Bay to Middleboro, where passengers could thencross a platform and board a train to Boston. The ride from Buzzards Bay to Boston isexpected to take one hour and twenty-five minutes. The plan proposes eight connectingtrains, including two morning and two evening peak period trains. The initiation of thisplan will require coordination between <strong>Cape</strong> Rail, Inc. and the MBTA.Tourist/Dinner Trains<strong>Cape</strong> <strong>Cod</strong> Central Railroad (CCCRR) formed in 1999 to provide recreational train serviceto <strong>Cape</strong> <strong>Cod</strong>. Today the CCCRR still provides a variety of Dinner and Scenic trainservices. The Hyannis Station is currently used by the CCCRR for selling tickets,dispensing information, and administrative offices. Adjacent to the single main trackstation is the Hyannis rail yard and maintenance facility (Figure 21). The CCCRR owns three engines (Table 3). Engines 1501 and 1502 werebuilt by General Motors’ Electro-Motive Division (EMD) in 1952 and serve as CCCRR’sprimary motive power (Figure 35). Engine 1201, nicknamed “Lulubell,” was built in 1951by American Locomotive Company (ALCo) and serves CCCRR as a backup engine(Figure 36). These three engines move the various excursion trains offered by CCCRR.<strong>Cape</strong> <strong>Cod</strong> <strong>Regional</strong> <strong>Transportation</strong> <strong>Plan</strong> | August 2011Chapter 2.4: RailPage 181
FIGURE 34: CAPE COD CENTRAL RAILROAD SERVICE<strong>Cape</strong> <strong>Cod</strong> Central Railroad offers Scenic Excursion Train service from the Hyannis<strong>Transportation</strong> Center to Canal Junction and Sandwich stations. On occasion, the trainwill also stop at the West Barnstable station on the corner of Routes 149 and 6A.Hyannis and Sandwich stations are the only passenger stops. Scenic Excursion, Lunchand Dinner Train service begins in May and lasts until the end of October. During Juneand July, train service runs with greater frequency. Scenic excursion trains consist ofone of CCCRR’s engines and three coach cars. The coach cars are 82’ long and 10’4”wide. Each of the former Long Island Railroad 2700 Series Commuter Cars seatsapproximately 60 people. They are named “Barnstable,” “Sandwich,” and “Bourne,” thetowns where the train makes stops. A variety of different cars are used for the Lunch andDinner Trains (see Table 4). In addition to the engine and the cars, the diningexcursions utilize a Kitchen / Generator Car. This car powers all of the electric lamps onboard the passenger cars and provides a kitchen for the cooking staff to prepare meals.Tickets vary in cost from $17 to $60 depending on the type of rail service.Chapter 2.4: Rail <strong>Cape</strong> <strong>Cod</strong> <strong>Regional</strong> <strong>Transportation</strong> <strong>Plan</strong> | August 2011Page 182
TABLE 3: ENGINES IN THE CAPE COD CENTRAL RAILROAD FLEETEngineNo.: Engine HorsepowerDimensions(L x W x H)Weight(Tons)DateBuilt1501EMD 567B diesel16 cylinder, 2 1,500 55’9” x 10’3” x 14’6” 120 1952cycle1502EMD 567B diesel16 cylinder, 2 1,500 55’9” x 10’3” x 14’6” 120 1952cycle1201EMD 645BCdiesel 12 cylinder,2 cycle1,200 56’ x 10’2” x 14’6” 120 1951Source: www.capetrain.com/rosterFIGURE 35: DIAGRAM FOR ENGINES 1501 AND 1502FIGURE 36: DIAGRAM FOR ENGINE 1201<strong>Cape</strong> <strong>Cod</strong> <strong>Regional</strong> <strong>Transportation</strong> <strong>Plan</strong> | August 2011Chapter 2.4: RailPage 183
TABLE 4: RAIL CARS IN THE CAPE COD CENTRAL RAILROAD FLEETName“<strong>Cape</strong>-<strong>Cod</strong>der”Lounge Car“Sandy Neck”Dining Car“Great Island”Dining Car“Race Point”Dining CarKitchen /Generator CarCar No.PassengerCapacity History Service20016 at tables, Former IL Central24 at lounge seats Lounge CarDinner Train201 64 seated at tablesBuilt by CC&F in Lunch and1937 Dinner Trains202 64 seated at tablesBuilt by CC&F in Lunch and1937 Dinner Trains203 64 seated at tablesBuilt by CC&F in Lunch and1942. Dinner Trains250 NoneBuilt by Chicago,Lunch andBurlington, andDinner TrainsQuincy in 1957.Source: www.capetrain.com/rosterDue to the limited number of scheduled trips and stops, as well as the cost of a ticket,CCCRR service is not practical for use by commuters. Instead, the CCCRR train serviceis geared primarily for tourists. During the 2000 season, 50,000 passengers rode therails, representing a 300 percent increase from the 16,000 passengers in 1999 (<strong>Cape</strong> <strong>Cod</strong>Transit Task Force).2.4.6 RAIL ACCESSIBILITY, MOBILITY AND CONNECTIVITYCurrently, the accessibility and mobility of rail service is limited. Sandwich and WestBarnstable Stations are both accessible only by road, with on-site parking facilities. Ofthe three active passenger stations, only the Hyannis Station is accessible by publictransportation. From the Hyannis <strong>Transportation</strong> Center, rail passengers can transfer tolocal and interregional bus service, as well as make connections to air and ferry service.If passenger rail service on <strong>Cape</strong> <strong>Cod</strong> is expanded, improved access and connections toother transportation modes may need to be provided at rail stations.The disabled and elderly are not wholly accommodated by rail service. All rail stationsinclude shelters, benches, and handicapped parking. The Hyannis <strong>Transportation</strong>Center, recently constructed, was built to meet the Americans with Disabilities Act(ADA) specifications. Difficulty occurs when boarding trains. Raised platforms andramps help, in addition to assistance offered by conductors and railroad staff. Inaddition, large print and Braille signage are necessary at stations and in train cars.Based on a review of the existing rail network it is clear that much of <strong>Cape</strong> <strong>Cod</strong> is notconnected by rail. Rail connections exist only in the Upper and Mid-<strong>Cape</strong>. Increasingthe number of rail connections will be limited to whether rights-of-way can be acquiredChapter 2.4: Rail <strong>Cape</strong> <strong>Cod</strong> <strong>Regional</strong> <strong>Transportation</strong> <strong>Plan</strong> | August 2011Page 184
for the construction of rail tracks. Given the current rails-to-trails trend, furtherexpansion seems unlikely at the current time. In this case, connectivity and mobilityissues will have to be addressed by improving rail service and connections to othermodes of travel. Rail mobility is limited by the current scenic train service, which isdesigned for tourism, not commuting. A passenger can only use the service to travelbetween Sandwich and Hyannis Stations. Destinations and passenger mobility will needto be addressed in any plan to expand rail service.2.4.7 CONCLUSIONRail service has a long and rich history on <strong>Cape</strong> <strong>Cod</strong>. The region’s early growth was inpart brought about by the railroad. Many miles of usable track still exist on <strong>Cape</strong> <strong>Cod</strong>,intersecting the roads and waterways. MassDOT owns the majority of rail tracks on<strong>Cape</strong> <strong>Cod</strong>, but some tracks are owned by federal agencies. Currently though, only theMass Coastal freight service and the CCCRR scenic train service operate on <strong>Cape</strong> <strong>Cod</strong>.Proposals currently exist to connect Buzzards Bay to Middleboro, which would give <strong>Cape</strong>passengers access to Boston. If passenger rail service were to be resumed, upgradeswould be necessary to the tracks, stations, and signals. Moreover, issues of accessibility,mobility and connectivity would need to be addressed. Funding for these improvementswould need to be identified and secured. As many tracks are converted in bicycle paths,the future of rail on <strong>Cape</strong> <strong>Cod</strong> is still uncertain.<strong>Cape</strong> <strong>Cod</strong> <strong>Regional</strong> <strong>Transportation</strong> <strong>Plan</strong> | August 2011Chapter 2.4: RailPage 185
Chapter 2.4: Rail <strong>Cape</strong> <strong>Cod</strong> <strong>Regional</strong> <strong>Transportation</strong> <strong>Plan</strong> | August 2011Page 186
2.5 WATER TRANSPORTATIONThe primary form of public water transportation on <strong>Cape</strong> <strong>Cod</strong> is ferry service, carryingpassengers between the mainland and the islands of Martha’s Vineyard and Nantucket.A significant amount of freight is carried by water transportation as well. As a result, theregion’s seaports and channels are vital in addressing the economic and transportationneeds of <strong>Cape</strong> <strong>Cod</strong>.2.5.1 CAPE COD SEAPORTS<strong>Cape</strong> <strong>Cod</strong> has 586 miles of tidal coastline, with many inlets and bays that provide marineaccess to the land. Seaports have been constructed along several of these bays and inletsto facilitate the transfer of people and goods from water to land transportation.Significant <strong>Cape</strong> <strong>Cod</strong> seaports are recognized in reports by the Army Corps of Engineers,the agency that maintains many of them. These and other seaports are discussed in thissection.2.5.1.1 Woods Hole HarborWoods Hole Harbor, located in Falmouth, is a primary seaport for <strong>Cape</strong> <strong>Cod</strong>. It is splitinto two harbors by Juniper Point: Great Harbor and Little Harbor (Figure 2 and Figure3). Little Harbor is located in the 550,000 square feet of water between Juniper andNobska Points. In 1906, the Army Corps of Engineers completed a 1,600 foot-longchannel from the Little Harbor to Vineyard Sound, as well as a turning basin. The CoastGuard widened and deepened both projects in the 1960s to a depth of 17 feet and a widthof 200 and 400 feet respectively. Located on the western side of Little Harbor is a CoastGuard station, which is also used for recreational purposes. Great Harbor is locatedbetween Penzance Point and Juniper Point. A bascule drawbridge separates GreatHarbor from Eel Pond to the north. Woods Hole Channel, which leads west to BuzzardsBay, connects at the southern end of Great Harbor. Many piers are located throughoutthe harbor, each with their own anchorages. Of the more significant ones are the 15-footdeep anchorage for the Steamship Authority ferries and the 22-foot deep anchorage forthe Woods Hole Oceanographic Institute. Great Harbor is home to ferry passengerservice, charter and sport fishing services, research vessels, and recreational boats.Charts of various ports shown in the following figures were produced by the NationalOceanic and Atmospheric Administration’s Coast and Geodetic Survey.<strong>Cape</strong> <strong>Cod</strong> <strong>Regional</strong> <strong>Transportation</strong> <strong>Plan</strong> | August 2011Chapter 2.5: Water <strong>Transportation</strong>Page 187
FIGURE 1: FALMOUTH HARBORFIGURE 2: A SECTION OF GREAT HARBOR, WOODSHOLE IN FALMOUTHFIGURE 3: LITTLE HARBOR, WOODS HOLEIN FALMOUTHFIGURE 4: PROVINCETOWN HARBORChapter 2.5: Water <strong>Transportation</strong> <strong>Cape</strong> <strong>Cod</strong> <strong>Regional</strong> <strong>Transportation</strong> <strong>Plan</strong> | August 2011Page 188
2.5.1.2 Hyannis HarborFIGURE 5: HYANNIS HARBORHYANNIS HARBOR IN BARNSTABLE IS CAPE COD’S OTHER PRIMARY SEAPORT. IT CONSISTSOF AN OUTER HARBOR, A MIDDLE HARBOR (KNOWN AS LEWIS BAY), AND AN INNER HARBOR (Figure 5). Dunbar Point, a 1,000-foot stone jetty, and the Kalmus Park Beach separatethe Outer Harbor and Lewis Bay. Major boat terminals and piers are located within theInner Harbor. The Army Corps of Engineers began construction projects in the harborin 1882. Currently, Hyannis Harbor includes a 12-foot deep anchorage at the easternend of the Inner Harbor. In Lewis Bay, there is a 15.5-foot deep anchorage of about 55acres behind a 1,170-foot long breakwater at Dunbar Point. A 6,000-foot long channel,12 feet deep and 100 feet wide, extends from the Inner Harbor into the deep water inLewis Bay. From there, a 7,200-foot long channel extends to the Outer Harbor. HyannisHarbor is used as a terminal for ferry service, freight service, charter, and sport fishingservices, as well as for recreational purposes.2.5.1.3 Provincetown HarborProvincetown Harbor was initially constructed during the nineteenth century. In 1914,the Army Corps of Engineers completed improvements to the harbor, including a 6,150-foot dike from Stevens Point across the House Point Island Flats to the sandy spit atWood End. A stone breakwater, built in 1972, runs parallel to the shore about 835 feetfrom the end of MacMillan Wharf. The breakwater is 15.5 feet high and 2,500 feet long.Currently, the harbor is used as a terminal for ferries, whale watching tours, and as abase of operations for fishing boats (Figure 4). Local and state officials have discussedand rejected the expansion of the harbor to include a freight pier. According to a<strong>Cape</strong> <strong>Cod</strong> <strong>Regional</strong> <strong>Transportation</strong> <strong>Plan</strong> | August 2011Chapter 2.5: Water <strong>Transportation</strong>Page 189
MassDOT report (“Identification of Massachusetts Freight Issues and Priorities,” 1999),the narrow streets in Provincetown’s historic district and the traffic congestion duringpeak hours make such a proposal unfeasible.2.5.1.4 Falmouth HarborFalmouth Harbor is located three miles east of Woods Hole, on the waterway betweenFalmouth Heights Road and Scranton Avenue (Figure 1). The Army Corps of Engineersbegan construction work in the harbor in 1957. Falmouth Harbor is 17 acres in area and10 feet deep, with a 100-foot wide entrance channel. It is currently used as a terminal forferries and charter tours, as well as for fishing and recreation.2.5.1.5 Saquatucket Harbor (Harwichport)Saquatucket Harbor in Harwich serves the Lower <strong>Cape</strong> (Figure 6). The harbor has a 12-foot deep, 200-foot long channel leading to a 12-foot deep anchorage. The Coast Guardmaintains a station at this facility. Accessible from Route 28 in Harwichport, the harboris a terminal for ferry service, tour boats, commercial fishing and recreational use.FIGURE 6: SAQUATUCKETHARBORFIGURE 7: WELLFLEET HARBOR2.5.1.6 Wellfleet HarborWellfleet Harbor is located at the mouth of Duck Creek, just south of Wellfleet Center(Figure 7). Work on the harbor dates back to 1899 when a 4-foot deep channel wasconstructed between deep water and the town wharves at Duck Creek. The state dredgedChapter 2.5: Water <strong>Transportation</strong> <strong>Cape</strong> <strong>Cod</strong> <strong>Regional</strong> <strong>Transportation</strong> <strong>Plan</strong> | August 2011Page 190
the channel in 1916 and deepened it by two feet. The Army Corps of Engineers laterimproved the harbor by creating a 10-foot deep, 125 foot-wide, 0.8-mile long channelfrom the middle of Wellfleet Harbor to the town landing, as well as a 10-foot deep, 500-foot long, 800-foot wide anchorage area. Currently, Wellfleet Harbor serves recreationalboating, boat tours, commercial fishing, and sport fishing charter boats.2.5.1.7 Stage Harbor (Chatham)STAGE HARBOR, LOCATED IN CHATHAM, IS ONE OF THE MAJOR SEAPORTS IN THE LOWERCAPE (Figure 8). The harbor is divided into two parts: the Upper Harbor and Stage Harbor.The Upper Harbor extends from Bridge Street to Morris Island, and Stage Harborextends from Morris Island to the Harding Beach bars. Original work in ChathamHarbor, including the construction of a channel through the Harding Beach bars, wascompleted in 1901. In the late-1950s, the Army Corps of Engineers constructed a new2.1-mile channel from Chatham Roads through Harding Beach and into the UpperHarbor. Other harbor features include a 500-foot long stone jetty at the southwesterncorner of the channel, a 2,500-foot long sand dike from Harbor Beach to Morris Island,and an adjacent 1,500-foot long timber jetty that has been partially removed.Additionally, a boathouse facility and dock in the Upper Harbor are maintained by theChatham Coast Guard Station. Stage Harbor is used as a base for boat tours,recreational boats and a small local fishing fleet.<strong>Cape</strong> <strong>Cod</strong> <strong>Regional</strong> <strong>Transportation</strong> <strong>Plan</strong> | August 2011Chapter 2.5: Water <strong>Transportation</strong>Page 191
FIGURE 8: STAGE HARBORChapter 2.5: Water <strong>Transportation</strong> <strong>Cape</strong> <strong>Cod</strong> <strong>Regional</strong> <strong>Transportation</strong> <strong>Plan</strong> | August 2011Page 192
FIGURE 9: BARNSTABLE HARBOR AND MARINA2.5.1.8 Barnstable HarborBARNSTABLE HARBOR LIES BETWEEN SANDY NECK AND THE MAINLAND OF CAPE COD (Figure 9). The marina and landing in Barnstable Village serves as the primary seaportfor Barnstable Harbor. A small channel, 7 feet deep, provides access to the marina fromthe entrance of the Harbor at Beach Point. Barnstable Harbor is the terminal forrecreational and whale watching tours, as well as fishing vessels.2.5.1.9 Sandwich MarinaSandwich Marina is located on the eastern end of <strong>Cape</strong> <strong>Cod</strong> Canal in Sandwich. Themarina has an anchorage of 8 feet, serving as a home to many fishing and recreationalvessels (Figure 11). With its proximity to road, rail tracks, and canal access, SandwichMarina has the potential to be a ferry terminal for service from Boston and Plymouth.2.5.1.10 Red Brook HarborRed Brook Harbor in Bourne is one of <strong>Cape</strong> <strong>Cod</strong>’s seaports on Buzzards Bay. The harboris located behind Bassetts Island between Handy and Long Points (Figure 10). The boatdocks are separated into two sections. The first, exposed to the harbor, provides an<strong>Cape</strong> <strong>Cod</strong> <strong>Regional</strong> <strong>Transportation</strong> <strong>Plan</strong> | August 2011Chapter 2.5: Water <strong>Transportation</strong>Page 193
anchorage of 8 feet. The second is 7.5 feet deep and is connected to the harbor by a shortchannel. Red Brook Harbor serves as a base for fishing and recreational boats.FIGURE 11: SANDWICH MARINAFIGURE 10: RED BROOK HARBOR, BOURNEFIGURE 12: SESUIT HARBOR,DENNIS2.5.1.11 Sesuit HarborSesuit Harbor is located in the Town of Dennis. It is accessible by Sesuit Neck Road andHarbor Road on the west, and Cold Storage Road and Salt Works Road on the east. Thechannel entering the harbor is 100 feet wide, narrowing to 80-90 feet, and approachingChapter 2.5: Water <strong>Transportation</strong> <strong>Cape</strong> <strong>Cod</strong> <strong>Regional</strong> <strong>Transportation</strong> <strong>Plan</strong> | August 2011Page 194
an anchorage of 6-7 feet (Figure 12). With a yacht club located on the western side of theharbor, and a boat ramp on the eastern side, Sesuit Harbor is used for fishing andrecreational use.2.5.2 CAPE COD CANAL<strong>Cape</strong> <strong>Cod</strong> possesses many channels that permit boat access to local seaports andwaterways. Many of these channels are monitored and maintained in order to ensuretheir continued usability. One of the most important of these channels is the <strong>Cape</strong> <strong>Cod</strong>Canal.The <strong>Cape</strong> <strong>Cod</strong> Canal connects Buzzards Bay to <strong>Cape</strong> <strong>Cod</strong> Bay through the towns ofBourne and Sandwich. The channel itself stretches 17.4 miles in length, extending fromthe outer end of the northerly breakwater in <strong>Cape</strong> <strong>Cod</strong> Bay to a point in Buzzards Baynear Cleveland Ledge about 5 miles southwest of the Wings Neck Light. It provides ashorter route for vessels traveling along the Atlantic Coast, reducing trip length by 65-150 miles depending on origin and destination. Additionally, the route is a safer path,allowing vessels to avoid the shoals and shipwrecks scattered along the Outer <strong>Cape</strong> route.A canal was envisioned as early as 1623 by Myles Standish of the Plymouth Colony.Studies and surveys were produced over the next 250 years recommending theconstruction of a canal, until a charter was finally granted to the <strong>Cape</strong> <strong>Cod</strong> CanalCompany in 1880. Unfortunately, work lapsed and so did the charter. Several morecharters were granted and more attempts at digging were made over the next 25 years,without success. Although <strong>Cape</strong> <strong>Cod</strong> and the region stood to benefit from the canal,none were willing to risk investing in such a venture.Finally, in 1907, August Belmont purchased the charter to build the canal. Belmont wasa New York investment banker who had built the City’s first subway. Unlike previousbuilders, he was able to secure the financial backing necessary to complete the <strong>Cape</strong> <strong>Cod</strong>Canal. Work began in June of 1909, and was completed in 1914. The new toll seawayopened with great celebration.Unfortunately, the original canal had many problems. First, it was relatively small: 100feet wide and 25 feet deep. These dimensions permitted only one-way travel, resulting indelays for vessels. Additionally, strong tidal currents caused several accidents and lentthe canal a poor reputation. Toll revenues fell as a result, making the canal a commercialdisaster.In 1918, the U.S. Government assumed control of the canal after a German U-boatattacked five vessels just three miles off <strong>Cape</strong> <strong>Cod</strong>. Control was returned to Belmont’scompany after World War I in 1920. However, the company was not interested and thewaterway was closed. Massachusetts Governor Calvin Coolidge urged Belmont’scompany to reopen the canal, which it did for three days. After much negotiating, the<strong>Cape</strong> <strong>Cod</strong> <strong>Regional</strong> <strong>Transportation</strong> <strong>Plan</strong> | August 2011Chapter 2.5: Water <strong>Transportation</strong>Page 195
<strong>Cape</strong> <strong>Cod</strong> Canal was sold to the federal government for $11.5 million in 1921. However,the government did not acquire the title until March 30, 1928.FIGURE 13: THE ORIGINAL BOURNE BRIDGECOMPLETED IN 1911FIGURE 14: FIRST CAPE COD CANAL, 1914- FIGURE 15: THE ORIGINAL RAILROAD BRIDGE1935OVER THE CAPE COD CANAL, 1914-1935Source: U.S. Army Corps of EngineersFIGURE 16: CONSTRUCTION OF THE BOURNE FIGURE 17: CONSTRUCTION OF THE BOURNEBRIDGEBRIDGESource: U.S. Army Corps of EngineersChapter 2.5: Water <strong>Transportation</strong> <strong>Cape</strong> <strong>Cod</strong> <strong>Regional</strong> <strong>Transportation</strong> <strong>Plan</strong> | August 2011Page 196
Responsibility for the <strong>Cape</strong> <strong>Cod</strong> Canal was passed to the Army Corps of Engineers, whosubsequently set out to improve it. The Corps began construction on an expanded canalin 1935 and completed the work by 1940. The existing canal is the result of this work.The current <strong>Cape</strong> <strong>Cod</strong> Canal has a width of 480 feet and a 32-foot deep channel, allowingtwo-way travel. At that size, the <strong>Cape</strong> <strong>Cod</strong> Canal is the world’s widest sea-level canal.The old canal drawbridges were replaced in 1935 by the Bourne, Sagamore, and Railroadbridges. The architect Ralph Adams Cram designed the Sagamore and Bourne bridges.Built simultaneously with Work Progress Administration funds, construction providedabout 700 jobs. The existing bridges have larger spans of 616 feet each and provide anoverhead clearance of 135 feet. A 32-foot deep approach channel was also constructed tofacilitate movement of ships from Buzzards Bay into the canal. The channel is 700 feetwide from Cleveland Ledge to Wings Neck and 500 feet from Wings Neck to the canalentrance. Other improvements to the canal include two mooring basins, two basins forsmall boats, an improved lighting system, a 600-foot and a 3,000-foot stone jetty at theentrance to canal from <strong>Cape</strong> <strong>Cod</strong> Bay, and a dike between Hog Island and Rocky Point inBourne.The Army Corps of Engineers continues to operate and maintain the Canal and itsbridges today. The highway bridges now carry over 34 million vehicles to and from theisthmus of <strong>Cape</strong> <strong>Cod</strong> annually. Over six thousand ships, tug and barge combinations andother large commercial vessels pass through the canal annually. In 2009 they carriedover 8 million tons of cargo to ports along the east coast including 1.9 billion gallons ofpetroleum products and 380 million gallons of bio fuels. Marine traffic is monitored andregulated 24 hours a day, 365 days a year. Moreover, Corps patrol boats stand by toassist vessels in distress. As a result, the <strong>Cape</strong> <strong>Cod</strong> Canal is a safe shortcut for marinetraffic from <strong>Cape</strong> <strong>Cod</strong> Bay to Buzzards Bay. Recreational boaters take advantage of thisfact as well with over seven thousand small boat canal transits each year.FIGURE 18: A SMALL BOAT TRAVELS THROUGHTHE CAPE COD CANALFIGURE 19: CAPE COD CANAL ANDRAILROAD BRIDGE IN THE DISTANCE,FACING WEST<strong>Cape</strong> <strong>Cod</strong> <strong>Regional</strong> <strong>Transportation</strong> <strong>Plan</strong> | August 2011Chapter 2.5: Water <strong>Transportation</strong>Page 197
2.5.3 OTHER CHANNELSOther channels serve the water transportation needs of <strong>Cape</strong> <strong>Cod</strong>. These waterwaysconnect harbors and major water routes, providing safe travel through otherwisedangerous waters.2.5.3.1 Woods Hole ChannelThe Woods Hole Channel is the most heavily traveled <strong>Cape</strong> <strong>Cod</strong> waterway (Table 2). Itis located between Penzance Point on the mainland and the northernmost of theElizabeth Islands. The channel connects Buzzards Bay with Great Harbor in WoodsHole.The Army Corps of Engineers has performed work on the Woods Hole Channel since1870. Major works include the dredging of the channel and the removal of dangerousshoals and boulders from the main channel. By 1913, the Corps completed the currentdimensions of the channel.The Woods Hole Channel is comprised of a main channel and two branches (Figure 20). The main channel, referred to as “The Strait,” is 2,500 feet long, 13 feetdeep and 300 feet wide. It connects an inlet of Buzzards Bay to Woods Hole betweenGrassy Island and Red Ledge. The larger branch, called “Broadway,” separates from theStrait at Middle Ledge and travels south of Red Ledge to Vineyard Sound. Broadway is1,300 feet long, 13 feet deep and 300 feet wide. The final branch simply provides a routeinto Buzzards Bay that is aimed towards the north. The smaller branch is also 13 feetdeep and 300 feet wide.Chapter 2.5: Water <strong>Transportation</strong> <strong>Cape</strong> <strong>Cod</strong> <strong>Regional</strong> <strong>Transportation</strong> <strong>Plan</strong> | August 2011Page 198
FIGURE 20: WOODS HOLE CHANNELWoods Hole Channel connects ports and ferry terminals in Woods Hole Harbor toseaports in Buzzards Bay and Vineyard Sound. Vessels traveling to Boston and pointsnorth can also use the Channel on their way to the <strong>Cape</strong> <strong>Cod</strong> Canal. As a result, thechannel is heavily traveled.2.5.3.2 Channels of Nantucket SoundNantucket Sound also contains several channels that serve <strong>Cape</strong> <strong>Cod</strong>’s water traffic. TheCross Rip Shoals mark the point, about 14 miles south of Hyannis Harbor, where severalof these channels meet. From this point, vessels can travel to Buzzards Bay, Martha’sVineyard, Nantucket, <strong>Cape</strong> <strong>Cod</strong>, and the Atlantic Ocean. The channel at the Cross RipShoals was created by the Army Corps of Engineers and is 30 feet deep, 4,000 feet wide,and 1.7 miles long (Table 1). The Pollack Rip Shoals are located about three miles to theeast of Monomoy Island. The Army Corps of Engineers constructed a channel extendingsix miles through the Pollack Rip Shoals in 1925. The Pollack Rip Channel is 30 feetdeep and 2,000 feet wide. It serves as the entrance to Nantucket Sound from theAtlantic Ocean. Taken together, the Wood Hole Channel, Cross Rip Channel, the PollackRip Channel, and the Main Channel create a thoroughfare for water traffic withinNantucket Sound (Figure 21).TABLE 1: ESTIMATED DISTANCES THROUGH NANTUCKET SOUND CHANNELSWoods Hole Channel to Martha’s Vineyard BranchMartha’s Vineyard Branch to Cross Rip ChannelCross Rip ChannelCross Rip Channel to Pollack Rip ChannelPollack Rip ChannelCross Rip Channel to Nantucket Harbor7 miles13.5 miles1.7 miles15 miles6 miles12 miles<strong>Cape</strong> <strong>Cod</strong> <strong>Regional</strong> <strong>Transportation</strong> <strong>Plan</strong> | August 2011Chapter 2.5: Water <strong>Transportation</strong>Page 199
TABLE 2: TRIPS OF VESSELS FOR CAPE COD PORTS AND CHANNELS FOR 2004 AND 2008; NEWBEDFORD ALSO SHOWN FOR INFORMATION2004TotalDown/Outbound2008TotalUp/Inbound2008TotalDown/OutboundFacility2004Total Up/Inbound2004Total2008Total<strong>Cape</strong> <strong>Cod</strong>Canal1,207 1,205 2,412 1,509 1,429 2,938Cross RipShoals945 945 1,890 939 951 1,890FalmouthHarbor3,011 3,011 6,022 715 715 1,430Hyannis Harbor 5,846 5,858 11,704 7,883 7,105 14,988Provincetown 0 0 0 1 1 2Woods HoleChannel8,398 8,393 16,791 9,683 9,716 19,399Total 19,407 19,412 38,819 20,730 19,917 40,647New Bedford 1,549 1,560 3,109 1,183 1,149 2,332Source: 2008 Waterborne Commerce of the United States, Part 1 Atlantic CoastChapter 2.5: Water <strong>Transportation</strong> <strong>Cape</strong> <strong>Cod</strong> <strong>Regional</strong> <strong>Transportation</strong> <strong>Plan</strong> | August 2011Page 200
FIGURE 21: NANTUCKET SOUND CHANNELS<strong>Cape</strong> <strong>Cod</strong> <strong>Regional</strong> <strong>Transportation</strong> <strong>Plan</strong> | August 2011Chapter 2.5: Water <strong>Transportation</strong>Page 201
2.5.4 WATER TRANSPORTATION INFRASTRUCTUREFIGURE 22: NAVIGATIONAL AIDS WITHIN THREE MILES OF CAPE CODA lighthouse is a structure, such as a tower, that gives a continuous orintermittent light signal to navigators. <strong>Cape</strong> <strong>Cod</strong> is famous for its manylighthouses and their unique towers. However, in addition to being aestheticallypleasing, these lights serve a vital purpose. Along with other navigational lightsand aids, they form the infrastructure that keeps water traffic on course and outof danger. There are ten active lighthouses on <strong>Cape</strong> <strong>Cod</strong> (Table 3). Most arelocated in the Outer <strong>Cape</strong> region. Additionally, there are six inactive lighthousestructures still in their original locations. Navigational lights and fog signals(bells, whistles, gongs, and horns) are generally located along the perimeter ofchannels and at dangerous areas. Due to its shoals and other hazards, themajority of <strong>Cape</strong> <strong>Cod</strong>’s navigational aids are located in Nantucket Sound (Table 4). <strong>Cape</strong> <strong>Cod</strong> has 43 fog signals and 72 navigational lights in total.Chapter 2.5: Water <strong>Transportation</strong> <strong>Cape</strong> <strong>Cod</strong> <strong>Regional</strong> <strong>Transportation</strong> <strong>Plan</strong> | August 2011Page 202
TABLE 3: ACTIVE CAPE COD LIGHTHOUSESLighthouse NameNobska LightCleveland Ledge LightLewis Bay LightWest Dennis LightChatham LighthouseNauset LightHighland LightRace Point LightWood End LightLong Point LightTownFalmouthIn Buzzards BayBarnstableDennisChathamEasthamTruroProvincetownProvincetownProvincetownTABLE 4: NAVIGATIONAL LIGHTS AND FOG SIGNALS BY LOCATIONNavigationalLightsFog SignalsAtlantic Ocean 1 4Buzzards Bay 13 13<strong>Cape</strong> <strong>Cod</strong> Bay 12 11Nantucket Sound 46 15Total 72 432.5.5 WATER FREIGHT SERVICEGoods are transported by water via ferries, barges, and tankers. The busiest <strong>Cape</strong> <strong>Cod</strong>water facility in terms of freight transportation is the <strong>Cape</strong> <strong>Cod</strong> Canal. Although morevessels may pass through the Woods Hole Channel per year, more tons of freight passthrough the <strong>Cape</strong> <strong>Cod</strong> Canal (Table 5). Petroleum and petroleum products constitutethe majority of freight traveling through the Canal. Other products include coal,chemicals, crude materials (i.e. wood, gravel, ore), food and manufactured goods, andequipment. In total, roughly 8.5 million tons were transported through the <strong>Cape</strong> <strong>Cod</strong>Canal in 2003. This figure is higher than the previous year, but lower than that of tenyears previous (<strong>Cape</strong> <strong>Cod</strong> <strong>Regional</strong> <strong>Transportation</strong> <strong>Plan</strong> | August 2011Chapter 2.5: Water <strong>Transportation</strong>Page 203
Table 6). By way of comparison, the Port of Boston handled 24.8 million tons of freightin 2003 and Providence Harbor handled 9.2 million tons according to the U.S. ArmyCorps of Engineers. Understandably, the <strong>Cape</strong> <strong>Cod</strong> Canal is listed as one of the majorwaterways of New England by the Corps of Engineers.Falmouth Harbor is the only <strong>Cape</strong> <strong>Cod</strong> Harbor for which freight traffic is reported. In2003, one thousand tons of manufactured equipment and machinery were processed bythe port facility. This means that Falmouth Harbor is the <strong>Cape</strong> <strong>Cod</strong> seaport handling themost of a single category of freight. However, the data on freight movement is roundedto the nearest thousand tons. With hundreds of different categories, it is possible that aport can process thousands of tons of freight that go unreported. Therefore, althoughFalmouth Harbor is listed as the <strong>Cape</strong> <strong>Cod</strong> seaport handling the most freight, there maybe other facilities that have higher total amounts of freight.Chapter 2.5: Water <strong>Transportation</strong> <strong>Cape</strong> <strong>Cod</strong> <strong>Regional</strong> <strong>Transportation</strong> <strong>Plan</strong> | August 2011Page 204
TABLE 5: FREIGHT TRAFFIC THROUGH CAPE COD PORTS AND CHANNELS ROUNDED TO THENEAREST THOUSAND TONS, 2003Note: Figures areonly thosereported.<strong>Cape</strong> <strong>Cod</strong> CanalCoal57Petroleum and PetroleumProducts6,570Chemicals and RelatedProductsCrude Materials, InedibleExcept FuelsPrimary Manufactured GoodsFood and Farm ProductsAll Manufactured Equipment,Machinery and Products120 601 733 31 353Total8,464Ton-Miles146,706Cross Rip Shoals - 25 - 18 - - 2 45 45Falmouth Harbor - - - - - - 1 1 1Woods HoleChannel- 31 - 77 - - 5 114 113Source: U.S. Army Corps of Engineers<strong>Cape</strong> <strong>Cod</strong> <strong>Regional</strong> <strong>Transportation</strong> <strong>Plan</strong> | August 2011Chapter 2.5: Water <strong>Transportation</strong>Page 205
TABLE 6: COMPARATIVE STATEMENT OF TRAFFIC THROUGH CAPE COD PORTS AND CHANNELIN TONS, 1994-200814,000,000<strong>Cape</strong> <strong>Cod</strong> Canal Freight Traffic12,000,00010,000,000Freight Trafficin Tons8,000,0006,000,0004,000,0002,000,000019941996199820002002200420062008YearChapter 2.5: Water <strong>Transportation</strong> <strong>Cape</strong> <strong>Cod</strong> <strong>Regional</strong> <strong>Transportation</strong> <strong>Plan</strong> | August 2011Page 206
Trucks Ferried between <strong>Cape</strong> <strong>Cod</strong> and the IslandsNumber Carried in Thousands1601401201008060402002000 2001 2002 2003 2004 2005YearTrucksFIGURE 23: COMBINED VEHICULAR TRAFFIC BETWEEN CAPE COD AND THE ISLANDS, 2000-05TABLE 7: TRUCKS CARRIED BY STEAMSHIP AUTHORITY VESSELSWoods Hole toMartha’s Vineyardand ReturnHyannis toNantucketand ReturnCombined2009 95,062 38,113 133,1752008 98,393 44,537 142,9302007 98,257 48,187 146,4442006 103,939 49,547 153,4862005 97,595 44,025 141,6202004 87,166 39,657 126,8232003 70,546 34,329 104,8752002 72,451 35,046 107,4972001 73,271 35,782 109,0532000 72,542 36,118 108,660Source: Steamship AuthorityThe Steamship Authority also records movements of trucks between <strong>Cape</strong> <strong>Cod</strong> and theIslands. Generally, these trucks are transporting goods from the mainland to theIslands. In 2009, truck movements increased to over 140,000 vehicles. The totalnumber of trucks carried includes pick-up trucks, vans, and other commercial vehicles<strong>Cape</strong> <strong>Cod</strong> <strong>Regional</strong> <strong>Transportation</strong> <strong>Plan</strong> | August 2011Chapter 2.5: Water <strong>Transportation</strong>Page 207
under 20’ in overall length. In 2004, the Steamship Authority started classifying certainvehicles under 20’ as trucks rather than automobiles. Some pick-up trucks and vans thatwere previously classified as automobiles are now being classified more consistently astrucks based on the make and model of the vehicle. SUVs, however, are still classifiedand counted as automobiles. This resulted in more trucks and fewer automobiles beingcarried starting in 2004. Also, the number of trucks in this category of under 20’represented 53% of the total trucks carried on the Woods Hole – Martha’s Vineyardroute and 36% of the total trucks carried on the Hyannis – Nantucket route during 2005.The numbers of trucks, automobiles, or passengers are reported as one-way segments ormovements. A truck carried round trip is reported as two trucks carried. Roughly twothirdsof these shipments are made between Woods Hole and Martha’s Vineyard. Theremainder is made between Hyannis and Nantucket. This makes Hyannis Harbor andWoods Hole important freight handling facilities.2.5.6 FERRY SERVICEFerry service links passengers from <strong>Cape</strong> <strong>Cod</strong> to the Islands, Boston, and Plymouth. Asurvey of Provincetown ferry passengers revealed that most people (92%) ride to reachrecreational facilities. Passengers choose to ride the ferry, as opposed to other modesbecause it is more convenient, less hassle than driving, recommended by friends, andtheir own personal preference. According to a 1999 Marine <strong>Transportation</strong> Study by the<strong>Cape</strong> <strong>Cod</strong> Commission, people are unlikely to take the ferry because it is inconvenient,not going where they want, or because they prefer to drive.The typical ferry rider varies by boat. For example, people riding the ferry from Bostonto Provincetown are generally young, male, and single. They typically take the ferry toreach <strong>Cape</strong> <strong>Cod</strong> for a short vacation. People riding on the Plymouth to Provincetownferry are more likely to be women traveling in large groups. Accommodating passengersof different types is important to maintaining ridership and attracting new ridership aswell.The most effective message to promote ferry use is that a ferry can travel fromProvincetown to Boston in less time and avoid road traffic. 63% of the public is likely torespond to this sort of message. In advertising existing and potential services, themessage of “less time, no traffic” is important to remember. Additionally, passengers areinterested in package deals, including hotels, buses, and recreational facilities.Advertising ferry services in this manner will be more successful.Chapter 2.5: Water <strong>Transportation</strong> <strong>Cape</strong> <strong>Cod</strong> <strong>Regional</strong> <strong>Transportation</strong> <strong>Plan</strong> | August 2011Page 208
FIGURE 24: CAPE COD FERRY SERVICE2.5.6.1 Massachusetts Steamship AuthorityThe largest provider of ferry service between <strong>Cape</strong> <strong>Cod</strong> and the Islands is the WoodsHole, Martha’s Vineyard, and Nantucket Steamship Authority (Steamship Authority). Itis also the only ferry service that carries both passengers and vehicles. TheMassachusetts legislature created the Steamship Authority as the “Lifeline to theIslands,” empowering it to acquire, maintain and operate ferry service from Hyannis andWoods Hole to the Islands. The enabling legislation also gives the Steamship Authoritythe power to license and regulate vessels carrying freight or more than forty passengers,except for those “grandfathered” services operating prior to May 1973. With an annualoperating budget of about $65 million, the Steamship Authority has operated withinbudget since 1963. A five-member board governs the Steamship Authority, consisting ofrepresentatives of Nantucket County, Dukes County, Falmouth, Barnstable, and NewBedford. Additionally, a seven-member Port Council acts as an advisory board andconsists of representatives from each of the towns served by the Steamship Authority.<strong>Cape</strong> <strong>Cod</strong> <strong>Regional</strong> <strong>Transportation</strong> <strong>Plan</strong> | August 2011Chapter 2.5: Water <strong>Transportation</strong>Page 209
TABLE 8: STEAMSHIP AUTHORITY FLEETYear Year Length x Passenger Speed ServiceVessel Name Built Acq. Beam Capacity (knots) TypeFlying Cloud 2000 2000 135’ x 35’ 300 34 High-SpeedMartha’s Vineyard 1993 1974 230’ x 60’ 1,376 14 StandardEagle 1987 1987 235’ x 60’ 799 14 StandardNantucket 1974 1974 230’ x 60’ 784 14 StandardIslander 1950 1950 201’x 58’ 771 11.5 StandardGovernor 1954 1998 242’ x 65’ 250 12 Back-upKatama 1981 1988 235’ x 52’ 143 13.5 StandardGay Head 1981 1981 235’ x 52’ 139 13.5 StandardSankaty 1981 1994 235’ x 52’ 290 13 StandardSource: Steamship AuthorityThe Steamship Authority operates a fleet of nine vessels, including a high-speedpassenger-only ferry (Table 8). Using this fleet, it provides service from Hyannis toNantucket, and from Woods Hole to Vineyard Haven and Oak Bluffs, as well as interislandand off-<strong>Cape</strong> service. It has a record of nearly 100% on-time performance, withinterruptions to service caused generally by weather. One-way tickets for passengers are$6.50 for the Martha’s Vineyard ferry, $14.00 for the Nantucket ferry, and $29.50 for theFast-Ferry to Nantucket. One-way tickets for vehicles vary in price by season and byvehicle size, but generally range between $100 and $200.Chapter 2.5: Water <strong>Transportation</strong> <strong>Cape</strong> <strong>Cod</strong> <strong>Regional</strong> <strong>Transportation</strong> <strong>Plan</strong> | August 2011Page 210
3,500Total Steamship Authority Passengers between <strong>Cape</strong> <strong>Cod</strong> and the IslandsNumber Carried in Thousands3,0002,5002,0001,5001,00050002000 2001 2002 2003 2004 2005YearWoods Hole to Marthas VineyardHyannis to NantucketFIGURE 25: STEAMSHIP AUTHORITY PASSENGERS, 2000-2005Source: Steamship AuthorityTABLE 9: PASSENGERS CARRIED BY THE STEAMSHIP AUTHORITYWoods Hole toMartha’s Vineyardand ReturnHyannis toNantucketand ReturnCombined2009 2,179,567 513,611 2,693,1782008 2,174,185 517,846 2,692,0312007 2,143,160 549,206 2,692,3662006 2,105,128 515,437 2,620,5652005 2,098,037 511,798 2,609,8352004 2,164,169 508,990 2,673,1592003 2,283,627 558,690 2,842,3172002 2,401,286 600,513 3,001,7992001 2,396,759 604,025 3,000,7842000 2,309,181 578,560 2,887,741Source: Steamship Authority<strong>Cape</strong> <strong>Cod</strong> <strong>Regional</strong> <strong>Transportation</strong> <strong>Plan</strong> | August 2011Chapter 2.5: Water <strong>Transportation</strong>Page 211
TABLE 10: AUTOMOBILES CARRIED BY THE STEAMSHIP AUTHORITYWoods Hole toMartha’s Vineyardand ReturnHyannis toNantucketand ReturnCombined2009 389,242 67,236 456,4782008 383,188 68,632 451,8202007 381,930 70,827 452,7572006 379,927 69,975 449,9022005 385,305 70,352 455,6572004 391,260 70,635 461,8952003 412,823 81,163 493,9862002 416,024 82,769 498,7932001 417,453 81,771 499,2242000 409,516 82,894 492,410Source: Steamship AuthorityYear-round parking lots in Hyannis and Woods Hole, as well as seasonal parking lots inFalmouth, Bourne, and Hyannis serve passengers coming from the mainland. TheSteamship Authority charges a parking fee and runs shuttles between the lots and theferries. Some lots also serve as a stop for local and interregional bus service. TheCataumet lot is located on Route 28A in Bourne and has 900 parking spaces. ThePalmer Avenue Lot, located off Route 28 in Falmouth has 1,400 parking spaces. TheHigh School Lot, on Gifford Street Extension off Brick Kiln Road in Falmouth, has 300parking spaces. The Gifford Street Lot, just off Brick Kiln Road in Falmouth, has 350parking spaces. Lastly, the Sun Lot, on Gifford Street just off Brick Kiln Road inFalmouth, has 600 parking spaces.In addition to its vessels and parking facilities, the Steamship Authority owns andoperates multiple other facilities. This includes terminals in Hyannis, Woods Hole, andon the Islands, a vessel maintenance facility in Fairhaven, and a receiving warehouse inFalmouth. The Steamship Authority operates out of offices in Woods Hole and rentsspace for reservation offices in Edgartown and Mashpee. During the peak season, theSteamship authority employs 750 people, most of which are unionized.2.5.6.2 Hy-Line CruisesHy-Line Cruises, owned by Hyannis Harbor Tours, Inc., is another major provider offerry service for <strong>Cape</strong> <strong>Cod</strong> and the Islands (Table 11). Richard and Robert Scudderfounded Hyannis Harbor Tours in 1962 as a marine sightseeing business, adding deepsea fishing operations in 1966. A parcel of land owned by the Scudder family on theHyannis Inner Harbor became the docking and parking facility. Ferry service began in1971 with a newly constructed 400-passenger island ferry operating between HyannisChapter 2.5: Water <strong>Transportation</strong> <strong>Cape</strong> <strong>Cod</strong> <strong>Regional</strong> <strong>Transportation</strong> <strong>Plan</strong> | August 2011Page 212
and Oak Bluffs. A year later Hyannis Harbor Tours purchased the Nantucket Boat Line,who had decided to sell their operations rather than compete with the new SteamshipAuthority Service out of Hyannis. Hyannis Harbor Tours received three vessels, theirdocking facility, and the trade name of Hy-Line. Under this new management, Hy-LineCruises added touring vessels and high-speed catamarans and worked with motor coachcompanies to package local itineraries for tourists. Today, Hyannis Harbor Tours is stillowned and operated by the Scudder family, and employs 90 full-time and 300 seasonalemployees.Hy-Line Cruises serves Nantucket and Oak Bluffs out of their facilities in Hyannis. Hy-Line offers both standard and high-speed passenger service between the mainland andthe Island, as well as a first class passenger service to Nantucket. One-way ticket pricesrange from $15 to $36 depending on the destination and the speed of the ferry.2.5.6.3 Other Ferry Service ProvidersMany other companies provide ferry service between <strong>Cape</strong> <strong>Cod</strong> and the Islands. BayState Cruise Company provides fast ferry service from Provincetown to Boston with afleet of three high-speed catamarans. Boston Harbor Cruises also provides servicebetween Provincetown and Boston aboard the Salacia, a 600 passenger high-speedcatamaran. Both Bay State Cruise Company and Boston Harbor Cruises provide onlyseasonal service. A third company, Captain John Boats, provides seasonal high-speedservice from Provincetown to the State Pier in Plymouth. From Falmouth Harbor, theIsland Queen and Falmouth-Edgartown Ferry provide seasonal passenger service toMartha’s Vineyard. Lastly, Freedom Cruise Line sails seasonally from SaquatucketHarbor in Harwich. Their high-speed ferry operates between Nantucket Harbor andtheir port facility on Route 28.<strong>Cape</strong> <strong>Cod</strong> <strong>Regional</strong> <strong>Transportation</strong> <strong>Plan</strong> | August 2011Chapter 2.5: Water <strong>Transportation</strong>Page 213
TABLE 11: WEEKDAY SUMMER FERRY SERVICE (INCLUDES RETURN TRIP)OriginDestinationHyannis Nantucket (HS) - - - - - 6 - 5 11Nantucket (1 st ) - - - - - 3 - - 3Nantucket - - - - - 3 - 6 9Oak Bluffs, MV (HS) - - - - - 5 - - 5Oak Bluffs, MV - - - - - 1 - - 1Woods Hole Vineyard Haven, MV - - - - - - - 9 9Oak Bluffs, MV - - - - - - - 5 5Falmouth Harbor Oak Bluffs, MV - - - - - - 7 - 7Edgartown, MV - - - 5 - - - - 5Provincetown Boston 1 1Boston (HS) 3 1 - - - - - - 4Plymouth (HS) - - 1 - - - - 1Harwich Nantucket - - - - 3 - - - 3Total 3 2 1 5 3 18 7 25 64HS – High Speed Ferry; 1 st – First Class FerryBay State Cruise Co.Boston Harbor CruisesCaptain John BoatsFalmouth-Edgartown FerryFreedom Cruise LineHy-Line CruisesIsland QueenSteamship AuthorityTotalSome routes are currently un-served by ferry service. 39% of <strong>Cape</strong> <strong>Cod</strong> residents areinterested in a ferry service to Logan Airport. 63% of Upper and Mid-<strong>Cape</strong> residents aresomewhat interested in such a service from Hyannis, while 63% of Outer <strong>Cape</strong> residentsare likely to use such a service from Provincetown. Barnstable, Woods Hole andSandwich remain attractive options for people as well according to a 1999 Marine<strong>Transportation</strong> study by the <strong>Cape</strong> <strong>Cod</strong> Commission. Addressing these gaps in servicemay be a way to reduce automobile congestion and encourage alternative transportation.2.5.7 FERRY SERVICE ACCESSIBILITY AND MOBILITYSince ferry service is one of the primary connections to the Islands, it is extremelyimportant to ensure that seaports are accessible to users. Moreover, if that accessibilityis via public transportation, <strong>Cape</strong> <strong>Cod</strong> stands to reduce automobile traffic by thousandsChapter 2.5: Water <strong>Transportation</strong> <strong>Cape</strong> <strong>Cod</strong> <strong>Regional</strong> <strong>Transportation</strong> <strong>Plan</strong> | August 2011Page 214
of trips per year. Travelers can also be encouraged to use ferry service to reachdestinations accessible by automobile if there are convenient connections on both ends.For example, ferry users have reported an interest in a ferry connection between Hyannisand Boston because it is more convenient than driving to the ferry in Provincetown. Yet,ferry users said they were discouraged from taking the ferry to Boston because of howdifficult it is to get from the Boston Pier to public transportation according to a 1999Marine <strong>Transportation</strong> study by the <strong>Cape</strong> <strong>Cod</strong> Commission. This attitude may havechanged since the Massachusetts Bay Transit Authority (MBTA) introduced the SilverLine rapid transit service. Addressing these concerns could lead to greater use of ferryservice and less automobile use on <strong>Cape</strong> <strong>Cod</strong>’s roads.2.5.7.1 Road Accessibility and ParkingAll ferry ports are accessible by major roads, which means that ferry terminals mustaccommodate traffic and parking needs. Although thousands of cars travel between themainland and Islands each year, most users park their cars before using the ferry. TheSteamship Authority operates four parking lots at their Hyannis facility and five lots attheir Woods Hole facility. Parking fees are up to $12 during the peak season and $8during the off-season. The Steamship Authority provides shuttle bus service betweentheir parking lots and the terminals. Additionally, the shuttle buses have bicycle rackscapable of accommodating two bicycles. The availability of parking space at these lots isposted online and reported on 1610AM. Other ferry service providers maintain theirown parking lots at their respective terminals. Parking fees, if any, vary by season and bythe amount of time parked. Given the current parking price structure, 39% of the publicsays they are more likely to ride the ferry, while only 18% say they are less likely to rideaccording to a 1999 Marine <strong>Transportation</strong> study by the <strong>Cape</strong> <strong>Cod</strong> Commission. Thus,the existing parking price structure acts as an incentive, making ferry service affordableand accessible to the public. Public automobile transportation is also generally available.Ferry users can arrange pick up by taxi service and rental car service on request.<strong>Cape</strong> <strong>Cod</strong> <strong>Regional</strong> <strong>Transportation</strong> <strong>Plan</strong> | August 2011Chapter 2.5: Water <strong>Transportation</strong>Page 215
250Cars Parked at Steamship Authority Parking Lots: 2001-2005200Passenger Total in Thousands1501005002001 2002 2003 2004 2005YearCars Parked At Steamship Authority LotsFIGURE 26: FERRY PARKING DEMANDSource: Steamship Authority2.5.7.2 Local Bus AccessibilityFour of the five <strong>Cape</strong> <strong>Cod</strong> ferry ports are accessible via local bus. The SeaLine of the<strong>Cape</strong> <strong>Cod</strong> <strong>Regional</strong> Transit Authority (RTA) makes its final stop at the Woods Hole docksseveral times daily. The SeaLine connects ferry passengers in Woods Hole to downtownFalmouth and Hyannis. In Provincetown, the RTA’s Flex service makes regular stops atMacMillan Wharf providing connections throughout the Lower/Outer <strong>Cape</strong>. Lastly, theRTA’s Hyannis-Orleans (H2O) service passes Saquatucket Harbor on its way fromHyannis to Orleans and back. The only harbor not directly accessible by local bus serviceis Falmouth Harbor. Although the SeaLine passes within several blocks, there is nodirect access. Variable route bus service, the B-Bus (soon to be renamed as “DART”),can be arranged in advance to any ferry port.2.5.7.3 Local Bus CoordinationDespite the local bus connections, there is little coordination. Examining local bus andferry departure schedules reveals that ferry users must arrive at least 30 minutes early ifthey want to catch their boat. Many bus stop times are either too early or do not leaveenough time for passengers to transfer to the ferry. The best location to transfer betweenferry and bus service is MacMillan Wharf in Provincetown, where the regularity of localbus service provides a convenient connection. The worst coordinated transfer locationChapter 2.5: Water <strong>Transportation</strong> <strong>Cape</strong> <strong>Cod</strong> <strong>Regional</strong> <strong>Transportation</strong> <strong>Plan</strong> | August 2011Page 216
is Harwichport. Clearly, increasing coordination between bus and ferry schedules willprovide greater access to travelers.2.5.7.4 Interregional Bus AccessibilityInterregional bus service takes passengers to Woods Hole, Provincetown, Falmouth, andHyannis. However, connections from the Falmouth and Hyannis bus depots must bemade by local bus, taxi, automobile, bicycle, or walking. For example, Hyannis ferryusers must walk or take the Red Line two blocks from the Hyannis <strong>Transportation</strong>Center. Ferry users stopping at the Falmouth Bus Depot must take a taxi or take theBlue Line roughly one mile to Falmouth Harbor. Only the Woods Hole andProvincetown stops are at the ferry terminals. These connections allow users fromelsewhere on <strong>Cape</strong> <strong>Cod</strong> and beyond to access ferry service. Addressing the missingconnections, or lack of coordination, between interregional bus service and ferry servicewill improve accessibility.2.5.7.5 Air <strong>Transportation</strong> CoordinationPassenger service to Martha’s Vineyard and Nantucket is by air and by ferry. Duringadverse weather conditions, such as fog or wind, only one mode may be available.Moreover, last minute scheduling changes may force travelers to take a different modethan they originally planned. Tickets, good for a round trip on either water or airtransportation, would allow people to adapt their plans to changing weather andschedules. Surcharges or credits could help to deal with the difference in price betweenthe two tickets. In addition to a flexible ticket system, a regular, convenient, andcoordinated shuttle system between airports and seaports would allow people to useparking and transit facilities at both terminals. Currently no such system exists.Flexibility to use air and water transportation modes interchangeably would thereforeincrease travelers’ mobility.2.5.7.6 Ferry Service MobilityMobility is limited by ferry service destinations. The primary destinations for <strong>Cape</strong> <strong>Cod</strong>ferries are Martha’s Vineyard and Nantucket. Multiple access points and schedulesprovide great mobility for users traveling to and between the Islands. However, mobilitybeyond and within the <strong>Cape</strong> is limited. Besides service to and from the Islands, the onlyother <strong>Cape</strong> service is three ferries from Provincetown to Boston and one fromProvincetown to Plymouth. No ferry service exists between <strong>Cape</strong> <strong>Cod</strong> ports or over the<strong>Cape</strong> <strong>Cod</strong> Canal. An increase in such connections would increase mobility by providingalternative routes, such as from Barnstable to Provincetown.2.5.7.7 Accessibility to PassengersThe disabled and elderly are not wholly accommodated by ferry service. All ferryterminals include shelters, benches, and handicapped parking. Some ferries are<strong>Cape</strong> <strong>Cod</strong> <strong>Regional</strong> <strong>Transportation</strong> <strong>Plan</strong> | August 2011Chapter 2.5: Water <strong>Transportation</strong>Page 217
handicapped accessible, but not all. Ferry staff can offer assistance to those havingdifficulty boarding or disembarking. In addition, large print and Braille signage arenecessary at terminals and on ferries. Further study of disabled and elderly accessibilityto ferry services may be necessary.2.5.8 CONCLUSION<strong>Cape</strong> <strong>Cod</strong> has several seaports and channels that provide a network for watertransportation. Many of these are the result of Army Corps of Engineers projects.Navigational aids such as lighthouses and fog signals mark the edges of safe channelsand the location of dangerous waters. Woods Hole Harbor and the Woods Hole Channelare the busiest passenger facilities. Water transportation is primarily offered from <strong>Cape</strong><strong>Cod</strong> to the Islands, but also Boston and Plymouth. In 2005, the Steamship Authoritywas <strong>Cape</strong> <strong>Cod</strong>’s largest ferry service provider with over 2.6 million passengers. In termsof freight service, the <strong>Cape</strong> <strong>Cod</strong> Canal handles almost all freight traffic, much of which ispetroleum and petroleum products. Ferry service is accessible by many modes, withgreat mobility between the mainland and the Islands. However, coordination with busschedules, coordination with air service, better connections, and more routes wouldincrease accessibility and mobility.Chapter 2.5: Water <strong>Transportation</strong> <strong>Cape</strong> <strong>Cod</strong> <strong>Regional</strong> <strong>Transportation</strong> <strong>Plan</strong> | August 2011Page 218
2.6 AIR TRANSPORTATIONAir transportation on <strong>Cape</strong> <strong>Cod</strong> is provided primarily by airplane out of six airports.Other air transportation modes, such as helicopter and glider, serve either non-civilianor recreational purposes. Public air transportation consists mostly of shuttle service bysmall aircraft from Hyannis and Provincetown airports. For <strong>Cape</strong> <strong>Cod</strong> travelers, airservice provides an important link from <strong>Cape</strong> <strong>Cod</strong> to the Islands, Boston, and the worldbeyond.2.6.1 CAPE COD AIRPORTSSix airfields and airports serve <strong>Cape</strong> <strong>Cod</strong> as a base for air transportation (Table 1). Anairfield is an area of land from which aircraft operate. An airport is specifically definedas an airfield with paved runways and maintenance facilities that often serves as aterminal. However, many people use the term airport to refer to any airfield. Anairpark is a small airport that is usually near an industrial area.NameBarnstable Municipal AirportProvincetown Municipal AirportTABLE 1: AIRPORTS AND AIRFIELDS OF CAPE CODFAAIdentifierHYAPVCFacility TypeScheduled AirCarrier ServiceScheduled AirCarrier ServiceChatham Municipal Airport CQX General AviationFalmouth Airpark 5B6 General Aviation<strong>Cape</strong> <strong>Cod</strong> Airfield 2B1 General AviationAircraft Basedat the FieldSingle Engine: 56Multi Engine: 15Jet Engine: 1Single Engine: 5Multi Engine: 1Single Engine: 34Multi Engine: 5Single Engine: 40Multi Engine: 3Single Engine: 10Multi Engine: 1Ultralights: 1Otis Air Force Base FMH Military -Source: AirNav, LLC.2.6.1.1 Barnstable Municipal AirportThe primary airport on <strong>Cape</strong> <strong>Cod</strong> is Barnstable Municipal Airport, Boardman-PolandoField located in Hyannis. It is one of only two airports on <strong>Cape</strong> <strong>Cod</strong> to provide scheduledair carrier service. According to the Town of Barnstable’s website, the history of theairport goes back to 1928, when Charles Ayling and his son Robertson formed theHyannis Airport Corporation. Amelia Earhart served as an early stockholder and the<strong>Cape</strong> <strong>Cod</strong> <strong>Regional</strong> <strong>Transportation</strong> <strong>Plan</strong> | August 2011Chapter 2.6: Air <strong>Transportation</strong>Page 219
first director of the company. The corporation cleared 57 acres at Tip Top Farm in thevillage of Hyannis for the construction of a single turf runway, the fourth inMassachusetts. The first landing at the Hyannis Airport occurred on June 17, 1928 andwas made by Alton Shermon in a Waco 9. Soon, service out of the airport grew, withdaily scheduled flights between Boston, Hyannis, and the Islands. During World War II,the Works Progress Administration funded the construction of three paved 4,000-footrunways, while the Army and then the Navy assumed control of the airport. InNovember 1943, Former President George H.W. Bush received flying lessons during histime stationed at “Naval Air Station Hyannis.” After the war ended, the navy turned overcontrol of the Hyannis Airport to the Town of Barnstable. The advent of larger planesand increased passenger service required the construction of a larger, 5,400-foot runwayin the mid-1950s, new terminals in 1957, and a control tower in 1961. A variety ofairlines such as Air New England, Provincetown Boston Airlines, Delta Airlines, Gull Air,and Wills Air operated out of the expanded facilities, flying aircraft such as the DC-9,Martin 404, YS-11, and Cessna 402. In 1981, the airport was renamed the BarnstableMunicipal Airport, Boardman-Polando Field. Russell Boardman and John Polando weretwo Bay State pioneers who flew a record nonstop distance of 5,011 miles from theUnited States to Istanbul in 1931. Today, Barnstable Municipal Airport continues toprovide service to Boston, the Islands, and beyond as the third largest and busiest airportin the Commonwealth (behind Boston and Nantucket airports). J3 Piper Cubs, Cessna402s, Falcon 50s, and Boeing 727s are some of the aircraft operating from its tworunways (Table 2). A total of 58 aircraft are based out of Barnstable Municipal Airport,including one jet. The airport employs 27 full-time employees and leases space to 43tenant businesses that employ 1,143 personnel (Town of Barnstable website). Theairport is currently undergoing construction as its terminal is expanded and severalother facilities are relocated.2.6.1.2 Provincetown Municipal AirportThe Provincetown Municipal Airport also has scheduled air carrier service, primarily toLogan Airport in Boston. The airport is located at the end of Race Point Road. Fivesingle engine airplanes and two multi-engine planes are based out of the airport, andoperate from a single runway. Provincetown Municipal Airport is the least active airportto provide scheduled air carrier service in the Commonwealth of Massachusetts.2.6.1.3 Other General Aviation AirportsChapter 2.6: Air <strong>Transportation</strong> <strong>Cape</strong> <strong>Cod</strong> <strong>Regional</strong> <strong>Transportation</strong> <strong>Plan</strong> | August 2011Page 220
Several other airports are open to the public and offergeneral aviation service. Chatham Airport, located onGeorge Ryder Road, offers a variety of tours aroundMonomoy Island and the Outer <strong>Cape</strong> One asphaltrunway provides service for the 34 aircraft based on thefield. The airport is owned by the Town of Chatham andmanaged by C.C.F.C., Inc. Another general aviationairport is the Falmouth Airpark, located near Route 28and Fresh Pond Road. The airpark has a single asphaltrunway, which serves 53 aircrafts. A nearby “Fly-InCommunity,” with aircraft access from the homes to therunway, offers shares of the Falmouth Airpark withresidence. Lastly, the <strong>Cape</strong> <strong>Cod</strong> Airfield on Route 149and Race Lane in Marstons Mills provides tours andglider rides from three turf runways. The length of therunways, the height of the nearby trees and the absenceof a fence restrict the type of airplanes that can use theairfield. It opened as the <strong>Cape</strong> <strong>Cod</strong> Airport on July 4,1929 with an air circus, stunt flights, parachute jumps,and other spectacles. Amelia Earhart flights,automobile and motorcycle racing, Massachusetts ArmyNational Guard maneuvers, and polo matches all tookplace at the airport. The property was sold to WilmaFIGURE 1 - CHATHAMAIRPORT AND FLIGHT PATHSand William H. Danforth in 1935 as the Great Depression set in, and went largely unusedduring World War II. The field became active again in 1946 when it was leased to JohnVan Arsdale who offered flight lessons as part of the G.I. Bill. Services at <strong>Cape</strong> <strong>Cod</strong>Airport continued until 2003 when the Danforth family lease was not renewed. Aftermuch debate of what to do with the property, it was purchased by the Town of Barnstablefor $11.2 million and reopened as <strong>Cape</strong> <strong>Cod</strong> Airfield in 2004. Currently, the airfield isoperated by <strong>Cape</strong> <strong>Cod</strong> Flying Service and serves as a base for 14 aircrafts.<strong>Cape</strong> <strong>Cod</strong> <strong>Regional</strong> <strong>Transportation</strong> <strong>Plan</strong> | August 2011Chapter 2.6: Air <strong>Transportation</strong>Page 221
2.6.1.4 Otis Air Force BaseFIGURE 2 - CAPE COD AIRFIELDThe Otis Air Force Base (A.F.B), located between Mashpee and Sandwich, is owned bythe United States Air Force. Its two runways are used exclusively for military purposes.According to Federal Aviation Administration (FAA) records, Otis A.F.B. conducts anaverage of 89 aircraft operations per day.TABLE 2: CAPE COD RUNWAY INFORMATIONAirport FAAID andNameFMHOtis A.F.B.HYABarnstableMunicipalPVCProvincetownCQXChatham5B6Falmouth2B1<strong>Cape</strong> <strong>Cod</strong>AirfieldRunway SizeNo. (feet)14/32 9500’x 200’5/23 8000’x 200’6/24 5425’x 150’15/33 5252’x 150’7/25 3500’x 100’6/24 3001’x 100’7/25 2298’x 40’9/27 2700’x 60’17/35 2060’x 60’SurfaceAsphalt /ConcreteAsphalt /ConcreteAsphalt /GroovedAsphalt /GroovedRunwayMarkings*PrecisionPrecisionPrecisionPrecisionCondition(Surface:Markings)Good:GoodGood:GoodGood:GoodGood:GoodRunwayEdgeLightsHighIntensityHighIntensityHighIntensityHighIntensityWeightCapacity(wheels:tons)Single:32.5Double:80Tandem:165Single:32.5Double:80Tandem:165Single: 15Double:54Single: 15Double:54Single:12.5Single: 15Asphalt Precision Good:GoodHighIntensityAsphalt Basic Good: MediumFair IntensityAsphalt Basic Good: Low Single: 2Good IntensityTurf - Good: - - -Turf - Good: - - -Chapter 2.6: Air <strong>Transportation</strong> <strong>Cape</strong> <strong>Cod</strong> <strong>Regional</strong> <strong>Transportation</strong> <strong>Plan</strong> | August 2011Page 222
5/23 2035’ Turf - Good: - - -x 50’Source: AirNav, LLC.* Note: Runway markings provide landing information and instrument guidance for aircraft.Precision markings provide the maximum level, while basic markings provide a medium level;2.6.2 AIR SERVICEAir service on <strong>Cape</strong> <strong>Cod</strong> is primarily commercial passenger service, with a negligibleamount of airfreight service. Passenger service is provided through BarnstableMunicipal Airport in Hyannis and Provincetown Municipal Airport. Based on the 2002Five-Year Public <strong>Transportation</strong> <strong>Plan</strong>, only 16% of <strong>Cape</strong> <strong>Cod</strong> residents use the airports on<strong>Cape</strong> <strong>Cod</strong> for their air service needs (Figure 3). For <strong>Cape</strong> <strong>Cod</strong> residents, LoganInternational Airport in Boston is by far the most popular air transportation terminal.More residents are also flying out of Barnstable Municipal Airport than out of T.F. GreenInternational Airport in Warwick, RI. However, the length and destination of these tripsare very different. Air service from T.F. Green is generally provided by larger planesmaking longer trips, whereas 70% of air service out of Barnstable Municipal Airport isbetween Hyannis and Nantucket. As a result, “the primary role of the BarnstableMunicipal Airport is as a park-and-ride facility, serving passengers who are flying to andfrom Nantucket.”TABLE 3: ANNUAL ENPLANEMENTS BY AIRPORT 2008 & 2009EnplanementsAirport CY 08 CY 09 % ChangeBarnstable Municipal Airport 191,837 138,451 -27.83%Provincetown Municipal Airport 11,468 10,747 -6.29%Source: Barnstable Municipal Airport and FAA Enplanement StatisticsAirports Used by <strong>Cape</strong> <strong>Cod</strong> ResidentsLoganInternational(Boston)76%BarnstableMunicipal15%ProvincetownMunicipal1%T.F. GreenInternational(Warwick, RI)8%<strong>Cape</strong> <strong>Cod</strong> <strong>Regional</strong> <strong>Transportation</strong> <strong>Plan</strong> | August 2011Chapter 2.6: Air <strong>Transportation</strong>Page 223
FIGURE 3: AIRPORTS USED BY CAPE COD RESIDENTSSource: <strong>Cape</strong> <strong>Cod</strong> Transit Task Force Five-Year Public <strong>Transportation</strong> <strong>Plan</strong>, 2002Four carriers provide scheduled air service to <strong>Cape</strong> <strong>Cod</strong>. <strong>Cape</strong> Air, which has providedair service since 1989, is <strong>Cape</strong> <strong>Cod</strong>’s and America’s largest independent regional airline.With a fleet of over 50 Cessna 402’s, <strong>Cape</strong> Air provides service from Hyannis to Boston,Martha’s Vineyard, and Providence, and from Provincetown to Boston. In February1998, <strong>Cape</strong> Air partnered with Nantucket Airlines to provide service between Hyannisand Nantucket. Nantucket Airlines offers flights almost every half-hour, as well ascharter and air freight service.Another air service provider is Island Airlines. Island Airlines provides passenger servicealmost every half-hour to Nantucket, along with charter flights. In addition, the <strong>Cape</strong> &Islands Air Freight division provides airfreight service to the region.Lastly, U.S. Airways Express has scheduled flights from Hyannis to Nantucket, Boston,and LaGuardia International Airport in New York City. Colgan Air operates this serviceusing a 34-passenger SAAB 340 and a 19-passenger Beech 1900.FIGURE 4: AIR SERVICE ON CAPE CODChapter 2.6: Air <strong>Transportation</strong> <strong>Cape</strong> <strong>Cod</strong> <strong>Regional</strong> <strong>Transportation</strong> <strong>Plan</strong> | August 2011Page 224
2.6.3 AIR SERVICE ACCESSIBILITY AND MOBILITYBarnstable Municipal Airport is accessible by various means. According to the <strong>Cape</strong> <strong>Cod</strong>Transit Task Force Report, 69% of airport users arrive by automobile. Limited parking isavailable. Rental car service is provided by over a dozen rental car agencies, with taxiservice available as well. Moreover, the Villager Line of the <strong>Cape</strong> <strong>Cod</strong> <strong>Regional</strong> TransitAuthority provides local bus service to the airport upon request, carrying passengers tothe Hyannis <strong>Transportation</strong> Center and Barnstable Park-and-Ride lot. B-bus/DARTparatransit service to the airport can also be arranged. However, less than 1% arrives bybus.Provincetown Municipal Airport is primarily accessible by road. The ProvincetownShuttle service makes a stop at the airport, and connects air service passengers withinterregional bus service and ferry service in downtown Provincetown. ProvincetownMunicipal Airport is also located along a bicycle path, which serves users that aretraveling light. However, the majority of users access the Provincetown MunicipalAirport via automobile, including taxi.Mode of Airport Access by UsersRentalCar andTaxi24%Other6%PublicBus1%Auto69%FIGURE 5: MODE OF BARNSTABLE MUNICIPAL AIRPORT ACCESS BY USERSSource: <strong>Cape</strong> <strong>Cod</strong> Transit Task Force Five-Year Public <strong>Transportation</strong> <strong>Plan</strong>, 2002Interregional bus service also links travelers on <strong>Cape</strong> <strong>Cod</strong> to air service in Boston.Plymouth and Brockton Street Railway Company runs 16 buses each weekday from theHyannis <strong>Transportation</strong> Center to the terminals at Logan International Airport and 15per day on weekends and holidays. This route includes stops at the Barnstable and<strong>Cape</strong> <strong>Cod</strong> <strong>Regional</strong> <strong>Transportation</strong> <strong>Plan</strong> | August 2011Chapter 2.6: Air <strong>Transportation</strong>Page 225
Sagamore Park-and-Ride lots. By providing direct service to Logan InternationalAirport, Plymouth and Brockton provides travelers with increased access to domesticand international air services. Peter Pan Bus Lines currently offer six daily buses fromBourne to T.F. Green Airport in Providence, RI.Air service on <strong>Cape</strong> <strong>Cod</strong> offers users the potential of global mobility. With service tomajor air transportation hubs such as New York City, Boston, and Providence, a user cantransfer to domestic and international flights. Ironically, however, no scheduled flightsexist between <strong>Cape</strong> <strong>Cod</strong> airports. Thus, there is a great deal of air service mobilitybetween on-<strong>Cape</strong> and off-<strong>Cape</strong> sites, but no intraregional mobility.2.6.4 CONCLUSION<strong>Cape</strong> <strong>Cod</strong> has several airports that serve its various needs. Only two, BarnstableMunicipal Airport and Provincetown Municipal Airport offer scheduled air carrierservice. This service is provided by four carriers who connect <strong>Cape</strong> <strong>Cod</strong> residents to theIslands, Boston, and the world beyond. Although accounting for only a small percentageof <strong>Cape</strong> <strong>Cod</strong> transportation, air transportation provides a quick, road-free mode of travelto users. Encouraging travelers to fly to <strong>Cape</strong> <strong>Cod</strong> would reduce strain on roadways andlead to more efficient use of this underutilized mode. In the next 25 years, <strong>Cape</strong> <strong>Cod</strong>’sairports may see an increase in air traffic as carriers switch from the increasinglycongested major airports to smaller regional ones. To prepare for this, it may beadvantageous to assess the current state of the <strong>Cape</strong>’s major air facilities and study theirpotential future usage.Chapter 2.6: Air <strong>Transportation</strong> <strong>Cape</strong> <strong>Cod</strong> <strong>Regional</strong> <strong>Transportation</strong> <strong>Plan</strong> | August 2011Page 226
2.7 CANAL AREA TRANSPORTATIONAlmost everyone who has driven to <strong>Cape</strong> <strong>Cod</strong> has used one of the two highway bridgesspanning the <strong>Cape</strong> <strong>Cod</strong> Canal. In addition to the highway bridges, the <strong>Cape</strong> <strong>Cod</strong> CanalRailway Bridge presents the potential to transport people onto <strong>Cape</strong> <strong>Cod</strong> by rail. Thesethree bridges are each owned and maintained by the U.S. Army Corps of Engineers.Given that the canal effectively makes <strong>Cape</strong> <strong>Cod</strong> an island, the three canal bridges serveas the only means, excluding ferries, to transport vehicles to and from the <strong>Cape</strong>.Moreover, most people traveling to Martha’s Vineyard and Nantucket rely on the canalbridges to reach their respective seaports by roadway. The history, use, maintenance,and future of these bridges are of vital importance to the residents, businesses, andvisitors of <strong>Cape</strong> <strong>Cod</strong> and the Islands.2.7.1 CANAL HIGHWAY BRIDGES’ HISTORYIn 1928, Congress directed the Army Corps of Engineers to make improvements to thenarrow <strong>Cape</strong> <strong>Cod</strong> Canal (as configured by 1915). These improvements resulted in thecanal we have today – and result in highway bridges that provide a vertical clearance of135 feet above mean high water and a horizontal clearance of 480 feet. The bridges werebuilt from 1933 to1935 in land areas that were naturally elevated.THE SAGAMORE BRIDGE, UNDER CONSTRUCTION, IN 1934. SOURCE: U.S. ARMY CORPS OFENGINEERS<strong>Cape</strong> <strong>Cod</strong> <strong>Regional</strong> <strong>Transportation</strong> <strong>Plan</strong> | August 2011Chapter 2.7: <strong>Cape</strong> <strong>Cod</strong> Canal AreaPage 227
2.7.2 CANAL BRIDGE CONDITIONSCurrently, the Canal Bridges are owned and maintained by the Army Corps of Engineers(ACOE). As the bridges age and the average daily traffic volumes continue to rise, theACOE maintenance efforts are nearly continuous. Based on recent bridge inspectionreports, the <strong>Cape</strong> <strong>Cod</strong> Canal Highway bridges qualify for replacement under federalguidelines. The ACOE inspects and maintains both highway bridges over the <strong>Cape</strong> <strong>Cod</strong>Canal in safe condition; however, discussions about bridge replacement or another Canalcrossing have begun informally.In addition to the strategies for maintenance recommended by the Metropolitan<strong>Plan</strong>ning Organization (MPO) in this <strong>Regional</strong> <strong>Transportation</strong> <strong>Plan</strong> (RTP), there is aneed to consider the future Canal crossing. The Bourne and Sagamore bridges areincreasingly undergoing maintenance efforts that constrain mobility between <strong>Cape</strong> <strong>Cod</strong>and the mainland. While the cost and frequency of repairs increase, so does theinconvenience and economic detriment for residents, businesses, and visitors.This RTP therefore recommends a study by the <strong>Cape</strong> <strong>Cod</strong> Commission and itsconsultant(s) with the Army Corps of Engineers, stakeholders, and the public to focus onthe future Canal crossing. The study will include:• Options for a new crossing, e.g., bridge, tunnel, ferry...• Traffic flow capacity (vehicles per hour)• Bicycle and pedestrian facilities included or as a separate crossing• Consistency with emergency management plansThe result of this proposed study would be a recommendation for the future Canalcrossing concept, along with assignment of the design proponent(s). It is desirable tohave the stakeholders group and public process continue through the design process.During certain maintenance activities (roadbed resurfacing or reconstruction) andstructural repairs, lane closures may be required during parts of the day or continuouslyuntil completion. The effects of maintenance-related lane closures are discussed later inthis document.Chapter 2.7: <strong>Cape</strong> <strong>Cod</strong> Canal Area <strong>Cape</strong> <strong>Cod</strong> <strong>Regional</strong> <strong>Transportation</strong> <strong>Plan</strong> | August 2011Page 228
FIGURE 1 - BOURNE BRIDGEFIGURE 2 - SAGAMORE BRIDGE<strong>Cape</strong> <strong>Cod</strong> <strong>Regional</strong> <strong>Transportation</strong> <strong>Plan</strong> | August 2011Chapter 2.7: <strong>Cape</strong> <strong>Cod</strong> Canal AreaPage 229
FIGURE 3 - ROADWAY OVER SAGAMORE BRIDGEFIGURE 4 - SAGAMORE BRIDGE STRUCTUREChapter 2.7: <strong>Cape</strong> <strong>Cod</strong> Canal Area <strong>Cape</strong> <strong>Cod</strong> <strong>Regional</strong> <strong>Transportation</strong> <strong>Plan</strong> | August 2011Page 230
2.7.3 HIGHWAY BRIDGE CAPACITYAccording to MassDOT’s Canal Area Traffic Study (August 2006), each bridge has atheoretical directional peak capacity of approximately 3,400 vehicles per hour. Due tothe narrow lanes and the absence of a median, the capacity of the two bridge lanesopposing the peak direction is estimated to be approximately 30% less than the peakflow, or 2,400 vehicles per hour. This results in a two-way capacity of approximately5,800 vehicles per hour on each of the canal bridges.2.7.4 TRAFFIC VOLUMESTraffic over the bridges has continued to increase over the last 35 years (see followingfigure). However, traffic has decreased slightly since 2002. In 2009, the average dailytraffic (ADT) of both directions of travel on both highway bridges was over 95,000, witha summer ADT of over 127,000. Of the two bridges, the Sagamore Bridge is more heavilytraveled. The difference in average year-round bridge traffic volumes in 2009 is 5,000,as compared to the year 2000 when there were approximately 12,000 more vehiclescrossing the Sagamore Bridge than the Bourne Bridge.Comparing annual volumes to summer volumes, it is clear that the difference betweenthe two has remained similar over the last decade (see following figure). Therefore, anytraffic growth must be a result of year-round traffic, and not seasonal traffic. Whencompared to thirty years prior, bridge traffic volumes show significant change (seefollowing figure). Eight months of the year now exceed the peak volumes from 1975.Moreover, the peak volumes from 1975 are now similar to current off-peak volumes.<strong>Cape</strong> <strong>Cod</strong> <strong>Regional</strong> <strong>Transportation</strong> <strong>Plan</strong> | August 2011Chapter 2.7: <strong>Cape</strong> <strong>Cod</strong> Canal AreaPage 231
FIGURE 5 - COMBINED AVERAGE DAILY TRAFFIC OVER BOURNE AND SAGAMORE BRIDGES(Source: MassDOT)Chapter 2.7: <strong>Cape</strong> <strong>Cod</strong> Canal Area <strong>Cape</strong> <strong>Cod</strong> <strong>Regional</strong> <strong>Transportation</strong> <strong>Plan</strong> | August 2011Page 232
FIGURE 6 - DIFFERENCE BETWEEN SUMMER AND ANNUAL AVERAGE DAILY TRAFFIC OVERBOTH THE BOURNE AND SAGAMORE BRIDGES(Source: MassDOT)<strong>Cape</strong> <strong>Cod</strong> <strong>Regional</strong> <strong>Transportation</strong> <strong>Plan</strong> | August 2011Chapter 2.7: <strong>Cape</strong> <strong>Cod</strong> Canal AreaPage 233
FIGURE 7 - THIRTY-YEAR COMPARISON OF COMBINED AVERAGE DAILY TRAFFIC OVER THEBOURNE AND SAGAMORE BRIDGESChapter 2.7: <strong>Cape</strong> <strong>Cod</strong> Canal Area <strong>Cape</strong> <strong>Cod</strong> <strong>Regional</strong> <strong>Transportation</strong> <strong>Plan</strong> | August 2011Page 234
TABLE 1 - CAPE COD CANAL BRIDGES TRAFFIC VOLUMES 1971-2009(Source: MassDOT)<strong>Cape</strong> <strong>Cod</strong> <strong>Regional</strong> <strong>Transportation</strong> <strong>Plan</strong> | August 2011Chapter 2.7: <strong>Cape</strong> <strong>Cod</strong> Canal AreaPage 235
2.7.5 CAPE COD CANAL HIGHWAY BRIDGE MAINTENANCEThe Bourne and Sagamore bridges provide the only crossings of the <strong>Cape</strong> <strong>Cod</strong> Canal formotorists, pedestrians and cyclists. Maintained by the U.S. Army Corps of Engineers,the geometric design of each bridge includes a roadway width of 40 feet (four 10 footwide lanes) flanked by a 6-foot wide sidewalk on one side and a 2-foot wide safety curbon the other. The roadways are separated from the sidewalks and safety curbs by 16-inchhigh vertical granite curbing.The bridges first opened to traffic in 1935. Historic records indicate a general upwardtrend in the annual bridge crossings and this traffic is currently approaching 100,000vehicles per average day. Over the decades, the bridges have been exposed to deicingsalts, the effects of which include progressive deterioration of the concrete deck andsome steel members of the bridges. These effects are compounded by the fact that thebridges are located near salt water. An additional maintenance activity is the periodicpainting of the exposed steel portions of the bridges.For certain maintenance activities, including repairs to the concrete deck, the worksiterequires the closures of two lanes. For a bridge undergoing maintenance, the four lanesare reduced to two. Depending on the duration of the closure and the seasonal demand,significant delays and backups may occur. The ACOE is committed to minimizing theseconditions by avoiding daytime lane reductions during the summer months and limitingwork to one bridge at a time. Please see the introduction for a discussion on the bridgesregarding long-range planning issues.Estimates for delay at the Sagamore and Bourne BridgesThis section is intended to help identify critical “windows of opportunity” for schedulingmaintenance activities that require lane closures. Daytime during the July 4th holidayweekend would be a bad time for such activity, whereas midnight in February wouldhave minimal impact. This analysis should help identify other time periods that mayalso be acceptable.Bridge volumes observed during recent work on the Sagamore and Bourne Bridges werecompared to volumes observed in April and October 1999. Volumes observed on theSagamore and Bourne Bridges during recent closures led to an identification of the onelanecapacity of the bridges. A review of the hourly MassDOT traffic counts during thelane closures indicates that a sustained flow of about 1,250 vehicles per hour can crossthe bridge in each direction. It is logical that some vehicles in the theoretical backupwould divert to the other bridge (for analysis purposes, assume 20%) and some tripsobserved in 1999 would not be made (again, for analysis, assume 10%).Chapter 2.7: <strong>Cape</strong> <strong>Cod</strong> Canal Area <strong>Cape</strong> <strong>Cod</strong> <strong>Regional</strong> <strong>Transportation</strong> <strong>Plan</strong> | August 2011Page 236
In calculating the backups and delays, the cumulative number of cars that couldnot be accommodated was divided by the bridge capacity to get the maximumtheoretical delay for an average weekday (this is the amount of time required forthe peak demand to dissipate). The results are shown in the following table:TABLE 2 - THEORETICAL DAILY VEHICULAR DELAYS DURING BRIDGE LANE CLOSURESApril OctoberSagamore Bridge Northbound 1.7 hours 4.4 hoursSouthbound 2.4 hours 2.3 hoursBourne Bridge Northbound 0.3 hours 0.4 hoursSouthbound 0.3 hours 1.8 hoursImpacts to traffic will be most severe in the Fall during maintenance on the SagamoreBridge. Encouraging the use of the alternate bridge would be an important element ofany mitigation strategy. Impacts to the areas on bypass routes, (e.g., diversion fromRoute 6 westbound at Exit 2 through Sandwich), will be significant and some planning tominimize these impacts must also be done.Strategies related to Bridge MaintenanceSeveral strategies are suggested for addressing the impacts of maintenance-related laneclosures. In all cases, adequate public notification is recommended. In 2009, the ArmyCorps of Engineers established a website and email notification system for majormaintenance efforts on the bridges. The <strong>Cape</strong> <strong>Cod</strong> Commission is committed toproviding access to updates through the internet traveler information system(www.gocapecod.org). By providing timely warnings of impending closures, travelersmay adjust travel mode, choice of bridge crossing and approach routes, or timing. Thebridges do need to be maintained in order to continue to provide safe passage to andfrom the region. Foul weather may interfere sometimes in the maintenance efforts, andas a result the schedule prolonged. The ACOE seems to now include this aspect inconsideration of the estimated maintenance schedule, and that has provided forimproved public expectations.• Scheduling Maintenance Activities for Off-Peak Periods: minimizes disruptions totraffic during heavy travel periods. The Army Corps is already making efforts to achievethis - and should continue to do so. To the greatest extent possible, lane closures shouldavoid summer months and daytime periods during the spring and fall.• Intelligent <strong>Transportation</strong> Systems (ITS) is collection and dissemination of real-timeinformation through means such as cameras and/or cell phone data collection. Theinformation is available on the state traffic information website and 511 telephonesystem. This allows for travelers to check online or via cell phones on current traffic<strong>Cape</strong> <strong>Cod</strong> <strong>Regional</strong> <strong>Transportation</strong> <strong>Plan</strong> | August 2011Chapter 2.7: <strong>Cape</strong> <strong>Cod</strong> Canal AreaPage 237
conditions at the bridges. Radio stations also look up and provide updates on bridgetraffic. The <strong>Cape</strong> <strong>Cod</strong> Commission staff has included announcements of upcomingmaintenance activities and links to transportation providers on the <strong>Cape</strong> <strong>Cod</strong>Commission <strong>Transportation</strong> Information Center (www.gocapecod.org). Included is alink to the ACOE website to provide travelers with the latest information on laneclosures. Working together, the MassDOT and <strong>Cape</strong> <strong>Cod</strong> Commission (CCC) staffoutlined ITS improvements for the <strong>Cape</strong> <strong>Cod</strong> Canal bridge area. MassDOT then hired aconsultant to design ITS improvements, and the project was bid for construction inSeptember 2010.• Improve <strong>Transportation</strong> Alternatives to Offset Automobile Crossings by increasingexpress bus service, and improving marketing of bus and other alternatives. Themarketing should inform travelers of the advantages of using alternatives and thedisadvantages of driving during the lane closures. An additional strategy to enhance theattractiveness of buses and high-occupancy vehicles would be to allow travel on theshoulders (currently nonexistent on Route 6) of Routes 3, 6, 25, and 28 to bypass thequeues (under police supervision). This concept would include construction ofshoulders/breakdown lanes that could be used as a bus lane during peak times.This would encourage a shift from single-occupant vehicles and would likely result in anoverall reduction of vehicles traveling through the lane closures.• Traffic Management: reduces traffic conflicts. During periods of traffic congestion atthe Canal crossings, motorists seek alternate routes - regardless of whether or not suchroutes actually save travel time. In addition, such routings have effect on the capacity ofthe bridges, and may actually create bottlenecks in other locations such as the Exit Oneon-ramp at the approach of the Mid-<strong>Cape</strong> Highway westbound at the Sagamore Bridge.Techniques to be considered should include police officer traffic control, signage, andturn restrictions.2.7.6 CANAL AREA TRAFFIC MOVEMENTSUsing the <strong>Cape</strong> <strong>Cod</strong> <strong>Transportation</strong> Demand Model, an analysis of cross-canal trafficpatterns can be made. <strong>Cape</strong> <strong>Cod</strong> was separated into four quadrants, based on thelocation’s primary approach to the Canal. For example, Route 6 is the primary point ofaccess to the Canal of people from Hyannis and easterly points in the region. Theprimary point of access to the canal for people in Boston is Route 3. Using the model,the levels of traffic between the 4 quadrants can be determined. These traffic flows areillustrated in the following figure.This analysis does not give specific traffic volumes over the bridges or supportingroadways. What it shows is that 56,000 vehicles per day have a choice of what bridge totake. Therefore, if traffic needed to be diverted to avoid congestion, 56,000 vehiclescould be potentially diverted based on a modeled average summer day.Chapter 2.7: <strong>Cape</strong> <strong>Cod</strong> Canal Area <strong>Cape</strong> <strong>Cod</strong> <strong>Regional</strong> <strong>Transportation</strong> <strong>Plan</strong> | August 2011Page 238
FIGURE 8 - CROSS-CANAL TRAFFIC, ESTIMATED 2004 SUMMER ADT2.7.7 SUPPORTING ROAD NETWORKIn addition to the two highway bridges, there are several roadways that supportmovement over the Canal. These include the Scenic Highway, Sandwich Road, BelmontCircle, and the Sagamore Interchange. The Sagamore Interchange replaced theSagamore Rotary and area connections, beginning with the project advertising in 2004.The before-and-after diagrams are shown in the figures below.<strong>Cape</strong> <strong>Cod</strong> <strong>Regional</strong> <strong>Transportation</strong> <strong>Plan</strong> | August 2011Chapter 2.7: <strong>Cape</strong> <strong>Cod</strong> Canal AreaPage 239
FIGURE 9 - SAGAMORE CROSSING(note: Sagamore Rotary has been eliminated – see following figure)Chapter 2.7: <strong>Cape</strong> <strong>Cod</strong> Canal Area <strong>Cape</strong> <strong>Cod</strong> <strong>Regional</strong> <strong>Transportation</strong> <strong>Plan</strong> | August 2011Page 240
FIGURE 10 - SAGAMORE INTERCHANGE DIAGRAM<strong>Cape</strong> <strong>Cod</strong> <strong>Regional</strong> <strong>Transportation</strong> <strong>Plan</strong> | August 2011Chapter 2.7: <strong>Cape</strong> <strong>Cod</strong> Canal AreaPage 241
FIGURE 11 - BOURNE CROSSINGChapter 2.7: <strong>Cape</strong> <strong>Cod</strong> Canal Area <strong>Cape</strong> <strong>Cod</strong> <strong>Regional</strong> <strong>Transportation</strong> <strong>Plan</strong> | August 2011Page 242
2.7.7.1 Scenic HighwayScenic Highway (U.S. Route 6) stretches approximately 3 miles from the Belmont Circleto the Sagamore Interchange on the mainland side of the <strong>Cape</strong> <strong>Cod</strong> Canal. The roadwayis generally undivided four lanes, two in either direction, with a posted speed limit of 50MPH. As sections of this roadway have been improved, there have been medianinstallations. The improvements at the Sagamore Interchange have extended a raisedmedian from the traffic signal at Bournedale Road to the Route 3 interchange near theSagamore Bridge. Another section of raised median is included with the new trafficsignal at Edgehill Road.In addition to being an important connection between the Bourne and SagamoreBridges, The Scenic Highway also provides access to Buzzards Bay, Bournedale andSagamore. Most of the land along Scenic Highway is undeveloped but there are severallocal businesses, a shopping plaza and a camping area along the roadway.FIGURE 12 - SCENIC HIGHWAY (U.S. ROUTE 6), FACING EAST<strong>Cape</strong> <strong>Cod</strong> <strong>Regional</strong> <strong>Transportation</strong> <strong>Plan</strong> | August 2011Chapter 2.7: <strong>Cape</strong> <strong>Cod</strong> Canal AreaPage 243
FIGURE 13 - SCENIC HIGHWAY, FACING EASTFIGURE 14 - SCENIC HIGHWAY AT THE BOURNEDALE ROAD INTERSECTIONChapter 2.7: <strong>Cape</strong> <strong>Cod</strong> Canal Area <strong>Cape</strong> <strong>Cod</strong> <strong>Regional</strong> <strong>Transportation</strong> <strong>Plan</strong> | August 2011Page 244
2.7.7.2 Sandwich RoadSandwich Road connects the Bourne and Sagamore Bridge on the <strong>Cape</strong> <strong>Cod</strong> side of thecanal. The roadway stretches approximately three miles from the Bourne Rotary toInterchange 1 of Route 6. The roadway has two undivided lanes, one in either direction,and a posted speed limit of 45 MPH. Sandwich Road also provides access to Route 28,Route 6A and Sagamore Village. The Upper <strong>Cape</strong> <strong>Cod</strong> <strong>Regional</strong> Technical School, JohnGallo Ice Arena, several residences, and a recreation area are located on Sandwich Road.FIGURE 15 - SANDWICH ROAD FACING EAST<strong>Cape</strong> <strong>Cod</strong> <strong>Regional</strong> <strong>Transportation</strong> <strong>Plan</strong> | August 2011Chapter 2.7: <strong>Cape</strong> <strong>Cod</strong> Canal AreaPage 245
2.7.7.3 Belmont CircleThe Belmont Circle is a rotary named after August Belmont who was the developer of theoriginal <strong>Cape</strong> <strong>Cod</strong> Canal. The circle is located at the intersection of Route 25 Interchange2, Scenic Highway (U.S. 6), Buzzards Bay Bypass (U.S. 6), Head of the Bay Road, andMain Street (Route 28) in Buzzards Bay. The rotary is shaped roughly like a trapezoidabout 1,990 feet in circumference. The longest side (from Main Street to ScenicHighway) is approximately 650 feet long; the shortest side (from the Route 6 Bypass toMain Street) is approximately 265 feet long. It was configured during the creation of theRoute 25 extension to the Bourne Bridge in 1987. The roadway has three lanes, travelingcounter-clockwise, and a posted speed limit of 45 MPH. Rotary traffic has the right-ofway.Several businesses also have access points within the rotary.FIGURE 16 - THE BELMONT CIRCLE, FACING EAST TOWARDS THE SCENIC HIGHWAYChapter 2.7: <strong>Cape</strong> <strong>Cod</strong> Canal Area <strong>Cape</strong> <strong>Cod</strong> <strong>Regional</strong> <strong>Transportation</strong> <strong>Plan</strong> | August 2011Page 246
FIGURE 17 - SIGNS DIRECTING MOTORISTS THROUGH THE BELMONT CIRCLE<strong>Cape</strong> <strong>Cod</strong> <strong>Regional</strong> <strong>Transportation</strong> <strong>Plan</strong> | August 2011Chapter 2.7: <strong>Cape</strong> <strong>Cod</strong> Canal AreaPage 247
2.7.7.4 Sagamore Interchange (formerly Sagamore Rotary)The Sagamore Interchange is located at the base of the Sagamore Bridge on themainland side. It is located at the intersection of Route 3 Interchange 1, Scenic Highway,Route 6 and Route 3A. The intersection was previously the Sagamore Rotary. OnSeptember 10, 2006, the rotary was officially removed, and replaced by an interchange.The interchange includes a series of ramps for direct service to Route 3. Route 6 ScenicHighway passes beneath newly constructed Route 3 bridges. The project includessignalization at three intersections and will include a replacement Park-and-Ride lotadjacent to the interchange.FIGURE 18 - THE FORMER SAGAMORE ROTARY AND CONGESTIONChapter 2.7: <strong>Cape</strong> <strong>Cod</strong> Canal Area <strong>Cape</strong> <strong>Cod</strong> <strong>Regional</strong> <strong>Transportation</strong> <strong>Plan</strong> | August 2011Page 248
FIGURE 19 - ROUTE 3 CONGESTION AT THE FORMER SAGAMORE ROTARY, FROM SCENICHIGHWAYFIGURE 20 - THE SAGAMORE INTERCHANGE OVERPASS, DURING CONSTRUCTION<strong>Cape</strong> <strong>Cod</strong> <strong>Regional</strong> <strong>Transportation</strong> <strong>Plan</strong> | August 2011Chapter 2.7: <strong>Cape</strong> <strong>Cod</strong> Canal AreaPage 249
2.7.7.5 Route 6 Interchange 1Route 6 Interchange 1 is located at the base of the Sagamore Bridge on the <strong>Cape</strong> side. Itallows access to Route 6 from Route 6A and Sandwich Village. Westbound access rampshave direct access from Route 6A. The westbound on-ramp is within close proximity tothe upgrade of the Sagamore Bridge and is a source of significant queuing during heavyoff-<strong>Cape</strong> traffic. Service to and from Route 6 eastbound is via the “Mid-<strong>Cape</strong> Connector”road from Sandwich Road. The Mid-<strong>Cape</strong> Connector is a two-way ramp system thatincludes local unsignalized intersection access to a factory outlet center and the U.S.military’s PAVE PAWS radar installation.FIGURE 21 - THE MID-CAPE CONNECTOR (INTERCHANGE 1) NORTH OF THE OUTLET STOREENTRANCE2.7.7.6 Bourne RotaryThe Bourne Rotary connects Route 28 and <strong>Cape</strong> <strong>Cod</strong> to the Bourne Bridge. It is locatedat the intersection of Route 28 (MacArthur Boulevard), Trowbridge Road, SandwichRoad, and the Bourne Bridge. The rotary is approximately 400 feet in diameter, andapproximately 1,250 feet in circumference. The roadway has two unmarked lanes,traveling counter clockwise, and a posted speed limit of 25 MPH. Rotary traffic has theright of way.Chapter 2.7: <strong>Cape</strong> <strong>Cod</strong> Canal Area <strong>Cape</strong> <strong>Cod</strong> <strong>Regional</strong> <strong>Transportation</strong> <strong>Plan</strong> | August 2011Page 250
2.7.8 RAILROAD BRIDGEThe third bridge over the <strong>Cape</strong> <strong>Cod</strong> Canal is also an United States Army Corps ofEngineers (ACOE) owned bridge, and is the vertical lift railroad bridge.This bridge was substantially upgraded in 2001-2003 through a two-phase effort thatwas coordinated by the Army Corps of Engineers with the Commonwealth ofMassachusetts Executive Office of <strong>Transportation</strong> (EOT), and cost approximately$27,000,000. Please note that EOT is now the Massachusetts Department of<strong>Transportation</strong> (MassDOT).Rail information is contained in sub-chapter 2.4 of this <strong>Plan</strong>.2.7.9 CONCLUSIONThe <strong>Cape</strong> <strong>Cod</strong> Canal area highway system provides transportation infrastructure forthousands of motorists and many truckers each day. The heavily-traveled and aginghighway bridges are becoming a continuing source of concern due to their narrow lanesand frequent need for maintenance. Historic traffic growth now results in increasesthroughout the year, resulting in off-season traffic of current years exceeding that ofpeak summer conditions of a couple of decades ago. The railroad bridge serves animportant function in the transport of regional solid waste, and may have opportunitiesfor other uses such as passenger rail.Because of the close relationship of the two highway bridges in the center of the Town ofBourne with the connecting roadways for both local and intraregional traffic, the CanalArea needs to be studied as a sub-system both in the region and connecting <strong>Cape</strong> <strong>Cod</strong>with the rest of the world. This sub-system data collection and analysis approach willallow for proposed transportation and access improvements to be analyzed in relation toeach other and overall, and will provide the most coherent effort to date. This is a criticalplanning need and area for the region.<strong>Cape</strong> <strong>Cod</strong> <strong>Regional</strong> <strong>Transportation</strong> <strong>Plan</strong> | August 2011Chapter 2.7: <strong>Cape</strong> <strong>Cod</strong> Canal AreaPage 251
Chapter 2.7: <strong>Cape</strong> <strong>Cod</strong> Canal Area <strong>Cape</strong> <strong>Cod</strong> <strong>Regional</strong> <strong>Transportation</strong> <strong>Plan</strong> | August 2011Page 252
2.8 SUB-REGIONAL ISSUESEach town, village, business district, and even each neighborhood will have a slightlydifferent (and in a handful of cases a drastically different) set of options and conditionsthat affect, and are affected by, travel. For a document of this scope it would beimpossible, and imprudent, to provide such detail. Some comparisons and evaluationcan be made at a larger scale. Therefore, transportation at the “local” scale is discussedfor Sub-Regions identified in the following figure and described in the following sections.FIGURE 1 - CAPE COD SUB-REGIONS<strong>Cape</strong> <strong>Cod</strong> <strong>Regional</strong> <strong>Transportation</strong> <strong>Plan</strong> | August 2011Chapter 2.8: SubregionsPage 253
2.8.1 UPPER CAPEThe Upper <strong>Cape</strong> includes the townsof Bourne, Sandwich, Falmouth, andMashpee. The Upper <strong>Cape</strong> is alsodominated by the MassachusettsMilitary Reservation (MMR). Thereis a portion of the MMR in all fourUpper <strong>Cape</strong> towns. <strong>Transportation</strong>facilities are located within theMMR, including freight rail service,connections between Sandwich andBourne, and the Otis Air Force Base.In addition, schools and jobs arelocated within the base.The Upper <strong>Cape</strong> towns make up themainland gateway to the <strong>Cape</strong>. Theyconsist of 38% of the land area of<strong>Cape</strong> <strong>Cod</strong>, and contain 86,526 (2009Census estimates) residents or39.1% of the <strong>Cape</strong>’s population. For<strong>Cape</strong> residents, they also contain35.1% (31,051 of 88,409) of the jobsin the county. The Upper <strong>Cape</strong> areaincludes regional and local services, such as the transportation connections, shoppingcenters, and Falmouth Hospital.This area is identified as the Upper <strong>Cape</strong> (despite its compass-orientation compared toother sub-regions) since it is the closest to the mainland (and rising elevations).2.8.1.1 <strong>Transportation</strong> FacilitiesThe transportation infrastructure in this sub-region includes approximately 1,200 milesof roadway, intercity and local bus services, limited rail service, and ferry service.Roadway NetworkThe <strong>Cape</strong> <strong>Cod</strong> Canal bisects the towns of Bourne and Sandwich and is bridged in justthree places, two for vehicular traffic and one for rail. The three major corridors thatconnect this sub-region to other parts of <strong>Cape</strong> <strong>Cod</strong> are Route 6A, Route 6, and Route 28.Regarding both Falmouth and Mashpee, both Route 6A and Route 6 have functionsdistinct from roadways such as Route 28. Since Route 6 and Route 6A provide onlyprovide service well beyond the boundaries of these towns, their function is limited tolonger-distance regional travel for travelers to or from Falmouth or Mashpee. AdditionalChapter 2.8: Subregions <strong>Cape</strong> <strong>Cod</strong> <strong>Regional</strong> <strong>Transportation</strong> <strong>Plan</strong> | August 2011Page 254
egional corridors serve as a network for the sub region. Route 151 from Route 28 inFalmouth near the Bourne town line crosses through North Falmouth and connects toRoute 28 in Mashpee. Route 130 from Route 6A to Route 6 in Sandwich and on to Route28 in Barnstable just east of Mashpee/Barnstable town line connects Mashpee withSandwich and allows access to Route 6.Transit ServiceBonanza Bus Lines/Peter Pan provides intercity service from this sub-region to Bostonand Logan Airport and Providence, Rhode Island. The CCRTA operates the SeaLine; aregional year-round fixed route bus service that travels from Falmouth through Mashpeeprimarily on Route 28 to the Hyannis <strong>Transportation</strong> Center. The Park-and-Ridecommuter lot in Sagamore is serviced by P&B for trips to and from Boston. The CCRTAoperates the “WHOOSH,” a summer trolley shuttle, between downtown Falmouth Malland Woods Hole. Additionally, the Greater Attleboro <strong>Regional</strong> Transit Authority(GATRA) operates the “OWL” (Onset-Wareham Link) with service to the MassachusettsMaritime Academy, Main Street in Buzzards Bay, and across the Bourne Bridge toTedeschi’s (convenience store) near the Bourne Rotary. The <strong>Cape</strong> <strong>Cod</strong> RTA b-bus/Dial-A-Ride <strong>Transportation</strong> (DART) service is a paratransit service operating seven days aweek for any resident in the upper <strong>Cape</strong>.Ferry ServiceThis sub-region also has links by water between Falmouth and Martha’s Vineyard. TheSteamship Authority ferries operate between Woods Hole and the Vineyard carryingpassengers, bicycles, automobiles, and trucks. In the summer of 2010, the SSA operatedclose to 30 round trips per summer weekday (some of these trips were freight deliveries,and would only take passengers if space was available). In addition, two private ferryoperators provide passenger service between Falmouth Harbor and Martha’s Vineyardduring the summer season.Bike FacilitiesThe Boston to <strong>Cape</strong> <strong>Cod</strong> Bikeway, also known as State Bicycle Route 1 and the ClaireSaltonstall Bikeway reach the <strong>Cape</strong> <strong>Cod</strong> region on Route 3A in Bourne and follows Route3A to Meetinghouse Road that connects to the Sagamore Bridge. Once over the Bridge,this bicycle route connects with Route 6A to the intersection with Route 130 inSandwich. State Bicycle Route 1 proceeds south on Route 130 to its junction with theService Road in Sandwich. The bike route continues on the Service Road in Sandwichand into the Town of Barnstable. Other bicycle trails include the bike paths along bothsides of the Canal in Bourne and the Shining Sea Bike Path which connects NorthFalmouth to Woods Hole passing the downtown.<strong>Cape</strong> <strong>Cod</strong> <strong>Regional</strong> <strong>Transportation</strong> <strong>Plan</strong> | August 2011Chapter 2.8: SubregionsPage 255
Rail ServiceThe third bridge across the <strong>Cape</strong> <strong>Cod</strong> Canal is the railroad bridge. Typical <strong>Cape</strong> <strong>Cod</strong>freight shipments by rail are made three to four times per day year round; this isprimarily to transport trash to the SEMASS waste-to-energy plant in Rochester. The<strong>Cape</strong> <strong>Cod</strong> Central Railroad operates excursion train service between Hyannis andSandwich (typically four round trips during the tourist season).2.8.1.2 <strong>Transportation</strong> Issues and ProblemsUnder-utilized third (rail) bridge over the <strong>Cape</strong> <strong>Cod</strong> Canal;Most of freight shipment is by trucks;Recent land development which is auto-oriented;A need for more local transit service;Motor vehicle traffic congestion on highway bridges;Improved ferry service from off-<strong>Cape</strong> locations to the islands; andMaintenance of Bridges<strong>Cape</strong> <strong>Cod</strong> Canal AreaAn important transportation subset of the Upper <strong>Cape</strong> contains the roads and bridgesalong and over the <strong>Cape</strong> <strong>Cod</strong> Canal. The Canal Area includes the approaches to theSagamore and Bourne Bridges and the roadway systems that serve the area. This areahas been the subject of a number of studies that have looked at improvements and majornew construction such the replacement of the old Sagamore Rotary.A number of promising projects have been developed by the Canal Area preliminaryplanning study which includes: Sandwich Road Parkway Relocation of Interchange 1- Interim closures of the westbound Exit 1 on-ramp to help improve traffic flowover the Sagamore Bridge in the off-<strong>Cape</strong> direction Median Barrier for the Scenic Highway Scenic Highway/Route 25 Ramp Canal Area Intelligent <strong>Transportation</strong> Systems (ITS)Two of these projects (Sandwich Road Parkway and the Scenic Highway/Route 25Ramp) have been adopted by the Bourne <strong>Plan</strong>ning Board. These promising projectsneed to be pursued further as they appear to have significant potential benefits. The<strong>Cape</strong> <strong>Cod</strong> Canal area transportation system is discussed in greater detail in the previoussub-chapter (2.7).Chapter 2.8: Subregions <strong>Cape</strong> <strong>Cod</strong> <strong>Regional</strong> <strong>Transportation</strong> <strong>Plan</strong> | August 2011Page 256
2.8.2 MID-CAPEThe Mid-<strong>Cape</strong> includes the towns of Barnstable, Yarmouth, and Dennis and form the“urban core” of the <strong>Cape</strong>. They include 27% of the land area of <strong>Cape</strong> <strong>Cod</strong>, and contain85,550 residents or 38.7% of the <strong>Cape</strong>’s population. They also contain 44.1% (38,956 of88,409) of the jobs in the county.2.8.2.1 <strong>Transportation</strong> FacilitiesThe transportation infrastructure for this sub-region includes approximately 800 milesof roadways, intercity and local bus services, limited rail service, commercial airlineservice and ferry service. An intermodal transportation center to coordinate thesedifferent transportation services in Hyannis was opened in 2002 near the existing busand railroad stations. Mobility to and within this “urban core” is beneficial for access toregional and local services, such as the transportation connections, the <strong>Cape</strong> <strong>Cod</strong>Hospital, Route 132 retail areas and downtown Hyannis. Other facilities in theBarnstable/Yarmouth area include <strong>Cape</strong> <strong>Cod</strong> Community College, located on Route 132,the YMCA, the <strong>Cape</strong> <strong>Cod</strong> Conservatory, and the Barnstable County Complex on Route6A.The major west-east corridors (Route 6, Route 6A, and Route 28) link the towns ofBarnstable, Yarmouth, and Dennis both amongst each other and the other sub-regions of<strong>Cape</strong> <strong>Cod</strong>. Rail right-of-way comes into the Town of Barnstable from the west and forkswith one section heading through Yarmouth and Dennis to Route 134 and the other<strong>Cape</strong> <strong>Cod</strong> <strong>Regional</strong> <strong>Transportation</strong> <strong>Plan</strong> | August 2011Chapter 2.8: SubregionsPage 257
turning south, terminating in Hyannis. This sub-region also has links by air and waterin the Hyannis area of Barnstable. Commercial air services are available at theBarnstable Municipal Airport and ferries operate from Hyannis Harbor to the islands.Roadway NetworkThe three primary roadway corridors are Route 6, Route 28, and Route 6A. Route 6 is afour-lane freeway divided by a vegetated median. Route 28 is mostly a two-lane roadwaywith occasional turning lanes, with a short, four-lane section in Centerville. Route 6A isan historic/scenic byway with two narrow lanes and roadside features such as stone wallsand large trees.The limited-access, four-lane, median-divided, Mid-<strong>Cape</strong> Highway, or Route 6, has fiveaccess points through this section of <strong>Cape</strong> <strong>Cod</strong>. Major regional roadways emanate inboth northerly and southerly directions from the Route 6 exits. Commercial areas havedeveloped on four of these north/south connectors increasing travel demand and leadingto sections of widened four-lane roadway on Route 132 and three lanes on UnionStreet/Station Avenue.Transit ServiceScheduled Plymouth & Brockton Street Railway Co. bus service operates from Bostoninto Hyannis on Route 6 stopping at the Park-and-Ride commuter lot in Barnstable andcontinuing down Route 132 and Barnstable Road to the transportation center indowntown Hyannis. The <strong>Cape</strong> <strong>Cod</strong> RTA operates a regional year-round fixed route busservice called the SeaLine from Falmouth to the Hyannis <strong>Transportation</strong> Center. AlongRoute 28 from Hyannis to Orleans, the <strong>Cape</strong> <strong>Cod</strong> RTA operates the H2O Line, a yearroundbus service. The <strong>Cape</strong> <strong>Cod</strong> RTA also operates a paratransit service called the b-bus/Dial-A-Ride <strong>Transportation</strong> (DART). The b-bus/DART operates in all towns of themid-<strong>Cape</strong>, 7 days a week, year round.Bike FacilitiesThe State Bicycle Route 1 or Claire Saltonstall Bike Route follows the Service/AccessRoad in Barnstable from the Sandwich town line across Route 149 to Route 132, Route132 to Phinneys Lane, Phinneys Lane/Hyannis Road to Route 6A, and east to SetucketRoad in Yarmouth. This route continues along Setucket Road as a bike path into Dennisand Brewster. The western trailhead of the <strong>Cape</strong> <strong>Cod</strong> Rail Trail is located on Route 134.A north/south bicycle path branches from the Claire Saltonstall route at Route 149 andheads south along Old Stage Road leading to a path along the south side of Route 28which runs east to Bearses Way in Hyannis. Many bicyclists are making trips in the subregionthough few roadways comfortably accommodate bicycle use.Chapter 2.8: Subregions <strong>Cape</strong> <strong>Cod</strong> <strong>Regional</strong> <strong>Transportation</strong> <strong>Plan</strong> | August 2011Page 258
Air ServiceThis region contains the major commercial airport on <strong>Cape</strong> <strong>Cod</strong>, Barnstable MunicipalAirport. Air service is available several times each day on several different carriersbetween the Barnstable Municipal Airport and other destinations including the Islandsand Boston.Rail ServiceThe <strong>Cape</strong> <strong>Cod</strong> Central Railroad operates excursion train service between Hyannis andSandwich. Service includes four round trips of various types of excursions on Tuesdaysthrough Sundays during the tourist season.Ferry ServiceThe Steamship Authority operates passenger, automobile, and truck ferry servicebetween Hyannis and Nantucket year-round. Private companies operate passengerservice between Hyannis and Nantucket year-round and passenger service betweenHyannis and Martha’s Vineyard during the summer.North/South <strong>Transportation</strong> LinksThere are five areas within the Mid-<strong>Cape</strong> that provide north/south transportationconnections from the transportation “spine” of Route 6:Roadway Links In the western part of Barnstable, Route 149 (a two lane roadway) connects Route 6Aand 28 as well as providing access to Route 6 at exit 5.Route 132 in Barnstable/Hyannis provides a link from Route 6A and Route 6 at Exit6 to the Barnstable Municipal Airport and Route 28 at the Airport Rotary whereRoute 132 terminates. Route 132, the <strong>Cape</strong>’s largest commercial and retail corridor, istwo lanes from Route 6A to just before the signalized intersection at Phinneys Lanewhere it widens to an undivided four lane roadway. The four lane roadway continuesthrough three more signalized intersections to the <strong>Cape</strong>town Plaza and the <strong>Cape</strong> <strong>Cod</strong>Mall entrances where a small median barrier exists. Route 132 narrows as itapproaches and connects with Route 28 at the Airport Rotary.Willow Street in Yarmouth at Route 6, exit 7 connects with Route 6A to the north andYarmouth Road at the Barnstable town line which leads to Route 28 and intoHyannis for an alternative to 132 for access to the downtown area. This access toMain Street, Hyannis passes the new Steamship Authority parking lot at the cornerof Yarmouth Road and Main Street; this lot is just east of the railroad tracks and theHyannis <strong>Transportation</strong> Center. In addition, this exit is the primary access route tothe <strong>Cape</strong> <strong>Cod</strong> Hospital from Route 6. From Willow Street near the Route 6 exitramps, Higgins Crowell Road provides a connection to Route 28 in West Yarmouth.Higgins Crowell Road also intersects with Buck Island Road, an alternative to Route<strong>Cape</strong> <strong>Cod</strong> <strong>Regional</strong> <strong>Transportation</strong> <strong>Plan</strong> | August 2011Chapter 2.8: SubregionsPage 259
28 for east-west traffic in the area and may be realigned at the Willow Street end toimprove traffic flow at Exit 7. Further south from Route 6 down Willow Street isCamp Street which also connects both to Buck Island Road and Route 28. Thoughtravel demand is high in this area, few alternative provisions are present. The Townof Yarmouth has recently constructed improvements for Buck Island Road whichinclude bicycle accommodation. Route 28 has bicycle traffic, especially in thesummer season when seasonal workers commute via bicycle, yet the roadway hasmany access points and no markings for bicyclists.Union Street/Station Avenue at Exit 8 in Yarmouth is a main connector betweenRoute 6A and Route 28 for destinations in Yarmouth and Dennis. This corridorincludes an undivided roadway and offers few alternatives to the automobile.Route 134 in Dennis provides a link form Route 6A in the north and Route 28 in thesouth to Route 6. Local road connections at either end serve neighborhoods andbeaches. This roadway is two lanes except for a four-lane section between Route 6and Upper County Road. This section, near the Patriot Square shopping center alsoincludes a center lane for turning. Traffic signals are located at Route 6A, SetucketRoad, Bob Crowell Road, Patriot Square, T.F. Smith Road, Upper County Road, andat Route 28. Adjacent to Route 134 is the parking lot for the western end of the <strong>Cape</strong><strong>Cod</strong> Rail Trail. The interchange at Route 6 and 134 is the first full-cloverleaf(directional ramps at all four quadrants) on <strong>Cape</strong> <strong>Cod</strong>.Transit Service A year round bus service connecting the villages of Cotuit, Marstons Mills, and WestBarnstable via Route 149 was tried from November 1995 through June 1996 and hadlittle ridership. The area is primarily low-density housing north of Route 6.The <strong>Cape</strong> <strong>Cod</strong> <strong>Regional</strong> Transit Authority operates a local bus service called theVillager. The Villager service begins at the Barnstable County complex, travels alongRoute 6A to Route 132 and connects with each of the Malls and to the BarnstableMunicipal Airport and terminates at the Hyannis <strong>Transportation</strong> Center. The busoperates eleven daily round-trips, Monday through Friday, and seven round-trips onSaturdays.2.8.2.2 <strong>Transportation</strong> Issues and ProblemsGeography, environmental constraints, cost, character issues, and policy restraintsgenerally make it difficult to building additional highway systems or add capacity to theexisting roadways. Many in the area have expressed a strong desire to find alternativesto widening roadways.Development of a more balanced and coordinated system will improve the efficiency ofthe Barnstable/Yarmouth area infrastructure in a cost-effective and environmentallyfriendly manner thereby improving the quality of life. Town-level policy and land usedecisions affect the operation of the transportation assets and must includeconsideration of the transportation implications. Growth centers must be chosen whichprovide for efficient transit connections to encourage this alternative. WithChapter 2.8: Subregions <strong>Cape</strong> <strong>Cod</strong> <strong>Regional</strong> <strong>Transportation</strong> <strong>Plan</strong> | August 2011Page 260
edevelopment or new development along major routes, the responsible agencies shouldrequire a transit oriented connection to the major roadways and require parking to belocated at the back or side of the development. To support development of thesealternate modes in the Barnstable/Yarmouth area, some alternatives have beenidentified:The intermodal center in Hyannis has the potential to create a more efficient,connected system for transfers between modes which will aid in allowing for moretrips without an automobile. In addition, increased trips by pedestrians andbicyclists will be encouraged with improvements for safety of these trip types.Accommodation of bicycles with the addition of lanes for this mode should beconsidered for major routes such as Routes 28 and 132.A bicycle connection to the intermodal center site as a spur from the westerlyextension of the <strong>Cape</strong> <strong>Cod</strong> Rail Trail into Yarmouth and Barnstable will provideadditional alternative mode benefits for the region.2.8.3 LOWER CAPEThe Lower <strong>Cape</strong> includes the towns of Harwich, Chatham, Brewster, and Orleans andlies east of the heavily developed Mid-<strong>Cape</strong> and south of the Outer <strong>Cape</strong>. These townsmake up the “elbow” of <strong>Cape</strong> <strong>Cod</strong>. This sub-region is approximately 19% of the land areaof the <strong>Cape</strong>. In 2000, these towns contained 35,231 residents (15.9% of the <strong>Cape</strong>) and15% (13,241 of 88,409) <strong>Cape</strong> <strong>Cod</strong>’s jobs.<strong>Cape</strong> <strong>Cod</strong> <strong>Regional</strong> <strong>Transportation</strong> <strong>Plan</strong> | August 2011Chapter 2.8: SubregionsPage 261
2.8.3.1 <strong>Transportation</strong> FacilitiesThis region has an extensive network of roads; 63 miles of state highways and over 400miles of local roads. However, it has a limited transit system. It does, however, containseveral bikeways and roads appropriate for biking. Mobility across this region isimportant because it provides the only land connection to the Outer <strong>Cape</strong>. It alsocontains several regional destinations such as Nickerson State Park, <strong>Cape</strong> <strong>Cod</strong> NationalSeashore sites, and the commercial center of Orleans.Roadway NetworkRoutes 6, 6A, and 28 all traverse the region from the Dennis boundary to the Orleansrotary, where they all meet. In addition, Routes 134, 124, and 137 cross the sub-regionfrom north to south, Route 39 also cuts across Harwich and Chatham, providing ashorter route than Route 28 across the southern part of the sub-region. In 1996 a Parkand-Ridelot with room for 77 cars opened at the Route 6/Route 124 interchange inHarwich (exit 10).It is interesting to note that the directional signs on some state routes in this sub-regionare confusing due to the geography of the sub-region. For example, Route 28 is signed asRoute 28 South as it heads from Dennis to Orleans despite the fact that it travels firsteast, then north before ending at the Orleans Rotary.Transit ServiceP&B operates 6 round-trips per day along Route 6 from Hyannis to Provincetown duringthe summer. The <strong>Cape</strong> <strong>Cod</strong> RTA runs six trips per day on the H2O Line along Route 28from Hyannis to Orleans. Introduced in 2006, the Flex service provided fixed-scheduleservice with deviations of up to ¾ mile from its main route. Flex service included majorcorridors and destinations in the towns of Harwich, Brewster, Orleans, Eastham,Wellfleet, and Truro, in addition to coordination with Provincetown shuttle service.Rail ServiceTracks coming from the west have been abandoned east of the Yarmouth transferstation. There is no longer any rail service in this sub-region. The tracks that formerlycrossed into the region have now been replaced by the <strong>Cape</strong> <strong>Cod</strong> Rail Trail.Bike FacilitiesThe main bike facility in this sub-region is the <strong>Cape</strong> <strong>Cod</strong> Rail Trail, built on the old railright-of-way from Dennis to Wellfleet. This route provides a major east-west corridor for(mostly recreational) bike traffic across the elbow of <strong>Cape</strong> <strong>Cod</strong>. This bike path isuninterrupted and serves many villages, beaches, and Nickerson State Park whereChapter 2.8: Subregions <strong>Cape</strong> <strong>Cod</strong> <strong>Regional</strong> <strong>Transportation</strong> <strong>Plan</strong> | August 2011Page 262
additional bike facilities exist. The Harwich-Chatham Spur connects downtown Chathamto the Rail Trail near Harwich center.Air ServiceThere is only one airport in this region, Chatham Airfield, and no scheduled commercialtraffic uses this airfield.Ferry ServiceHigh speed passenger ferry service, which accommodates bicycles, operates fromHarwich to Nantucket during the summer. This service operates from late May untilColumbus Day and includes 3 round trips per day.2.8.3.2 <strong>Transportation</strong> Issues and ProblemsThis area is generally less congested than other areas of the <strong>Cape</strong>, although certain roadsegments such as Main Street in Chatham, west of downtown, operate well over capacityduring peak hours. However, as noted in the Monomoy Capacity Study, the roads of thisregion are predicted to become considerably more congested in the next ten years ifcurrent land use patterns and growth rates continue. If the current trend of convertingseasonal housing to year-round use continues, congestion could continue to worsen, andmay persist for longer portions of the year.The Lower -<strong>Cape</strong> region is also where Route 6 becomes a limited access highway withone lane in each direction (between exit 9 in Dennis and exit 10 in Harwich). This is anunusual configuration, particularly because an entire section of the highway is builtalong only half of the right-of-way. The right-of-way was acquired as part of the originalplan to build a four lane highway all the way to the Orleans rotary from the <strong>Cape</strong> <strong>Cod</strong>Canal. Lane separation, a center berm, and delineation improvements were installed inthe late 1980s and early 1990s to improve safety for two-lane operation.<strong>Cape</strong> <strong>Cod</strong> <strong>Regional</strong> <strong>Transportation</strong> <strong>Plan</strong> | August 2011Chapter 2.8: SubregionsPage 263
2.8.4 OUTER CAPEThe Outer <strong>Cape</strong> includes the towns Eastham, Wellfleet, Truro, and Provincetown. Muchof the Outer <strong>Cape</strong> is protected from development by the National Seashore. The Outer<strong>Cape</strong> towns include 16% of the land area of <strong>Cape</strong> <strong>Cod</strong>, and contain an estimated 13,844year round residents (6.3% of the <strong>Cape</strong>). They also possess 5.8% (5,161 of 88,409) of thejobs in the county.2.8.4.1 <strong>Transportation</strong> Facilities<strong>Transportation</strong> infrastructure includes over 430 miles of state and town maintainedroadway, limited intercity and local bus services, commercial airline service, andpassenger ferry service. Various bicycle paths exist through the area; pedestrian facilitiesare primarily located in village centers.Route 6 is the major north-south corridor that links the Outer <strong>Cape</strong> towns - both to eachother and the other sub-regions of <strong>Cape</strong> <strong>Cod</strong>. Small-scale commercial air services areavailable at the Provincetown Airport. Passenger ferries between Provincetown andPlymouth or Boston operate 6 round trips during the summer.Chapter 2.8: Subregions <strong>Cape</strong> <strong>Cod</strong> <strong>Regional</strong> <strong>Transportation</strong> <strong>Plan</strong> | August 2011Page 264
Roadway NetworkThe main road in the region, Route 6, includes a four lane undivided cross-sectionthrough most of Eastham without shoulders. From South Wellfleet to Truro, Route 6 isrestricted to two lanes with shoulders and occasional turning and through lanes atintersections. In North Truro to Provincetown, Route 6 is four lanes with a vegetatedmedian in some sections.Transit ServiceScheduled Plymouth & Brockton Street Railway Co. bus service operates fromProvincetown to Hyannis. Currently the service operates 5 round trips per day,including stops in Provincetown, North Truro, Truro, Wellfleet, South Wellfleet, NorthEastham, and Eastham. A paratransit service called the b-bus/Dial-A-Ride<strong>Transportation</strong> (DART) is available in these towns and is provided by the <strong>Cape</strong> <strong>Cod</strong><strong>Regional</strong> Transit Authority (<strong>Cape</strong> <strong>Cod</strong> RTA) on an “on call” basis. Introduced in 2006,the Flex service provided fixed-schedule service with deviations up to 3/4 mile from itsmain route. Flex service included major corridors and destinations in the towns ofHarwich, Brewster, Orleans, Eastham, Wellfleet, and Truro, as well as in coordinationwith the Truro-Provincetown shuttle service.Bike FacilitiesThe <strong>Cape</strong> <strong>Cod</strong> Rail Trail connects the area from other parts of the <strong>Cape</strong>. The originalroute used Rock Harbor Road; the bicycle bridge in Orleans allows the trail to followformer railroad right-of-way all the way through Eastham to LeCount Hollow Road inWellfleet. The State Bicycle Route 1 or Claire Saltonstall Bikeway (which uses the trail)continues along side roads and bike path segments until North Truro and Provincetownwhere it follows Route 6A.Air ServiceThis region contains Provincetown Airport. Typical air service from and to Boston runsbetween 5 and 8 trips in each direction per day in the summer and 6 trips per day in thewinter.Ferry ServicePassenger ferry service operates from Provincetown to Boston and Plymouth during thesummer. For 2010, there are 3 round trips per day scheduled between Provincetown andBoston with an additional excursion trip on summer Saturdays. One roundtrip isscheduled to and from Plymouth. These services operate in the tourist season. The <strong>Cape</strong><strong>Cod</strong> Commission Strategic <strong>Plan</strong> for Expanded Water <strong>Transportation</strong> to Provincetownhad several recommendations for expanding the service to the "shoulder seasons" due toincreasing demand for service.<strong>Cape</strong> <strong>Cod</strong> <strong>Regional</strong> <strong>Transportation</strong> <strong>Plan</strong> | August 2011Chapter 2.8: SubregionsPage 265
2.8.4.2 <strong>Transportation</strong> Issues and ProblemsSome Outer <strong>Cape</strong> roadways are operating near design capacities, due to the rise intourism and year-round populations in the region and an increased reliance on singleoccupantvehicles. However, geographic, cost, character issues, and policy restraintslargely preclude building additional highway systems or adding capacity to the existingroadways. In other parts of the country where roadway widening has been possible,mobility was generally not enhanced for the long term. Public consensus indicates astrong desire to find alternatives to widening roadways.Some alternatives have been identified. Creation of a convenient trolley shuttle systemand facilities to encourage use of bicycles for commuting will help by providingalternatives to driving alone.2.8.5 CONCLUSION<strong>Transportation</strong> to, from, and within <strong>Cape</strong> <strong>Cod</strong> is in many ways unique. Each its ownmicrocosm – the <strong>Cape</strong>’s sub-regions are faced with their own limitations andopportunities. The roughly linear geography of the <strong>Cape</strong> means that transportationdecisions in one sub-region will affect its neighbors to varying degrees. Therefore,decisions made for a particular sub-region are usually not amenable to a “one-size fitsalls” approach.The Upper <strong>Cape</strong> transportation system serves as a gateway to all fifteen BarnstableCounty towns, and decisions should respect the needs of local travelers in addition tointer-regional travel. The Mid-<strong>Cape</strong> area includes many of the regional services (e.g.,Airport, Hospital, etc.) and is a major employment center. The Lower <strong>Cape</strong> communitiesmark a transition to more seasonal activity. Home to most of the <strong>Cape</strong> <strong>Cod</strong> NationalSeashore’s attractions, the Outer <strong>Cape</strong>’s relative remoteness from urban centerscorresponds to the largest annual cycle of low-to-high levels of traffic.Chapter 2.8: Subregions <strong>Cape</strong> <strong>Cod</strong> <strong>Regional</strong> <strong>Transportation</strong> <strong>Plan</strong> | August 2011Page 266
<strong>2012</strong> REGIONAL TRANSPORTATION PLANChapter 3: SafetyEndorsedAugust 22, 2011
Chapter 3: Table of Contents3 - Safety .......................................................................................................... 2713.1 - Safety Problem Areas ............................................................................. 2713.1.1 - Intersections of Critical Safety Concern ..................................... 2723.2 - <strong>Cape</strong> <strong>Cod</strong> Drivers .................................................................................. 2793.2.1 The Senior Driver .......................................................................... 2803.2.2 Older Driver recommendations ..................................................... 2813.2.3 Young Drivers ................................................................................ 2823.2.4 Younger Driver Recommendations ............................................... 2833.2.5 Additional Recommendations ....................................................... 2833.3 - The <strong>Cape</strong> <strong>Cod</strong> Roadway ........................................................................ 2833.3.1 Safety Improvements through Intersection Modification ............ 2863.3.1.1 Modern Roundabouts v. Four-Way Intersections .................... 2863.3.2 Safety-Related Technology ............................................................ 2883.3.2.1 Red Light Enforcement .............................................................. 2883.3.2.2 Opticom System ......................................................................... 2893.3.3 Coordination with Massachusetts’ Strategic Highway Safety <strong>Plan</strong>2893.3.4 Policies & Strategies ...................................................................... 2933.3.5 Community Character/Safety Issues ............................................ 2943.4 - Roadway Safety Audits ...................................................................... 2943.4.1 - Barnstable Road Safety Audits .................................................... 2953.4.1.1 Route 28 in Barnstable – Lane Departure Safety Audit ........... 2953.4.1.2 Route 28 (Falmouth Road)/Bearses Way ................................. 2983.4.1.3 Meetinghouse Way (Route 149)/Route 6 Ramps ..................... 3003.4.2 - Dennis Roadway Safety Audit ..................................................... 3023.4.2.1 - Route 134 at the Route 6 Ramps ............................................. 3023.4.3 - Mashpee Roadway Safety Audits ................................................ 3033.4.3.1 - Route 130 Lane Departure Road Safety Audit ........................ 3033.4.3.2 - Great Neck Road North/Old Barnstable Road ....................... 3063.4.4 - Sandwich Road Safety Audits ..................................................... 3073.4.4.1 - Cotuit Road/Harlow Road/South Sandwich Road ................. 3073.4.4.2 - Route 6: Major Highway Median Cross-Over Crashes ........... 3083.4.5 - Yarmouth Road Safety Audit ...................................................... 3093.4.5.1 - Old Townhouse Road/Forest Road ......................................... 3093.5 - Multimodal <strong>Transportation</strong> Safety ........................................................ 3113.5.1 Public Transit Safety ....................................................................... 3113.5.2 Bicyclist Safety ................................................................................ 3123.5.3 Pedestrian Safety ............................................................................ 3143.5.4 Air Travel Safety ............................................................................. 3153.5.5 Summary of General <strong>Transportation</strong> Safety Recommendations .. 3153.6 - Intelligent <strong>Transportation</strong> Systems ................................................... 316<strong>Cape</strong> <strong>Cod</strong> <strong>Regional</strong> <strong>Transportation</strong> <strong>Plan</strong> | August 2011Chapter 3: Safety
3.7 - <strong>Cape</strong> <strong>Cod</strong> Commission’s Location-Specific Safety Studies ................... 3183.7.1 - Bourne: Otis Rotary ..................................................................... 3183.7.2 - Eastham: Eastham/Orleans Rotary ............................................. 3183.7.3 - Eastham: Route 6/Brackett Road ............................................... 3203.7.4 - Harwich: Route 137/Route 39 ..................................................... 3213.7.5 - Orleans: Route 6A/Route 28 ....................................................... 3213.7.6 - Provincetown: Route 6/Shank Painter Road .............................. 3213.7.7 - Sandwich: Route 6/Route 130 Ramps ........................................ 3223.7.8 - Truro: Route 6 School Zone ........................................................ 3223.8 - Conclusion ......................................................................................... 323Chapter 3: List of FiguresFigure 1 - <strong>Cape</strong> <strong>Cod</strong> Located Crashes 2006-2008 .............................................. 273Figure 2 - <strong>Cape</strong> Population Over 65 .................................................................... 280Figure 3 - Comparison of Predicted Roundabout Injury Crashes with Rural 2-Way Stop -Controlled Intersections. ............................................................ 287Figure 4 - Comparison of Predicted Injury Crashes for Single-Lane and Double-Lane Roundabouts with Rural or Urban Signalized Intersections. ............ 288Figure 5 - Infrastructure Safety Project Selection Process ................................. 292Chapter 3: List of TablesTable 1 - RTP Local Safety Problem Areas (from public comment form) .......... 272Table 2 - Top Locations Based on Number of Crashes ........................................ 275Table 3 - Top Locations Based on Equivalent Property Damage Only ................ 275Table 4 - Top Locations based on Crash Rate ..................................................... 276Table 5 - Top Locations based on EPDO Rate ..................................................... 277Table 6 - Index of Notes ....................................................................................... 278Table 7 - Crash Rates (based on years 2006-2008): Route 6 ............................. 284Table 8 - Crash Rates (based on years 2006-2008): Route 28 .......................... 285Table 9 - Crash Rates (based on years 2006-2008): Route 6A .......................... 286Table 10 - Injuries from collisions/slips and falls in transit vehicles and on transitproperty ......................................................................................................... 312Table 11 - Bicyclist-Vehicle Crash History (2006-2008) ..................................... 313Table 12 – Pedestrian-Vehicle Crash History (2006-2008) ................................ 314Table 13 - Air Travel Safety Incidents .................................................................. 315Chapter 3: Safety <strong>Cape</strong> <strong>Cod</strong> <strong>Regional</strong> <strong>Transportation</strong> <strong>Plan</strong> | August 2011
3. SafetyThe concern over safety is made clear in the first goal of the <strong>Regional</strong> <strong>Transportation</strong><strong>Plan</strong>:“Create a transportation system that provides safe travel options for people andfreight, and protects users from natural and external threats.”<strong>Transportation</strong> users have a right to a transportation system where their person andpossessions will arrive at their destinations unharmed and undamaged. Moreover,protecting the value of freight traveling over the transportation network is essential tothe economy of <strong>Cape</strong> <strong>Cod</strong>. Therefore, it is important that transportation infrastructurebe designed to minimize the possibility of hazardous situations or accidents. Existingtraffic laws must also be enforced to prevent the improper use of the transportationsystem. For all of these reasons, the <strong>Regional</strong> <strong>Transportation</strong> <strong>Plan</strong> sets the goal ofproviding safety for people and goods.This chapter includes sections describing the seasonal and year-round issues affectingtraffic safety including a description of the <strong>Cape</strong> demographics and some informationabout how they will change over time. Summaries of important safety studies arepresented as well.3.1 SAFETY PROBLEM AREASDuring the public process for this plan a comment form was distributed. Included in thequestionnaire was a question asking each respondent to look at the <strong>Cape</strong> as a whole andidentify the worst regional safety locations. Collectively, the greatest number ofresponses listed specific or generic locations along Route 6. This was followed up byresponses listing Route 28.One of the questions asked was tied to the town that each respondent either resided in orspent the most time in while visiting <strong>Cape</strong> <strong>Cod</strong>. The question asked “…list the top threeareas that have the worst LOCAL SAFETY problems.” The responses were reviewed andthe following table presents a list of the top two locations in each town indicated as safetyproblems:<strong>Cape</strong> <strong>Cod</strong> <strong>Regional</strong> <strong>Transportation</strong> <strong>Plan</strong> | August 2011Chapter 3: SafetyPage 271
TABLE 1 - RTP LOCAL SAFETY PROBLEM AREAS (FROM PUBLIC COMMENT FORM)Town Location #1 Location #2Barnstable Rt 28 Main StBourne MacArthur Blvd Bike/Pedestrian SafetyEastham Rt 6 (left turns) Samoset Rd/<strong>Cape</strong> <strong>Cod</strong> Rail TrFalmouth Rt 28 Teaticket Hwy Woods Hole Rd/Locust StHarwich Rt 39/Pleasant Bay Rd Rt 28/Sisson RdMashpee Mashpee Rotary Rt 28/QuinnaquissettOrleans Rt 6A/Rt 28 Main St/Old Colony WayTruro Rt 6 (left turns) Rt 6 (passing on right)YarmouthStation Ave (between OldTownhouse Rd & Rt 6) Rt 28(Responses as of 8/23/2010)3.1.1 INTERSECTIONS OF CRITICAL SAFETY CONCERNIn 2010, the <strong>Cape</strong> <strong>Cod</strong> Commission began an effort to rank the top intersections ofcritical safety concern across <strong>Cape</strong> <strong>Cod</strong>. Before the data could be gathered and sortedinto any particular order or rank, it was necessary to specify the characteristics thatsignify an intersection as a safety concern. The Commission decided that there areseveral ways to interpret crash data – meaning, several possible ways to determine whichintersections are of highest safety concern.The <strong>Cape</strong> <strong>Cod</strong> Commission identified four methods of sorting data to create a top list ofintersections of critical safety concern:Based on Number of Crashes: Perhaps most simple method is to lookat the total number of crashes for each intersection and then rank themfrom most number of crashes to least. This method is very basic, in that itdoes not consider the severity of the crashes or the number of vehiclesusing the roadway.Based on Equivalent Property Damage Only (EPDO): Thismethod considers the severity of each intersection’s crashes. Anintersection’s EPDO value is determined using a formula that weightseach crash based on whether it included a fatality, an injury but nofatality, or property damage only. Fatal crashes are assigned a value often; injuries are assigned a value of five; and property damage onlycrashes are assigned a value of one. To determine an intersection’s EPDO,the weighted values are summed to an aggregate value. Under thismethod, the intersection with the highest EPDO value is ranked mostdangerous.Chapter 3: Safety <strong>Cape</strong> <strong>Cod</strong> <strong>Regional</strong> <strong>Transportation</strong> <strong>Plan</strong> | August 2011Page 272
Based on Crash Rate: A crash rate for an intersection compares thenumber of crashes to the number of vehicles passing through it. The crashrate is interpreted as number of crashes per million entering vehicles. It ispossible an intersection with many crashes is not geometrically flawed orin poor condition, but merely a victim of the law of averages – manyentering vehicles inflating the number of crashes. The crash rate methodattempts to distinguish intersections with safety problems relative to theirusage.Based on EPDO Rate: This method is based on the same idea as usingthe crash rate, whereas it compares an intersection’s EPDO to its usage.The EPDO rate is interpreted as EPDO per million entering vehicles. Thevehicle with the largest EPDO rate is ranked number one under thismethod.Base data for this analysis was provided by the Massachusetts Department of<strong>Transportation</strong> (MassDOT) in the form of geographically located crash clusters. The dataprovided by MassDOT included the number of reported crashes at each intersection andthe severity of the crashes. It should be noted, however, that this dataset only includesincidents whose reports contained enough information to accurately locate them. Of the12,001 crash reports collected by the Massachusetts Registry of Motor Vehicles, 9,220incidents were located by MassDOT. The incidents are mapped on the following figure.FIGURE 1 - CAPE COD LOCATED CRASHES 2006-2008(Source: MassDOT Crash Records 2006-2008)<strong>Cape</strong> <strong>Cod</strong> <strong>Regional</strong> <strong>Transportation</strong> <strong>Plan</strong> | August 2011Chapter 3: SafetyPage 273
In an effort to create a more robust dataset, the Commission solicited the policedepartment of each Barnstable County town for crash statistics on their most dangerousintersections. There is a wide range between towns in terms of their ability to producethis data. In total, the Commission received top crash lists and the supporting data fromten of fifteen towns. No department was able to provide the severities of crashes fortheir high crash lists. The information from local data is limited to the number of crashesper intersection. Without severity information, the local data could only bolster the datathat were being used in creating the lists that use crash numbers and not EPDO. Thereare significant differences in the number of crashes at intersections as reported byMassDOT versus the local police departments.In each of the following top crash location lists, select intersections are succeeded by asubscript. The subscript is a reference to a note in the Index of Notes table, which followsthe fourth top crash list. The notes refer to any structural changes that have occurred orwill occur at the intersections, and also highlight any studies that may have included theintersections.Chapter 3: Safety <strong>Cape</strong> <strong>Cod</strong> <strong>Regional</strong> <strong>Transportation</strong> <strong>Plan</strong> | August 2011Page 274
TABLE 2 - TOP LOCATIONS BASED ON NUMBER OF CRASHESRank Intersection Town Crash #1 Route 6 (Mid-<strong>Cape</strong> Highway) @ Route 132 (Iyannough Road) - Exit 6 1 Barnstable 1282 Route 6 (Mid-<strong>Cape</strong> Highway) @ Route 134 (East West Dennis Road) - Exit 9 2 Dennis 993 Otis Air Force Base Rotary @ Rt 28 / Sandwich Rd / Connery Ave 3 Bourne 884 Route 6 (Mid-<strong>Cape</strong> Highway) @ Willow Street - Exit 7 4 Yarmouth 865 Route 6 (Mid-<strong>Cape</strong> Highway) @ Route 149 (Prospect Street) - Exit 5 5 Barnstable 836 Route 6 (Mid-<strong>Cape</strong> Highway) @ Station Avenue - Exit 8 Yarmouth 787 Route 6 (Mid-<strong>Cape</strong> Highway) @ Route 130 (Forestdale Road) - Exit 2 6 Sandwich 738 Bourne Rotary @ Rt 28 / Sandwich Rd / Trowbridge Rd Bourne 719 Route 25 @ Bourne Bridge Bourne 6810 Route 28 (Falmouth Road) @ Bearses Way 7 Barnstable 6011 Route 28 (Falmouth Road) @ Route 149 (Prospect Street) 8 Barnstable 5612 Route 6 (Mid-<strong>Cape</strong> Highway) @ Chase Rd - Exit 4 9 Sandwich 5513 Belmont Rotary @ Rt 28 / Rt 6 / Rt 6 Bypass / Head of the Bay Rd Bourne 5414 Route 28 (Falmouth Road) @ South County Road 10 Barnstable 5215 Route 28 (Iyannough Road) @ Yarmouth Road 11 Barnstable 4816 Route 134 (East West Dennis Road) @ Upper County Road 12 Dennis 4416 Route 6 (Mid-<strong>Cape</strong> Highway) @ Route 124 (Pleasant Lake Avenue) - Exit 10 Harwich 4416 Route 6 (Mid-<strong>Cape</strong> Highway) @ Quaker Meeting House Rd - Exit 3 13 Sandwich 4419 Route 28 (Falmouth Road) @ Osterville West Barnstable Road Barnstable 4319 Route 132 (Iyannough Road) @ Shoot Flying Hill Road 14 Barnstable 4321 Airport Rotary @ Rt 132 / Rt 28 EB/WB / Barnstable Rd 15 Barnstable 4222 Route 132 (Iyanough Road) @ Phinneys Lane 16 Barnstable 4023 Route 132 (Iyannough Road) @ Independence Road / Enterprise Road 17 Barnstable 3624 Eastham Rotary @ Rt 6A/28 / Rt 6, Smith Ln 18 Eastham 3524 Route 28 @ Route 151 (Nathan Ellis Highway) Falmouth 3524 Route 28 (Falmouth Road) @ Old Stage Road 19 Barnstable 3527 Route 28 (Chatham Road) @ Route 6A (Cranberry Highway) 20 Orleans 3328 Mashpee Circle @ Rt 28 / Rt 151 / Great Neck Rd Mashpee 3229 Route 28 (Falmouth Road) @ Pitchers Way Barnstable 3129 Route 28 (Falmouth Road) @ Lincoln Road Barnstable 3131 Sandwich Road @ Adams Street Bourne 3032 Route 134 (East West Dennis Road) @ Market Place Dennis 2733 Theophilus F. Smith Road @ Cumberland Farm / Patriot Square SD Dennis 2533 Route 6A (Sandwich Road) @ Sagamore Bridge Connector Bourne 2533 Route 28 (Main St / Iyannough Rd) @ East Main Street 21 Yarmouth 2536 Route 28 (Falmouth Road) @ Phinneys Lane 22 Barnstable 2436 Route 151 (Nathan Ellis Highway) @ Sandwich Road Falmouth 2436 Route 28 (Main Street) @ Depot Street Dennis 2436 Route 28 (Main Street) @ Route 134 / Swan River Road 23 Dennis 2440 Route 6 WB Off ramp @ Route 6 (Scenic Highway) Bourne 2240 Route 6 (GAR Hwy) @ Brackett Road / Old County Road 24 Eastham 2240 Route 6 (Mid-<strong>Cape</strong> Highway) @ Route 6A (Cranberry Highway) - Exit 12 Orleans 2240 Route 6 (Mid-<strong>Cape</strong> Highway) @ Route 137 (Long Pond Road) - Exit 11 25 Harwich 2240 Station Avenue @ Whites Path 26 Yarmouth 2245 Buck Island Road @ West Yarmouth Road Yarmouth 2045 Sandwich Road @ Brick Kiln Road Falmouth 2045 Station Avenue @ Old Town House Road Yarmouth 2045 Route 130 (Forestdale Road) @ Cotuit Road Sandwich 2049 Main Street @ Tonset Road Orleans 1949 Spring Bars Road @ Worcester Court Falmouth 1949 Route 28 (Teaticket Highway) @ Stop and Shop SD Falmouth 1949 Route 134 (East West Dennis Road) @ Bob Crowell Rd / Hemlock Ln / Agway SD Dennis 19Source: MassDOT 2006-2008 Crash Data and Towns of Barnstable County<strong>Cape</strong> <strong>Cod</strong> <strong>Regional</strong> <strong>Transportation</strong> <strong>Plan</strong> | August 2011Chapter 3: SafetyPage 275
TABLE 3 - TOP LOCATIONS BASED ON EQUIVALENT PROPERTY DAMAGE ONLYRank Intersection Town Crash # EPDO1 Route 6 (Mid-<strong>Cape</strong> Highway) @ Route 132 (Iyannough Road) - Exit 6 1 Barnstable 128 3142 Route 6 (Mid-<strong>Cape</strong> Highway) @ Willow Street - Exit 7 4 Yarmouth 86 2043 Route 6 (Mid-<strong>Cape</strong> Highway) @ Route 134 (East West Dennis Road) - Exit 9 2 Dennis 99 1873 Route 6 (Mid-<strong>Cape</strong> Highway) @ Route 149 (Prospect Street) - Exit 5 5 Barnstable 83 1875 Route 6 (Mid-<strong>Cape</strong> Highway) @ Station Avenue - Exit 8 Yarmouth 78 1826 Otis Air Force Base Rotary @ Rt 28 / Sandwich Rd / Connery Ave 3 Bourne 88 1727 Route 25 @ Bourne Bridge Bourne 68 1488 Route 6 (Mid-<strong>Cape</strong> Highway) @ Route 130 (Forestdale Road) - Exit 2 6 Sandwich 73 1459 Route 6 (Mid-<strong>Cape</strong> Highway) @ Chase Rd - Exit 4 9 Sandwich 55 12810 Bourne Rotary @ Rt 28 / Sandwich Rd / Trowbridge Rd Bourne 71 11511 Belmont Rotary @ Rt 28 / Rt 6 / Rt 6 Bypass / Head of the Bay Rd Bourne 54 11012 Route 6 (Mid-<strong>Cape</strong> Highway) @ Quaker Meeting House Rd - Exit 3 13 Sandwich 44 10413 Route 134 (East West Dennis Road) @ Upper County Road 12 Dennis 44 10014 Route 6 (Mid-<strong>Cape</strong> Highway) @ Route 124 (Pleasant Lake Avenue) - Exit 10 Harwich 44 9615 Mashpee Circle @ Rt 28 / Rt 151 / Great Neck Rd Mashpee 32 8016 Eastham Rotary @ Rt 6A/28 / Rt 6, Smith Ln 18 Eastham 35 7517 Route 151 (Nathan Ellis Highway) @ Sandwich Road Falmouth 24 7318 Route 28 @ Route 151 (Nathan Ellis Highway) Falmouth 35 7119 Route 6 (Mid-<strong>Cape</strong> Highway) @ Route 6A (Cranberry Highway) - Exit 12 Orleans 22 7019 Airport Rotary @ Rt 132 / Rt 28 EB/WB / Barnstable Rd 15 Barnstable 42 7021 Route 6 (GAR Hwy) @ Brackett Road / Old County Road 24 Eastham 22 6222 Route 6A (Sandwich Road) @ Sagamore Bridge Connector Bourne 25 5823 Theophilus F. Smith Road @ Cumberland Farm / Patriot Square SD Dennis 25 5724 Route 6 (Mid-<strong>Cape</strong> Highway) @ Route 137 (Long Pond Road) - Exit 11 25 Harwich 22 5425 Buck Island Road @ West Yarmouth Road Yarmouth 20 5225 Route 28 (Main Street) @ Depot Street Dennis 24 5225 Route 28 (Falmouth Road) @ Bearses Way 7 Barnstable 24 5228 Sandwich Road @ Adams Street Bourne 30 5028 Route 28 (Teaticket Highway) @ Figuerido Way Falmouth 18 5030 Buck Island Road @ Higgins Crowell Road Yarmouth 17 4931 Great Neck Road North @ Old Barnstable Road 27 Mashpee 12 4832 Route 28 (Teaticket Highway) @ Stop and Shop SD Falmouth 19 4733 Route 28 (Falmouth Road) @ Route 149 (Prospect Street) 8 Barnstable 22 4634 Route 28 (Main St / Iyannough Rd) @ East Main Street 21 Yarmouth 25 4535 Station Avenue @ Old Town House Road 31 Yarmouth 20 4435 Route 151 (Nathan Ellis Highway) @ Old Barnstable Road Mashpee 12 4435 Route 6A (Cranberry Highway) @ Eldredge Park Way Orleans 16 4438 Main Street @ Tonset Road Orleans 19 4339 Station Avenue @ Wood Road Yarmouth 18 4239 Route 28 (Falmouth Road) @ Osterville West Barnstable Road Barnstable 14 4241 Route 132 (Iyannough Road) @ Independence Road / Enterprise Road 17 Barnstable 12 4142 Rt 39 (Orleans Harwich Road) @ Pleasant Bay Road Harwich 15 4042 Forest Road @ Winslow Gray Road Yarmouth 15 4044 Route 6 WB Off ramp @ Route 6 (Scenic Highway) Bourne 22 3844 Sandwich Road @ Brick Kiln Road Falmouth 10 3844 Route 134 (East West Dennis Road) @ Airline Road Dennis 14 3844 Route 28 (Falmouth Road) @ Pitchers Way Barnstable 10 3848 Route 6A (Cranberry Highway) @ Union Street / Old Church Street Yarmouth 13 3748 Route 28 (Falmouth Road) @ South County Road 10 Barnstable 13 3748 Route 132 (Iyanough Road) @ Phinneys Lane 16 Barnstable 17 37Source: MassDOT 2006-2008 Crash DataChapter 3: Safety <strong>Cape</strong> <strong>Cod</strong> <strong>Regional</strong> <strong>Transportation</strong> <strong>Plan</strong> | August 2011Page 276
TABLE 4 - TOP LOCATIONS BASED ON CRASH RATERank Intersection Town Crash # Crash Rate1 Otis Air Force Base Rotary @ Rt 28 / Sandwich Rd / Connery Ave 3 Bourne 88 2.732 Rt 39 (Orleans Harwich Road) @ Pleasant Bay Road Harwich 17 2.323 Route 6 (Mid-<strong>Cape</strong> Highway) @ Route 134 (East West Dennis Road) - Exit 9 2 Dennis 99 2.164 Route 28 (Falmouth Road) @ Route 149 (Prospect Street) 8 Barnstable 56 2.145 Route 124 (Harwich Road) @ Tubman Road Brewster 12 2.076 Theophilus F. Smith Road @ Cumberland Farm / Patriot Square SD Dennis 25 2.047 Route 28 (Falmouth Road) @ South County Road 10 Barnstable 52 2.038 Station Avenue @ Wood Road Yarmouth 18 1.959 Route 6 (Mid-<strong>Cape</strong> Highway) @ Route 132 (Iyannough Road) - Exit 6 1 Barnstable 128 1.7810 Route 28 (Falmouth Road) @ Bearses Way 7 Barnstable 60 1.7711 Spring Bars Road @ Worcester Court Falmouth 19 1.7311 Cotuit Road @ Harlow Road 28 Sandwich 17 1.7313 Route 6A (Sandwich Road) @ Sagamore Bridge Connector Bourne 25 1.7114 Sandwich Road @ Adams Street Bourne 30 1.6415 Route 6 WB Off ramp @ Route 6 (Scenic Highway) Bourne 22 1.6116 Route 28 (Falmouth Road) @ Osterville West Barnstable Road Barnstable 43 1.5316 Route 28 (Chatham Road) @ Route 6A (Cranberry Highway) 20 Orleans 33 1.5318 Route 132 (Iyannough Road) @ Shoot Flying Hill Road 14 Barnstable 43 1.5219 Route 6 (Mid-<strong>Cape</strong> Highway) @ Station Avenue - Exit 8 Yarmouth 78 1.4919 Route 134 (East West Dennis Road) @ Upper County Road 12 Dennis 44 1.4921 Main Street @ Tonset Road Orleans 19 1.4322 Route 6 (Mid-<strong>Cape</strong> Highway) @ Willow Street - Exit 7 4 Yarmouth 86 1.4223 Route 25 @ Bourne Bridge Bourne 68 1.3924 Route 6 (Mid-<strong>Cape</strong> Highway) @ Route 149 (Prospect Street) - Exit 5 5 Barnstable 83 1.3824 Route 28 (Iyannough Road) @ Yarmouth Road Barnstable 48 1.3824 Belmont Rotary @ Rt 28 / Rt 6 / Rt 6 Bypass / Head of the Bay Rd Bourne 54 1.3827 Route 28 (Main Street) @ Depot Street Dennis 24 1.3328 Buck Island Road @ West Yarmouth Road Yarmouth 20 1.3028 Sandwich Road @ Brick Kiln Road Falmouth 20 1.3030 Route 28 (Falmouth Road) @ Pitchers Way Barnstable 31 1.2931 Route 6 (Mid-<strong>Cape</strong> Highway) @ Route 124 (Pleasant Lake Avenue) - Exit 10 Harwich 44 1.2332 Route 6 (Mid-<strong>Cape</strong> Highway) @ Route 130 (Forestdale Road) - Exit 2 6 Sandwich 73 1.2132 Bourne Rotary @ Rt 28 / Sandwich Rd / Trowbridge Rd Bourne 71 1.2134 Route 28A (Sandwich Road) @ County Road Bourne 10 1.1935 Depot Street @ Center Street Harwich 9 1.1736 Old Town House Road @ Forest Road 29 Yarmouth 15 1.1237 Depot Street @ Center Street Dennis 9 1.1038 Great Neck Road North @ Old Barnstable Road 27 Mashpee 12 1.0838 Route 132 (Iyanough Road) @ Phinneys Lane 16 Barnstable 40 1.0840 Route 130 (Forestdale Road) @ Cotuit Road Sandwich 20 1.0741 Route 134 (East West Dennis Road) @ Bob Crowell Rd / Hemlock Ln / Agway SD Dennis 19 1.0642 Adams Street @ Sagamore Bridge Connector Bourne 15 1.0543 Route 151 (Nathan Ellis Highway) @ Sandwich Road Falmouth 24 1.0444 Route 28 (Main Street) @ Route 134 / Swan River Road Dennis 24 1.0244 Eastham Rotary @ Rt 6A/28 / Rt 6, Smith Ln 18 Eastham 35 1.0246 Route 6 (Mid-<strong>Cape</strong> Highway) @ Chase Rd - Exit 4 9 Sandwich 55 1.0047 Route 134 (East West Dennis Road) @ Market Place Dennis 27 0.9948 Buck Island Road @ Higgins Crowell Road Yarmouth 17 0.9848 Route 28 (Falmouth Road) @ Old Stage Road 19 Barnstable 35 0.9850 Route 28 (Main St / Iyannough Rd) @ East Main Street 21 Yarmouth 25 0.97Source: MassDOT 2006-2008 Crash Data and Towns of Barnstable County<strong>Cape</strong> <strong>Cod</strong> <strong>Regional</strong> <strong>Transportation</strong> <strong>Plan</strong> | August 2011Chapter 3: SafetyPage 277
TABLE 5 - TOP LOCATIONS BASED ON EPDO RATERank Intersection TOWN Crash# EPDO EPDO Rate1 Route 124 (Harwich Road) @ Tubman Road Brewster 12 32 5.512 Rt 39 (Orleans Harwich Road) @ Pleasant Bay Road Harwich 15 40 5.453 Otis Air Force Base Rotary @ Rt 28 / Sandwich Rd / Connery Ave 3 Bourne 88 172 5.334 Theophilus F. Smith Road @ Cumberland Farm / Patriot Square SD Dennis 25 57 4.655 Station Avenue @ Wood Road Yarmouth 18 42 4.546 Route 6 (Mid-<strong>Cape</strong> Highway) @ Route 132 (Iyannough Road) - Exit 6 1 Barnstable 128 314 4.367 Great Neck Road North @ Old Barnstable Road 27 Mashpee 12 48 4.328 Route 6 (Mid-<strong>Cape</strong> Highway) @ Route 134 (East West Dennis Road) - Exit 9 2 Dennis 99 187 4.089 Route 6A (Sandwich Road) @ Sagamore Bridge Connector Bourne 25 58 3.9710 Sandwich Road @ Carriage Shop Road Falmouth 7 31 3.9611 Route 6 (Mid-<strong>Cape</strong> Highway) @ Station Avenue - Exit 8 Yarmouth 78 182 3.4812 Old Bass River Road @ Old Chatham Road Dennis 6 26 3.4413 Depot Street @ Center Street Harwich 9 26 3.3914 Route 134 (East West Dennis Road) @ Upper County Road 12 Dennis 44 100 3.3814 Buck Island Road @ West Yarmouth Road Yarmouth 20 52 3.3816 Route 6 (Mid-<strong>Cape</strong> Highway) @ Willow Street - Exit 7 4 Yarmouth 86 204 3.3617 Cotuit Road @ Harlow Road 28 Sandwich 17 33 3.3518 Main Street @ Tonset Road Orleans 19 43 3.2319 Route 151 (Nathan Ellis Highway) @ Sandwich Road Falmouth 24 73 3.1719 Depot Street @ Center Street Dennis 9 26 3.1721 Route 6 (Mid-<strong>Cape</strong> Highway) @ Route 149 (Prospect Street) - Exit 5 5 Barnstable 83 187 3.1222 Route 28A (Sandwich Road) @ County Road Bourne 10 26 3.1023 Route 25 @ Bourne Bridge Bourne 68 148 3.0224 Route 28 (Main Street) @ Depot Street Dennis 24 52 2.8825 Buck Island Road @ Higgins Crowell Road Yarmouth 17 49 2.8326 Belmont Rotary @ Rt 28 / Rt 6 / Rt 6 Bypass / Head of the Bay Rd Bourne 54 110 2.8127 Route 6 WB Off ramp @ Route 6 (Scenic Highway) Bourne 22 38 2.7828 Sandwich Road @ Adams Street Bourne 30 50 2.7329 Route 6 (Mid-<strong>Cape</strong> Highway) @ Route 124 (Pleasant Lake Avenue) - Exit 10 Harwich 44 96 2.6830 Route 28 (Teaticket Highway) @ Figuerido Way Falmouth 18 50 2.6631 Forest Road @ Winslow Gray Road Yarmouth 15 40 2.5532 Route 28 (Chatham Road) @ Finlay Road 30 Orleans 8 32 2.5533 Spring Bars Road @ Worcester Court Falmouth 12 28 2.5434 Sandwich Road @ Brick Kiln Road Falmouth 10 38 2.4635 Adams Street @ Sagamore Bridge Connector Bourne 15 35 2.4636 Route 6 (Mid-<strong>Cape</strong> Highway) @ Route 130 (Forestdale Road) - Exit 2 6 Sandwich 73 145 2.4137 Route 6 (Mid-<strong>Cape</strong> Highway) @ Chase Rd - Exit 4 9 Sandwich 55 128 2.3438 Route 6 (Mid-<strong>Cape</strong> Highway) @ EB approaching Exit 11 Harwich 10 30 2.3138 Old Town House Road @ Forest Road 29 Yarmouth 15 31 2.3140 Route 6 (GAR Hwy) @ Brackett Road / Old County Road 24 Eastham 22 62 2.2941 Route 6A (Cranberry Highway) @ Main Street Sandwich 11 27 2.2642 Route 28 (Teaticket Highway) @ Stop and Shop SD Falmouth 19 47 2.2543 Mashpee Circle @ Rt 28 / Rt 151 / Great Neck Rd Mashpee 32 80 2.2343 Station Avenue @ <strong>Regional</strong> Avenue / Studley Road Yarmouth 9 33 2.2343 Route 134 (East West Dennis Road) @ Airline Road Dennis 14 38 2.2343 Sandwich Road @ Tanglewood Drive Falmouth 7 27 2.2347 Eastham Rotary @ Rt 6A/28 / Rt 6, Smith Ln 18 Eastham 35 75 2.1948 Station Avenue @ Old Town House Road 31 Yarmouth 20 44 2.0849 Route 6A (Cranberry Highway) @ Union Street / Old Church Street Yarmouth 13 37 2.0750 Route 130 (Forestdale Road) @ Quaker Meeting House Road Sandwich 15 35 2.04Source: MassDOT 2006-2008 Crash DataChapter 3: Safety <strong>Cape</strong> <strong>Cod</strong> <strong>Regional</strong> <strong>Transportation</strong> <strong>Plan</strong> | August 2011Page 278
TABLE 6 - INDEX OF NOTESNote Intersection Town Notes1 Route 6 (Mid-<strong>Cape</strong> Highway) @ Route 132 (Iyannough Road) - Exit 6 Barnstable Signalization; TIP year 2005, 2006, 20072 Route 6 (Mid-<strong>Cape</strong> Highway) @ Route 134 (East West Dennis Road) - Exit 9 Dennis RSA 20093 Otis Air Force Base Rotary @ Rt 28 / Sandwich Rd / Connery Ave Bourne CCC Safety Study 20064 Route 6 (Mid-<strong>Cape</strong> Highway) @ Willow Street - Exit 7 Yarmouth Additional lanes; TIP year 20045 Route 6 (Mid-<strong>Cape</strong> Highway) @ Route 149 (Prospect Street) - Exit 5 Barnstable RSA conducted 2010; under design, TIP year 20106 Route 6 (Mid-<strong>Cape</strong> Highway) @ Route 130 (Forestdale Road) - Exit 2 Sandwich CCC Safety Study 2008; RSA 2009; under design; TIP year 20107 Route 28 (Falmouth Road) @ Bearses Way Barnstable RSA conducted 2009; under review by town8 Route 28 (Falmouth Road) @ Route 149 (Prospect Street) Barnstable Signal design; construction 2010; TIP year 20099 Route 6 (Mid-<strong>Cape</strong> Highway) @ Chase Rd - Exit 4 Sandwich RSA 200910 Route 28 (Falmouth Road) @ South County Road Barnstable Signal design; construction 2010; TIP year 2009New design concepts recommended in Hyannis Access Study; part of11 Route 28 (Iyannough Road) @ Yarmouth Road Barnstable Yarmouth Road Corridor Study12 Route 134 (East West Dennis Road) @ Upper County Road Dennis RSA 2010; TIP year <strong>2012</strong>13 Route 6 (Mid-<strong>Cape</strong> Highway) @ Quaker Meeting House Rd - Exit 3 Sandwich RSA 200914 Route 132 (Iyannough Road) @ Shoot Flying Hill Road BarnstableRoute 132 construction relocated intersection - TIP year 2005, 2006,200715 Airport Rotary @ Rt 132 / Rt 28 EB/WB / Barnstable Rd Barnstable New design concepts recommended in Hyannis Access Study16 Rt 132 (Iyanough Road) @ Phinneys Lane Barnstable Upgrade signals/additional lanes 2009; TIP year 2005, 2006, 200717 Route 132 (Iyannough Road) @ Independence Road / Enterprise Road Barnstable Left turn lane added to 132 southboundCCC Safety Study 2009; recommendations included in Route 6 Outer18 Eastham Rotary @ Rt 6A/28 / Rt 6, Smith Ln Eastham <strong>Cape</strong> Safety and Traffic Flow Study 200419 Route 28 (Falmouth Road) @ Old Stage Road Barnstable RSA 200720 Route 28 (Chatham Road) @ Route 6A (Cranberry Highway) Orleans CCC Safety Study 2006; TIP year <strong>2012</strong>21 Route 28 (Main St / Iyannough Rd) @ East Main Street YarmouthRecommendations included in Route 28 Safety and Traffic Flow Study200622 Route 28 (Falmouth Road) @ Phinneys Lane Barnstable RSA 2007Added left turn lanes and new signal phasing, pedestrian23 Route 28 (Main Street) @ Route 134 / Swan River Road Dennis improvements 2009/201024 Route 6 (GAR Hwy) @ Brackett Road / Old County Road EasthamCCC Safety Study 2008; recommendations included in Route 6 Outer<strong>Cape</strong> Safety and Traffic Flow Study 2004; Signal upgrade andwestbound left-turn lane added 2009, 201025 Route 6 (Mid-<strong>Cape</strong> Highway) @ Route 137 (Long Pond Road) - Exit 11 Harwich Under design; TIP year 201126 Station Avenue @ Whites Path Yarmouth Signal upgrade and northbound left-turn lane added 2003, 200427 Great Neck Road North @ Old Barnstable Road Mashpee RSA 200928 Cotuit Road @ Harlow Road Sandwich RSA 2009; TIP year 201129 Old Town House Road @ Forest Road Yarmouth RSA 2010; TIP year 201030 Route 28 (Chatham Road) @ Finlay Road Orleans TIP project, advertised 200631 Station Avenue @ Old Town House Road Yarmouth Signal upgrades 2003, 20043.2 CAPE COD DRIVERSThe demographics of <strong>Cape</strong> <strong>Cod</strong> depict a typical year-round resident that is older than theaverage population in the United States. Nearly 50% of <strong>Cape</strong> <strong>Cod</strong>’s population asreported in the 2000 census was aged 45 or older. This trend is continuing. Themigration of retirees to <strong>Cape</strong> <strong>Cod</strong> and a stable aging population is not being offset by newyounger residents or births. With the trend toward an older population in America, theFederal Highway Administration (FHWA) has recognized that older drivers requirespecial consideration. This recognition is demonstrated in the publication of severalrecent documents and a special address to Congress by the National Highway Traffic andSafety Administration (NHTSA). The focus in both cases was on the behavior of olderdrivers with respect to the “typical” driver. The NHTSA address also included issuesrelated to younger drivers. Recommended guidelines for design standards that will helpaccommodate the needs of an older driver are also included in the literature.<strong>Cape</strong> <strong>Cod</strong> <strong>Regional</strong> <strong>Transportation</strong> <strong>Plan</strong> | August 2011Chapter 3: SafetyPage 279
Another dimension defining the unique character of <strong>Cape</strong> <strong>Cod</strong> drivers is their seasonalnature. The <strong>Cape</strong> is inundated with visitors, many of whom are not familiar with <strong>Cape</strong><strong>Cod</strong> roads. Drivers that are used to city streets or parkways are also subjected to thescenic rural roads that compose a significant part of the <strong>Cape</strong>’s character. The physicalnature of these roadways may be somewhat unfamiliar to off-<strong>Cape</strong> drivers, leading tosafety concerns.Among the many drivers that visit to the <strong>Cape</strong> in the summer are a large number ofyounger motorists. These drivers have less experience in familiar surroundings and evenless in the <strong>Cape</strong> driving environment. This coupled with a “vacation attitude” requiresmore considerations for roadway design and planning. These considerations must alsobe balanced with the natural qualities that bring people to <strong>Cape</strong> <strong>Cod</strong>.3.2.1 THE SENIOR DRIVERA large and increasing percentage of <strong>Cape</strong> drivers are 65 and older. According to the2000 census, 23% or 51,399 residents of Barnstable County are aged 65 or older (seefollowing table). This steadily increasing proportion of drivers will experience decliningvision, slowed decision making and reaction times, additional difficulty in dividingattention between potential conflicts and traffic information, and reductions in strength,flexibility, and overall fitness. In many cases, these difficulties will outweigh theadditional experience that older drivers have operating an automobile. The largemajority of drivers who suffer from age-related driving deficiencies are not aware that aproblem exists.700 00600 00500 00400 00300 00200 0030,72540,90251,399 58,526100 0001980 1990 2000 Estimate 2010ProjectionFIGURE 2 - CAPE POPULATION OVER 65Chapter 3: Safety <strong>Cape</strong> <strong>Cod</strong> <strong>Regional</strong> <strong>Transportation</strong> <strong>Plan</strong> | August 2011Page 280
The overwhelming majority of <strong>Cape</strong> intersections are at grade. Based on FHWA crashstatistics for drivers, 80 years and older, more than 50% of fatal crashes occur atintersections. This is compared with 24% or less for drivers up to age 50. According tostudies referenced in the FHWA Older Driver Highway Design Handbook (1998), asdriver age increases, involvement in intersection crashes increase as well. Older driverstypically experience two types of at-grade intersection difficulties. Left turn difficultiesresult from lack of sufficient caution and poor positioning on the road during the turn.Stopping difficulties result from a failure to stop, a failure to make complete stops at stopsigns, and stops that were abrupt. Comparing survey responses of drivers aged 66 to 68with those aged 77 and older, showed that the older group had more difficulty followingpavement markings, finding the beginning of left hand turn lanes, and driving acrossintersections. Another study of older drivers indicated that the most challenging aspectof intersection negotiation is making left turns during the green, left turn permittedsignal phase. The protected “green arrow” left hand turn has been identified as animportant improvement for older drivers.Nighttime driving is associated with a higher crash risk for all drivers; however the effectof aging on vision is particularly compounded by the effect of darkness. The agingprocess causes gradual declines in a variety of ways; acuity, contrast sensitivity, glarerecovery, and peripheral vision. These declining functions make night drivingparticularly difficult for older drivers. The ability to notice and recognize objects at nightand in low-light conditions such as dawn, dusk, rain, fog, haze, and snow is a chiefconcern. According to studies referenced in the FHWA handbook show that between age20 and age 70, contrast sensitivity is reduced by a factor of three. This places the typicalolder driver at a relative disadvantage in low-light conditions. As expected, older driversrequire significantly larger letters to read unfamiliar signs. Current sign standards arebased on an assumed vision of 20/25 (as opposed to “perfect” 20/20 vision). Olderdrivers require a standard of 20/46.3.2.2 OLDER DRIVER RECOMMENDATIONSBased on the issues associated with the older driving population on <strong>Cape</strong> <strong>Cod</strong> thefollowing suggestions are recommended as considerations for <strong>Cape</strong> <strong>Cod</strong> roadwayimprovements. Many of these recommendations are from FHWA’s Older DriverHighway Design Handbook (1998). This resource should be consulted for more details.The Older Driver Handbook includes other recommendations and guidelines that shouldbe considered in <strong>Cape</strong> roadway design but their use should also be tempered to maintainthe character of <strong>Cape</strong> <strong>Cod</strong>’s roadways.Recommendations to accommodate older drivers include:<strong>Cape</strong> <strong>Cod</strong> <strong>Regional</strong> <strong>Transportation</strong> <strong>Plan</strong> | August 2011Chapter 3: SafetyPage 281
Considering protected left turn phases into signalized intersections;Maintaining delineation through more frequent restriping and street cleaning;Improving signage standards to include larger lettering;Improving lighting level standards, in particular at intersections. Considerplacing utilities underground and installing breakaway safety poles for lighting;Considering “all red” phases for signalized intersections;Establishing driver education programs for older drivers; andProviding education on other options for mobility.Mobility programs to provide alternatives to driving also need to be improved. This wasa major topic at <strong>Cape</strong> <strong>Cod</strong>’s February 2000 Transit Summit. The recommendations fromthe Summit included a “dual challenge” of reducing auto dependency and meeting theneeds of the transit dependent and those in need of human services. By improvingmobility options, significant safety improvements may be realized. A short-term publictransportation plan by the <strong>Cape</strong> <strong>Cod</strong> Transit Task Force has been developed with anemphasis on human service needs.3.2.3 YOUNG DRIVERSSafety and age-related crash statistics indicate that younger drivers’ (under age 25)problems exceed those of any other age group. The shorter average trip length of olderdrivers is accompanied by a higher frequency of fatal crashes. Young drivers outnumber,out-travel, out-crash, and die more frequently by any other measure. There are slightdifferences between younger and older drivers in the types of crashes they experience.For example, young drivers have more speeding and alcohol-related crashes. Youngerdrivers’ crashes are frequently caused by inexperience, poor judgment, and risk taking,while older drivers’ crashes are more often related to reduced physical and cognitivecapabilities.Although most crashes occur at intersections, young drivers show a greater tendencythan other age groups to be involved in non-intersection crashes. According to NHTSAstatistics, 43% of crashes by drivers age 15 to 24 are at non-intersection locations. Thatnumber reduces to 41% for drivers age 25 to 64 and 31% for drivers age 65 to 74.Younger drivers are more prone to risk-taking behavior and are subject to influences ofyouth culture and peer pressure. Many of these characteristics are evident in youngvisitors to <strong>Cape</strong> <strong>Cod</strong>.Chapter 3: Safety <strong>Cape</strong> <strong>Cod</strong> <strong>Regional</strong> <strong>Transportation</strong> <strong>Plan</strong> | August 2011Page 282
3.2.4 YOUNGER DRIVER RECOMMENDATIONSRecommendations to accommodate younger driver safety issues are divided betweenresidents and visitors:Increased education for local young drivers.Additional enforcement and warnings during the busy traffic season to reach outto young visitor drivers.Develop and implement an advertising campaign and roadside signagereminding drivers that traffic and drunk driving laws are strictly enforced on<strong>Cape</strong> <strong>Cod</strong>.3.2.5 ADDITIONAL RECOMMENDATIONSAdditional recommendations include:Better signage for visitors directing them to popular destinations (e.g., larger,well-located signs to direct patrons of the Hyannis <strong>Transportation</strong> Center mayimprove safety at the driveway on Route 28).Signage explaining the rotary “rules of the road” and similar information to beincluded in visitor brochures and <strong>Cape</strong>-related websites such as ‘Go <strong>Cape</strong> <strong>Cod</strong>:3.3 THE CAPE COD ROADWAYwww.gocapecod.orgThere are nearly 3,900 miles of roadways in Barnstable County. These include 608.5miles of Arterials and 238.9 miles of Collectors. The remaining 3,018.5 miles includedlocal roads and the many miles of unimproved ways. The typical posted speed limit onthe <strong>Cape</strong> is less than 40 miles per hour (mph) and, on average, the roadways carry 175%more traffic in July and August than they do in January and February.The character of <strong>Cape</strong> <strong>Cod</strong>’s rural roads includes narrow lanes and a typical speed limitof 35 mph. Most roads do not have shoulders and bicycles must often share the laneswith motorists. Many of the older roads evolved from Indian trails and stagecoachroutes. Roadway geometry is therefore less accommodating than current state andfederal standards. Included in the goals of this <strong>Plan</strong> is the preservation of the scenic andrural character of <strong>Cape</strong> <strong>Cod</strong>’s narrow, winding roads. However, this must beaccompanied by a program of enforcement and education especially for the drivers thatvisit the <strong>Cape</strong> in the summer. The following tables list crash rates for Routes 6, 6A, and28, respectively. For comparison purposes, the latest available three years’ data werefrom 2006-2008.<strong>Cape</strong> <strong>Cod</strong> <strong>Regional</strong> <strong>Transportation</strong> <strong>Plan</strong> | August 2011Chapter 3: SafetyPage 283
TABLE 7 - CRASH RATES (BASED ON YEARS 2006-2008): ROUTE 6FatalCrashes(Avg.Annual)FatalCrashesper 100millionVMTTownAll Crashes(Avg.Annual)Crashesper millionVMTBourne 76 0.0 2.47 0.00Sandwich 60 0.7 0.51 0.59Barnstable 121 1.3 0.86 0.93Yarmouth 64 0.7 0.88 0.96Dennis 45 0.0 1.74 0.00Harwich 41 0.0 0.77 0.00Brewster 5 0.0 0.27 0.00Orleans 12 0.0 0.58 0.00Eastham 83 0.0 1.69 0.00Wellfleet 36 0.7 0.68 1.31Truro 16 0.0 0.36 0.00Provincetown 5 0.0 0.50 0.00Total 564 3.4 0.89 0.53Registry of Motor Vehicles’ Crash Records supplied by MassDOTVehicle Miles Traveled (VMT) calculated using <strong>Cape</strong> <strong>Cod</strong> Commission traffic dataChapter 3: Safety <strong>Cape</strong> <strong>Cod</strong> <strong>Regional</strong> <strong>Transportation</strong> <strong>Plan</strong> | August 2011Page 284
TABLE 8 - CRASH RATES (BASED ON YEARS 2006-2008): ROUTE 28TownAll Crashes(Avg.Annual)FatalCrashes(Avg.Annual)Crashesper millionVMTFatalCrashesper 100millionVMTBourne 137 0.7 1.29 0.66Falmouth 109 0.0 1.25 0.00Mashpee 31 0.0 1.19 0.00Barnstable 129 1.3 1.69 1.71Yarmouth 174 0.3 5.33 0.92Dennis 71 0.0 4.85 0.00Harwich 42 0.0 1.68 0.00Chatham 42 0.0 1.59 0.00Orleans 25 0.3 1.37 1.64Total 760 2.6 1.85 0.63Registry of Motor Vehicles’ Crash Records supplied by MassDOTVehicle Miles Traveled (VMT) calculated using <strong>Cape</strong> <strong>Cod</strong> Commission traffic data<strong>Cape</strong> <strong>Cod</strong> <strong>Regional</strong> <strong>Transportation</strong> <strong>Plan</strong> | August 2011Chapter 3: SafetyPage 285
TABLE 9 - CRASH RATES (BASED ON YEARS 2006-2008): ROUTE 6AFatalCrashes(Avg.Annual)FatalCrashesper 100millionVMTTownAll Crashes(Avg.Annual)Crashesper millionVMTBourne 21 0.3 8.82 12.61Sandwich 47 0.3 2.11 1.35Barnstable 11 0 0.56 0.00Yarmouth 50 0.3 3.15 1.89Dennis 38 0 3.17 0.00Brewster 41 0.3 1.27 0.93Orleans 61 0 6.17 0.00Total 269 1.2 2.35 1.05Registry of Motor Vehicles’ Crash Records supplied by MassDOTVehicle Miles Traveled (VMT) calculated using <strong>Cape</strong> <strong>Cod</strong> Commission traffic data3.3.1 SAFETY IMPROVEMENTS THROUGH INTERSECTION MODIFICATIONTo help quantify the benefits of various safety treatments, several resources wereconsulted including The Traffic Safety Toolbox: A Primer on Traffic Safety, Chapter 28,Institute of <strong>Transportation</strong> Engineers, 2000; and Prediction of the Expected SafetyPerformance of Rural Two-Lane Highways, Chapter 5, Federal HighwayAdministration, 2000. These reports include discussions on various vehicular accesstreatments and predictions of “Accident Reduction.”3.3.1.1 Modern Roundabouts v. Four-Way IntersectionsA roundabout is a type of circular intersection with specific design and traffic controlfeatures. These features include yield control of all entering traffic, channelizedapproaches, and appropriate geometric curvature to ensure that travel speeds on thecirculatory roadway are typically less than 20 mph. The decision to install a roundaboutas a safety improvement should be based on a demonstrated safety problem of a typesusceptible to correction by a roundabout. FHWA’s Roundabouts: an InformationalGuide, (FHWA –RD-00-067, June 2000) provides a review of the safety improvementsChapter 3: Safety <strong>Cape</strong> <strong>Cod</strong> <strong>Regional</strong> <strong>Transportation</strong> <strong>Plan</strong> | August 2011Page 286
afforded by roundabouts. For example, safety problems that could be improved by aroundabout include:High rates of crashes such as right angle, head-on, left/through, U-turns, etc.High crash severity that could be reduced by slower speedsSite visibility problems that reduce the effectiveness of stop sign controlInadequate separation of movements, especially on single-lane approachesThe following figure shows that roundabouts have fewer annual injury crashes than ruraltwo-way stop-controlled (TWSC) intersections, and the total number of crashes atroundabouts is relatively insensitive to minor street demand volumes.FIGURE 3 - COMPARISON OF PREDICTED ROUNDABOUT INJURY CRASHES WITH RURAL 2-WAYSTOP -CONTROLLED INTERSECTIONS.(Source: FHWA)The Roundabout guide also includes information to compare roundabouts to signalizedintersections. The following figure shows that roundabouts have fewer injury accidentsper year than signalized intersections, particularly in rural areas. At volumes greaterthan 50,000 vehicles per day (shown on the figure as “ADT” – average daily traffic),urban roundabout safety may be comparable to that of urban signalized intersections.<strong>Cape</strong> <strong>Cod</strong> <strong>Regional</strong> <strong>Transportation</strong> <strong>Plan</strong> | August 2011Chapter 3: SafetyPage 287
FIGURE 4 - COMPARISON OF PREDICTED INJURY CRASHES FOR SINGLE-LANE AND DOUBLE-LANE ROUNDABOUTS WITH RURAL OR URBAN SIGNALIZED INTERSECTIONS.(Source: FHWA)3.3.2 SAFETY-RELATED TECHNOLOGYImproved technology provides new options for the enforcement of traffic laws and speedcontrol. The Insurance Institute for Highway Safety (IIHS) and the FHWA havefavorable reviews of applications such as red-light enforcement and photo radar. Thesetechniques should be coupled with education as well, since a goal is to improve safety bydeterring unsafe driving. The greatest benefit of these techniques has been a “haloeffect” whereby drivers are complying with traffic laws in un-monitored locations as wellas those where the technology has been installed.3.3.2.1 Red Light EnforcementAccording to IIHS, nationwide, drivers who run red lights are responsible for 260,000crashes each year. Of these, approximately 750 are fatal. Motorists are more likely to beinjured in crashes involving red light running than in other types of crashes: occupantinjuries occurred in 45% of red light running crashes compared with 30% for other crashChapter 3: Safety <strong>Cape</strong> <strong>Cod</strong> <strong>Regional</strong> <strong>Transportation</strong> <strong>Plan</strong> | August 2011Page 288
types. Enforcing red light laws by traditional means poses special difficulties for police,who in most cases must follow a violating vehicle through a red light to stop it. Thisposes a danger to motorists, pedestrians, as well as the officers. Red light runningviolations typically decrease by as much as 60% at intersections where camerasautomatically enforce the law.In areas where red light cameras have been installed as well as areas without cameras,most drivers have supported the use of red light cameras, 80% in cities with cameras and76% in cities without.3.3.2.2 Opticom SystemMany of the <strong>Cape</strong>’s signalized intersections are equipped with the Opticom prioritybasedpre-emption system. Opticom includes infrared detection equipment installedadjacent to the signal heads. When an emergency vehicle (ambulance, fire engine, etc.)equipped with an Opticom infrared emitter approaches the intersection, the detectornotifies the signal controller and a green phase is maintained for the emergency vehicle(other approaches are held under a red phase). Signal pre-emption is vital foremergency responders to safely and quickly travel to incident sites. Agencies responsiblefor intersection signal maintenance should also ensure continuous operation of theOpticom system. Upgrades to existing signals and new signal installations should beequipped with Opticom.3.3.3 COORDINATION WITH MASSACHUSETTS’ STRATEGIC HIGHWAYSAFETY PLANMassDOT, the Governor’s Highway Safety Bureau, and many other agencies haveparticipated in developing the state’s 2006 “Strategic Highway Safety <strong>Plan</strong>” (SHSP). Theoverall goal of the plan is to reverse the increasing trend of traffic-related fatalities andinjuries – towards zero fatalities and injuries. It is understandable that “zero fatalities orinjuries” may not be achievable; however, any progress made toward this goal isworthwhile. In the short-term, the draft safety plan includes two “measurable goals:”1. Achieve a 20% statewide annual reduction from 476 (year 2004) lives lost intraffic-related fatal crashes.2. Achieve a 20% statewide annual reduction from 5,554 (year 2004) in non-fataltraffic-related injuries requiring hospitalizations.The purpose of the SHSP is to identify the key safety needs in the Commonwealth andguide investment decisions to achieve significant reductions in highway fatalities andserious injuries on all public roads. The SHSP brings together all highway safety partnersin the Commonwealth and draws on their strengths to align and leverage resources to<strong>Cape</strong> <strong>Cod</strong> <strong>Regional</strong> <strong>Transportation</strong> <strong>Plan</strong> | August 2011Chapter 3: SafetyPage 289
collectively address the Commonwealth's safety challenges. The most important benefitof the SHSP is that statewide goals and safety programs are coordinated to mosteffectively reduce highway fatalities and serious injuries on all public roads.The SHSP provides a comprehensive framework, and specific goals and objectives, forreducing highway fatalities and serious injuries on all public roads.Since Safety is such an important goal of the RTP, it is important to recognize the linkbetween this chapter and the State’s 2006 “Strategic Highway Safety <strong>Plan</strong>” (SHSP). TheSHSP lists several “Emphasis Areas” including:Data Systems (focus on Crashes, Roadway, Medical, Vehicle Registration,Driver History, Citations).Infrastructure (focus on Lane Departure Crashes, Intersection Crashes)At-Risk Driver Behavior (focus on Occupant Protection, Speeding,Alcohol/Impaired Driving)Higher-Risk <strong>Transportation</strong> System Users (focus on Young Drivers, OlderDrivers, Pedestrians, Bicyclists, Motorcyclists)Public Education and Media (focus on Statewide Safety Marketing, Mediamessages, Public Awareness)Safety Program Management (focus on Process for Institutionalizing theSHSP)These Emphasis Areas are discussed in further detail below. Additionally, RTP safetyrecommendations that support SHSP Emphasis Areas listed in Section 3.3.4 areindicated with an asterisk and footnote.More information on the Strategic Highway Safety <strong>Plan</strong> is available online at:Higher Risk <strong>Transportation</strong> System UsersThe SHSP has identified “higher risk transportation system users” and potentialstrategies to improve their safety.Pedestrian SafetyThe safety plan promotes a vision that:“Increasing numbers of people throughout Massachusetts, residents and visitors alike,will be able to walk safely and conveniently to their destinations. Pedestrians,Chapter 3: Safety <strong>Cape</strong> <strong>Cod</strong> <strong>Regional</strong> <strong>Transportation</strong> <strong>Plan</strong> | August 2011Page 290
icyclists, and drivers will be aware of each other’s needs, and will act appropriatelyfor the situation in which they are walking, riding, or driving. Walking will increase,while accidents involving pedestrians will decrease.”To support this vision, the safety plan includes a goal to “raise the awareness ofpedestrian safety to motorists, the general public, visitors, and state legislatorsultimately leading to a decrease in the number of crashes involving pedestrians.”Strategies suggested in the draft safety plan include:Publicize Pedestrian Safety resourcesProvide input to the Safety Chapter of the updated Massachusetts Pedestrian<strong>Transportation</strong> <strong>Plan</strong>Provide expert advice to communities that are trying to mitigate pedestrian riskYoung Driver SafetyThe safety plan includes a goal to “reduce the number of crashes involving young driversand encourage greater compliance with the Massachusetts Junior Operator Law.”Strategies suggested in the draft safety plan include:Evaluating before and after Junior Operator Law data for crashes involving teendrivers;Educating parents of Junior Operator Law responsibilities; andConducting literature /program review to determine best practices in preventionand driver behavior modification methods.The safety plan will also include discussions on bicycle safety and older driver safety.Infrastructure SafetyIn the development of the draft safety plan, a need to better prioritize improvementprojects was identified. An overall goal emerged to: “Encourage greater compliance withthe Manual on Uniform Traffic Control Devices (MUTCD) and the MassDOT ProjectDevelopment and Design Guidebook; and expedite safety-related infrastructureprojects.” Strategies suggested in the draft safety plan include:Institute Safety Project Prioritization ProcessProvide technical assistance to local communitiesDevelop a draft Statewide Access Management <strong>Plan</strong><strong>Cape</strong> <strong>Cod</strong> <strong>Regional</strong> <strong>Transportation</strong> <strong>Plan</strong> | August 2011Chapter 3: SafetyPage 291
Safety Project Selection ProcessThrough the development of the safety plan, participants noted the need to develop aprocess for prioritizing and funding safety projects. The following figure provides anoverview of this process:MPO/RPA/District Develops and SubmitsCandidate Safety Project ApplicationProject Selection Committee (Membership TBD)Verifies Compliance with Safety CriteriaProjects SelectedMPO/RPA/District Notified to ProceedTechnical AssistanceProject is <strong>Complete</strong>dMPO/RPA/District Submits RequiredProject Evaluation Report to MassHighwayMassHighway Shares Evaluation withSHSP Executive Leadership CommitteeFIGURE 5 - INFRASTRUCTURE SAFETY PROJECT SELECTION PROCESSSource: MassDOT Highway DivisionAt-Risk Driver BehaviorThe safety plan includes a goal to “reduce the number of fatal crashes involving unbelteddrivers and passengers, speeding, and alcohol-impaired driving.” Strategies include:Tailor Messages Regarding Speed, Alcohol-impaired Driving, and OccupantProtection to Specific Audiences, particularly in locations or communities of highrisk;Support the passing, education, and subsequent enforcement of primary seat beltlegislation;Develop a web-based Statewide Safety Calendar;Increase enforcement, particularly high visibility checkpoints, and penalties forspeeding and alcohol impaired driving; andInstitute a Massachusetts Safety Report Card.Chapter 3: Safety <strong>Cape</strong> <strong>Cod</strong> <strong>Regional</strong> <strong>Transportation</strong> <strong>Plan</strong> | August 2011Page 292
Public Education and MediaThe safety plan includes a goal to: “Broaden the awareness of safety issues throughdissemination of messages to the public and elected officials; assist other Emphasis AreaTeams with implementation of their education- or media-related strategies; and assistthe Executive Leadership Committee with roll-out of the SHSP.” Strategies include:Encourage the reporting of standard safety-related information in any article orstory regarding a motor vehicle crash;Disseminate messages regarding legislative changes that impact drivers orlicensing; andDevelop and maintain a web-based Safety Calendar.3.3.4 POLICIES & STRATEGIESIn the interest of preserving the character of <strong>Cape</strong> <strong>Cod</strong> and achieving safer roads, nontraditionalmethods of improving safety must be explored. The followingrecommendations for improving safety will not substantially change the character of theroadways on <strong>Cape</strong> <strong>Cod</strong>. Recommendations consistent with the Massachusetts’ StrategicHighway Safety <strong>Plan</strong>’s (SHSP) “Emphasis Areas” are indicated with an asterisk.Consider Traffic Calming measures such as 4-way stop signs and roundabouts.*Improve striping maintenance and use of more reflective treatments.*Increase enforcement and police presence on rural roads such as 6A.*Investigate photo enforcement of red light running and speeding.*Make physical improvements that improve the safety and security of thetransportation network a priority.*Continuously monitor the condition of the transportation system to ensure that itis safe to travel on all modes throughout <strong>Cape</strong> <strong>Cod</strong>.*Continue to identify the high priority safety locations throughout <strong>Cape</strong> <strong>Cod</strong> andthen determine measures to increase safety at those locations.*Separate high and low speed travel modes, so that those traveling at slowerspeeds, such as bicycles and pedestrians, do not conflict with those traveling athigher speeds, such as rail and automobile traffic.*Encourage safe use of the transportation network through public awarenesscampaigns, promoting such things as seatbelts for motorists and helmet use forbicyclists.**Supports Massachusetts’ Strategic Highway Improvement Program “Emphasis Areas”<strong>Cape</strong> <strong>Cod</strong> <strong>Regional</strong> <strong>Transportation</strong> <strong>Plan</strong> | August 2011Chapter 3: SafetyPage 293
3.3.5 COMMUNITY CHARACTER/SAFETY ISSUESThe following recommendations are intended to preserve community character whileaddressing safety issues. Use alternative guardrail treatments, such as steel Corten or steel backed timber -all on wood posts, where guardrail is necessary. Consider roundabouts as an alternative to signalized intersections. Continue policies that disallow business logo signs on state highways inBarnstable County. Preserve all state owned/town owned land along roads and other transportationrights-of-way, for transportation uses and/or conservation. Prohibit pruning and clearing within state rights-of-way except for safetypurposes, such as making sight distance improvements. Encourage ornamental signal posts and mast arms. Develop design guidelines for <strong>Cape</strong> <strong>Cod</strong> to document preferred treatments indesign concepts and details. Encourage use of simulated brick crosswalks and other contrasting materials inorder to provide drivers with better visual identification. Crosswalks should beconsidered for all projects to accommodate walking as a viable mode of travel. Promote “Share the Road” and other bicycle education programs.3.4 ROADWAY SAFETY AUDITSSince 2007 there have been nine Road Safety Audits (RSAs)completed for locationsthroughout <strong>Cape</strong> <strong>Cod</strong>. The Audit process is overseen by MassDOT and brings togethercommunity officials and others in an intensive review of high-crash locations’operational and geometric deficiencies. Each audit includes a review of traffic and crashinformation, an onsite field review.It is important to note that the RSAs were borne directly from the U.S. DOT &MassDOT’s Highway Safety Improvement Program (HSIP). This program was formallycreated by the federal transportation legislation (SAFETEA-LU) and these efforts areintended to align the use of data to identify the most serious safety deficienciesresponsible for fatal accidents and serious injuries.Chapter 3: Safety <strong>Cape</strong> <strong>Cod</strong> <strong>Regional</strong> <strong>Transportation</strong> <strong>Plan</strong> | August 2011Page 294
3.4.1 BARNSTABLE ROAD SAFETY AUDITSThere have been three completed audits within the town of Barnstable since 2007:3.4.1.1 Route 28 in Barnstable – Lane Departure Safety Audit<strong>Complete</strong>d in 2007, this audit included an examination of a half section of Route 28between Old Stage Road and Phinneys Lane in Centerville. The audit included ShortTerm and Additional Recommendations for Route 28:Short Term Recommendations:• An initial recommendation is to inspect sight distance for vehicles exiting all drivewaysalong the corridor as some locations have vegetation which significantly inhibits sightdistance of vehicles as well as pedestrians and bicycles. There is a need to maintainlandscaping so that the sight distance will not be obstructed. Similarly, there was arecommendation for necessary tree-trimming along the north side of the roadway closerto the Phinneys Lane intersection.• Enforcement was identified by the RSA team as one countermeasure which couldaddress several of the existing safety problems along Route 28, including enforcementcentered upon speeding, aggressive driving, and red-light running (specifically at OldStage Road). It is also recommended that speed data collection be completed by thestate, <strong>Cape</strong> <strong>Cod</strong> Commission, or the Town of Barnstable to track current operatingspeeds throughout the year; this may also prove useful in the establishment ofenforcement thresholds.• The gas station under development at Phinneys Lane has a curb cut located within theintersection. Consistent with the previous operation of the gas station, it is critical thatthis driveway remain an “entrance only.”• One recommendation suggested at the RSA meeting was to explore the possibility ofconverting the existing lane usage at the intersection of Phinneys Lane. Forconsideration would be the designation of an exclusive right turn lane, which oncereconfigured would make the center lane a shared left/through lane. This request wasbased upon a perceived dominant movement and would better utilize the existing sliplane. At a minimum this idea warrants further consideration.• Pedestrian concerns at the intersection of Old Stage Road and Route 28 should beaddressed. One recommendation was the inclusion of pedestrian placards, whichexplain the meaning of pedestrian indications. It was also noted that the time allocatedto pedestrians at this intersection was inadequate and/or not functioning properly. Theresulting recommendation is to verify current field timing versus phase plans, and adjustas necessary.• It is recommended that the intersection of Old Stage Road and Route 28 be furtheranalyzed. Of specific concern from a safety perspective would be the demand associatedwith justification of an EB left-turn phase to allow protected-permissive left-turn signalphasing (PPLT). An additional consideration would be the reconfiguration of existinglane usage, based upon the resulting signal phasing changes. It is also recommended the<strong>Cape</strong> <strong>Cod</strong> <strong>Regional</strong> <strong>Transportation</strong> <strong>Plan</strong> | August 2011Chapter 3: SafetyPage 295
adjacent intersection of Old Stage Road and Camp Opechee Road be studied in a similarfashion and at the same time.• The merge at each end of the corridor was mentioned as a concern. At the intersectionof Phinneys Road the taper on the east side of the intersection was reportedly shortbecause of the adjacent herring run. Although potential redesign options should beconsidered (e.g. lengthen existing taper if possible) the existing markings and signagecould be improved to alert drivers of the merge condition. Specifically, there appears tobe an EB merge ahead warning sign missing from this location. Similarrecommendations would be beneficial for the merge and existing taper on the west sideof Old Stage Road, and should be addressed during any intersection study (see previousbullet).• Utility poles are in close proximity to the traveled way along Route 28, which is in partnegated by the presence of curbing. Nevertheless, it is recommended that the poles bereflectorized to add conspicuity. Although, it may be a longer-term solution, it is alsorecommended that plans to relocate the utility pole from the center of the sharedpedestrian/bicycle route (see Figure 5 – located near intersection with Old Stage) beinitiated in the near future.• Maintenance along Route 28 appeared to be adequate at the time of the RSA meeting;however, given the prevalence of pedestrian and bicycles, it is recommended thatpavement markings remain visible. Although most markings, also including alllongitudinal markings, the crosswalk markings across the Centerville Plaza site drivewere faded and should be refreshed. A similar, sustained approach is suggested forsignage in the area as well. Routine maintenance of drainage features in the area is alsorecommended.• Although the safety impacts resulting from the number of existing curb cuts and theirrespective volumes are better addressed through long-term solutions; it is recommendedthat short-term strategies resulting in the consolidation of curb cuts be further explored.• The next section discusses longer-term strategies based in part on the time required toimplement; however a short-term recommendation is to consider these alternatives assome of them could prove effective for a relatively low cost (e.g. conversion from 4 to 3lanes).Additional Route 28 Countermeasures:• Consolidation of access drives: It is important to note that many of the strategiesdiscussed at the RSA meeting and described below are either predicated on the need forconsolidation of existing access point, or will result in safer and improved flow basedupon consolidation of access points. The notion is that traffic will move within the plazasand will be processed at a fixed number of access points at Route 28. For example, thereis currently no access between the two main plazas (Centerville Plaza and Bell TowerMall) on the north side of Route 28; however, access between them could be useful inimplementing several of the countermeasures discussed.• Addition of a center median: The addition of a divided median would not only separatethe major flows of traffic, which will prevent cross-over the centerline crashes, but willalso eliminate crashes at all plaza drives between left-turning vehicles. As a result of acenter median all plaza drives would become right-in / right-out movements only.Several variations of a median approach were discussed including the application ofcurbed islands as well as the possibility of guard rail.Chapter 3: Safety <strong>Cape</strong> <strong>Cod</strong> <strong>Regional</strong> <strong>Transportation</strong> <strong>Plan</strong> | August 2011Page 296
• Reconfiguration of signalized intersections at Old Stage Road and Phinneys Lane: Theaddition of a center median that eliminate left turn maneuvers throughout this segmentof Route 28 would result in an increased demand at the two existing signalizedintersections. Specifically, there would be an added demand for U-turn maneuvers.Based upon the existing geometry and available right-of-way there is some concernabout the feasibility of accommodating U-turn maneuvers. Two variations which aim toaccommodate these maneuvers would be as follows:o The design of jughandles (north side at Old Stage and south side at Phinneys)that would allow for storage of the U-turn vehicles and provide a sufficient radiusfor all but was eliminated as possibility given the availability of existing right-ofway.o The redesign of each existing intersection as a roundabout would allow for theaccommodation of all intersection maneuvers, including the added U-turns.Initial concerns related to this concept are again related to the available right-ofwayas well as the public’s acceptance of roundabouts.• Controlled access from Centerville Plaza: Adding control at the intersection ofCenterville Plaza and Route 28 would undoubtedly improve safety along the corridor.Please note this option would be feasible either with or without the addition of a centermedian. Several alternatives were discussed at the RSA meeting and warrantconsideration:o One approach could be to signalize the intersection and totally control vehiclesflows to provide an orderly flow. Please note that a traffic signal warrant analysiswould be required to determine if this alternative is indeed feasible. Nevertheless,this configuration would likely allow for the creation of turn lanes with storage. Itshould be noted that this plan has been discussed, but was referred to as a “deadissue” at the time of the RSA meeting. Given its potential on both safety andefficiency this should be considered to the extent possible.o Another alternative was to design and construct a roundabout at this location.In addition to the previous stated concerns of available right-of-way and publicacceptance another possible concern would be the unbalanced nature of vehicleflows for the developed approaches, which may hinder the operational efficiencyof a roundabout. Nevertheless, this warrants further consideration.• 4 to 3 Conversion: Conceptually this alternative would eliminate one of the existingfour lanes and provide a single through lane in both the eastbound and westbounddirections. The center lane could be either a series of alternating turn pockets whichwould improve sight distance, add storage, and force drivers to cross only a single lanewhen turning, or a two-way left turn lane could be employed. One concern would be theimpact on overall efficiency and the resulting availability in sufficient gaps for leftturningvehicles that may result from creating a single lane of through traffic. Among allof the consideration listed in this section, this strategy could be implemented relativelyquickly and likely at a lower cost. As such it probably warrants further consideration inthe short-term as a possible countermeasure.• Creation of northern access road: An idea that had been considered previously wasdiscussed again at the RSA meeting. Specifically, the plan called for the creation of anaccess road that would provide connection to both Old Stage Road and Phinneys Lane.This plan would eliminate the need for left-turn maneuvers from Route 28 to PhinneysLane and would eliminate the overall burden on the various plaza access points. As<strong>Cape</strong> <strong>Cod</strong> <strong>Regional</strong> <strong>Transportation</strong> <strong>Plan</strong> | August 2011Chapter 3: SafetyPage 297
noted, this was discussed previously and was deemed not feasible given requirementsassociated with acquiring right-of way.• Route 28 at Phinneys Lane: The current skewed intersection results in sight distancechallenges and is a likely contributor to existing crashes. Another long-termconsideration would be any potential for realignment which would allow for thenorthbound and southbound approaches to be squared. In the meantime, someconsiderations should crashes remain problematic would be to fully split the phasing forthe skewed approaches. As noted, the possible countermeasures discussed above areconsidered long-term as compared to other countermeasures which could beimplemented immediately. Nevertheless, it is recommended that a short-term strategybe the consideration of these alternatives, which may prove to be feasible and costeffectivestrategies for improved safety and efficiency along this corridor.3.4.1.2 Route 28 (Falmouth Road)/Bearses Way<strong>Complete</strong>d in 2009, this study included proposed enhancements to address a series of 11Safety Issues.Safety Issue #1. Access ControlEnhancements:1. Due to the high proportion of crashes associated with the access points for adjacentcommercial uses, restrict access movements by signage and/or barriers. A median couldbe constructed in the site driveway to allow right-in/right-out-only movements anddesigned so as to deter left-in/left-out movements. Additionally, signage could be postedrestricting the left-in/left-out turning movements from driveways. Enforcement of therestrictions would be necessary.2. Increase enforcement of existing regulatory signs to prevent vehicles taking illegalturns out of adjacent commercial uses.3. Increase enforcement of vehicles cutting through adjacent commercial uses to avoidthe traffic signal.4. Reduce the number of travel lanes on Falmouth Road (Route 28) and Bearses Waynear the site driveways to decrease the number of travel lanes vehicles entering or exitingthe adjacent site driveways need to cross.Safety Issue #2. Lane ConfigurationEnhancements:1. Consider changing the right-most through lane to an exclusive right-turn lane for theFalmouth Road (Route 28) approaches.2. Improve delineation of lanes approaching the intersection to accommodate turninglanes. To prevent a “turn-only lane trap,” provide painted island pavement markings onFalmouth Road (Route 28) eastbound and westbound and on Bearses Way northboundapproaches to channelize vehicles into the through lane.Chapter 3: Safety <strong>Cape</strong> <strong>Cod</strong> <strong>Regional</strong> <strong>Transportation</strong> <strong>Plan</strong> | August 2011Page 298
3. Increase the delineation of the merge on the departure side on Falmouth Road (Route28) using the standard taper length and warning signs.Safety Issue #3. Pavement MarkingsEnhancements:1. The intersection of Falmouth Road (Route 28)/Bearses Way should be re-striped andmaintained with durable pavement markings.Safety Issue #4. Pedestrian AccommodationsEnhancements:1. Sidewalks should be considered for both sides of Falmouth Road (Route 28) andBearses Way due to the adjacent commercial uses and existing multi-use path.2. The intersection of Falmouth Road (Route 28)/Bearses Way should be upgraded toinclude pedestrian accommodations at the intersection. These accommodations shouldinclude pedestrian signals, crosswalks, and handicapped-accessible ramps.Safety Issue #5. Bicycle AccommodationsEnhancements:1. “Share the Road” signs, bicycle boxes, and bicycle actuation should be considered forall intersection approaches, especially where the bike route ends.2. Bike lanes or accommodations should be provided on each intersection approach.Safety Issue #6. Bus AccommodationsEnhancements:1. Consider providing adequate bus pull-off areas, passenger shelters, and pedestrianaccommodations for local bus routes.Safety Issue #7. Traffic Signal TimingEnhancements:1. Review and adjust signal timing to adequately process vehicles through theintersection.2. Verify that adequate clearance times are provided for each intersection approach.3. Review placement and operation of Bearses Way northbound vehicle detection.Safety Issue #8. Emergency AccessEnhancements:1. Install pre-emption system for emergency vehicles.<strong>Cape</strong> <strong>Cod</strong> <strong>Regional</strong> <strong>Transportation</strong> <strong>Plan</strong> | August 2011Chapter 3: SafetyPage 299
Safety Issue #9. Presence of Utility PolesEnhancements:1. Install reflectors on utility poles located within the clear zone.2. Relocate utility poles located within the clear zone to a location 14 feet from the edgeof Bearses Way.Safety Issue #10. Signage ImprovementsEnhancements:1. Merge warning signs (W4-2R) should be installed on Falmouth Road (Route 28)eastbound after the intersection where the roadway narrows from two travel lanes to onetravel lane. A larger sign may be considered for both Falmouth Road (Route 28)approaches.2. Install “Junction Route 28” signs on Bearses Way to inform driveways of theupcoming state highway.3. Install “Left Lane Must Turn Left” signs and pavement markings on Bearses Waynorthbound.4. Relocate “No Left Turn” signs located near Corporation Street to be visible from thegas station driveway.Safety Issue #11. Drainage IssuesEnhancements:1. Clean out and maintain existing catch basins.2. Redesign intersection and approaches to improve drainage and reduce standing water.3.4.1.3 Meetinghouse Way (Route 149)/Route 6 Ramps<strong>Complete</strong>d in 2010, the audit includes eight safety issues and identified enhancementsfor each:Safety Issue #1. Intersection ControlEnhancements:1. Change the control of the intersection, utilizing either a traffic signal or a roundabout,to reduce angle crashes and clarify control.2. Include emergency pre-emption if a traffic signal is installed.View approaching the STOP sign on the Service Road westboundapproach.Chapter 3: Safety <strong>Cape</strong> <strong>Cod</strong> <strong>Regional</strong> <strong>Transportation</strong> <strong>Plan</strong> | August 2011Page 300
Safety Issue #2. Intersection GeometryEnhancements:1. Consider incorporating the Service Road EB approach into the intersection control(see Safety Issues #1) or modify the geometry of the eastbound ramp to increaseconspicuity of vehicles entering the intersection from the Service Road EB approach.Consideration should be given to redesigning the Route 6 EB right-turn ramp to forcevehicles to make a 90º turn and to increase the separation between the Route 6 EB andService Road EB approaches. The intersection could also be redesigned as a 5-legroundabout, incorporating both Service Road approaches. A change in traffic control willalso reduce the number of conflicts a motorist must look for; a signal or a roundaboutcould accomplish this.2. Any redesign should provide adequate turning radii to accommodate emergencyvehicle and truck access through the intersection. The West Barnstable FireDepartment’s water trucks are of particular concern for the Town, since firefighters mustuse water tankers to fight fires because there is no water source north of Route 6 in WestBarnstable. Include apron for emergency and truck access if a roundabout is installed.Safety Issue #3. Sight DistanceEnhancements:1. Trim trees and shrubs adjacent to the roadways to provide adequate sight distance.2. Change the control of the intersection by installing either a traffic signal or aroundabout to lessen the effects of the horizontal and vertical alignment on sightdistance. Install appropriate advance signage to warn motorists of the change in controlat the intersection.Safety Issue #4. Pavement MarkingsEnhancements:1. Re-stripe and maintain durable pavement markings at the intersection.2. Delineate the Meetinghouse Way northbound through and right-turn lane at theintersection with the Route 6 WB ramps.Safety Issue #5. SignageEnhancements:1. Provide guide signs with messages consistent with those on the Route 6 mainline atthe ramp termini.2. Remove or relocate local organizations’ signs to improve sign clutter.3. Relocate Route 6 guide signs on the Meetinghouse Way northbound approach inadvance of the utility pole.4. Ensure that all Route 6 guide signs are visible; trim trees and/or relocate signage asappropriate.<strong>Cape</strong> <strong>Cod</strong> <strong>Regional</strong> <strong>Transportation</strong> <strong>Plan</strong> | August 2011Chapter 3: SafetyPage 301
Safety Issue #6. Pedestrian AccommodationsEnhancements:1. With intersection improvement to a roundabout or traffic signal, include appropriatepedestrian accommodations. If the intersection remains unsignalized, consider installingcrosswalks at the intersection with appropriate advance warning signage.Safety Issue #7. Bicycle AccommodationsEnhancements:1. Redesign of the intersection should incorporate bicycle accommodations such as a 4-foot paved shoulder, bike route signing, and bicycle detection if a signal is installed.Safety Issue #8. SpeedEnhancements:1. Conduct a speed study to determine the prevailing speeds and adjust speed regulationas necessary based on findings.2. Increase enforcement in the vicinity of the intersection through the use of either speedtrailers or uniformed officers.3. Reconfiguration of the intersection into a 5-leg roundabout will reduce speeds throughthe intersection area.3.4.2 DENNIS ROADWAY SAFETY AUDIT3.4.2.1 Route 134 at the Route 6 RampsThis study completed in 2009 identified six safety issues and associated enhancements:Safety Issue #1. Interchange GeometryEnhancements:1. Review operations and the feasibility of adding adequate acceleration and decelerationlanes at the interchange of Route 134/Route 6.2. At the Route 6 eastbound off-ramp to Route 134 southbound, lengthen the solid whitechannelization line from the end of the delta island to reinforce the separation betweenthe ramp and Route 134 southbound, and to delineate the additional lane. Replace themerge sign with an “add lane” warning sign. In conjunction, review the distancebetween the Route 6 eastbound ramps and the mall signal for appropriate weavedistance.3. Provide adequate turning radii to accommodate larger vehicles in a single lane on theRoute 6 eastbound ramp to Route 134 southbound and on the Route 6 westbound rampto Route 134 northbound.Chapter 3: Safety <strong>Cape</strong> <strong>Cod</strong> <strong>Regional</strong> <strong>Transportation</strong> <strong>Plan</strong> | August 2011Page 302
Safety Issue #2. Pavement MarkingsEnhancements:1. Re-stripe and maintain durable pavement markings at the interchange of Route134/Route 6.Safety Issue #3. Sign ImprovementsEnhancements:1. Provide additional regulatory guide signs on Route 134 northbound prior to the bridgeto alert drivers of the “right lane must exit” condition onto Route 6 westbound.2. Upgrade existing signage with new reflectorized signs.Safety Issue #4. MaintenanceEnhancements:1. Trim vegetation to maintain sign visibility and sight lines at the Route 134/Route 6interchange.Safety Issue #5. Pedestrian AccommodationsEnhancements:1. To accommodate pedestrians, a continuous sidewalk should be provided along Route134. Additionally, crosswalks and appropriate control would be needed at theintersections of Route 134 and the Route 6 ramps.Safety Issue #6. Bicycle AccommodationsEnhancements:1. Provide bicycle accommodations along Route 134 and bicycle connections to themulti- use path south of Route 6.3.4.3 MASHPEE ROADWAY SAFETY AUDITSMashpee has had three audits completed since 2007:3.4.3.1 Route 130 Lane Departure Road Safety Audit<strong>Complete</strong>d in 2007, this audit of lane departure crashes provided “Short TermRecommendations” and “Additional Countermeasures.”Short Term Recommendations• Install “Curve Ahead” warning signs for each direction of the two horizontal curves.Signs should be placed in advance of the curve to allow adequate response time for<strong>Cape</strong> <strong>Cod</strong> <strong>Regional</strong> <strong>Transportation</strong> <strong>Plan</strong> | August 2011Chapter 3: SafetyPage 303
motorists. To further enhance the delineation (given the lack of lighting) roadsidereflectors and/or chevrons should be considered as budget permits.• Given the reported prevalence of high speeds among the lane departure crashes, it isrecommended that Route 130 continue to remain a high speed enforcement area. It isalso recommended that speed data collection be completed by the Town of Mashpee totrack current operating speeds throughout the year; this may also prove useful in theestablishment of enforcement thresholds. Installation of solar powered radar detectorsigns at key locations to bring awareness to the operator though the instant message“YOUR SPEED IS “__”” may assist in reducing in speed violations.• It is recommended that advance yield lines (see MUTCD Figure 3B-14) andaccompanying sign (R5-1 – Yield Here to Pedestrians) be installed on both approaches tothe existing mid-block crosswalk along Route 130.• There are several signs (see Figure 8) located near the Mashpee-Barnstable lineadjacent to the bike path which feature a nearly illegible message based upon the smallfont size. It is recommended that these signs be revised or removed as drivers may spendan increased amount of time fixated away from the roadway attempting to read the signs.• Utility poles are in close proximity to the traveled way along Route 130. While longerterm strategies are considered for possible relocation of the most hazardous poles, it isrecommended that the poles be reflectorized to add conspicuity. Specific locations mayinclude the utility poles at the following addresses 84 (struck 3 times), 223, 520, 544,and 621 Route 130. All utility poles along the corridor, however, should be considered.• Continue to maintain level surface along roadside edges. At the time of the audit severalspots of edge drop-off were observed north and west of the Great Neck Road Northintersection which may in turn accelerate the impacts of lane departure crashes asmotorists are unable to return to the roadway.Additional Route 130 CountermeasuresSpeed-related issues along entire Route 130 corridor: Continue and expand upon a concentrated enforcement and educational (i.e.speed feedback, community meetings, etc.) effort. Investigate and explore possible low-cost speed-related strategies such as opticalspeed bars. Implement established traffic calming measures to meet specific needs. Acandidate location would be bulb outs in the vicinity of the mid-block pedestriancrossing.Distracted or drowsy drivers Consider rumble strips/stripes in future reconstruction for non-residential areasalong roadway in the vicinity of the Air Force Base.Pavement markings Maintain pavement markings for continued visibility.Horizontal curve delineation Assure curve ahead warning signs, chevrons and roadside reflectors for the north/west horizontal curves.Driver failure to properly identify slowing/stopping vehicles in advance of a turn Educational campaign alerting motorists to the frequency of turning vehicles. Onthe low end this may entail a warning sign “Watch forChapter 3: Safety <strong>Cape</strong> <strong>Cod</strong> <strong>Regional</strong> <strong>Transportation</strong> <strong>Plan</strong> | August 2011Page 304
Turning Vehicles”, but may include the strategic use of a Variable Message Sign,Newspaper Articles, or other PI&E activities. To the extent possible (based on available right-of-way) explore the feasibility forturning bays or lanes for frequent turn pockets as part of access managementprogram. Candidate locations would be in the vicinity of roadway N/W of theGreat Neck Road intersection.Cross over the centerline crashes resulting from passing vehicles Although there are currently no passing zones, it is recommended that the Towncontinue to restrict, and enforce no passing zones along the corridor.Sight distance turning from Dunkin Donuts site drive Install warning sign for SB traffic. Short Term & Low Cost Low Roadwaymodifications to improve sight distance (i.e. cut back crest vertical curveinhibiting sight to west).Presence of utility poles within the roadway clear zone Reflectorize utility poles. Add guard rails for particularly hazardous utility poles Work with utility company to remove utility poles from clear zone.Edge drop-off at roadside Maintain and fill roadside as needed to prevent edge drop-off.Safe crossing opportunities for pedestrians Install advance yield line with accompanying sign (R5-1) for existing mid-blockcrosswalk location.Guard rail opportunitiesIn areas with insufficient clear zone, guard rail installation should be considered,including but not limited to embankments and utility poles. Specific locations includethe dark area in the vicinity of the runway clear zone.Sign efficiencyIdentify unnecessary signs in heavily signed areas (i.e. signalized intersection)that can be moved/removed to prevent sign clutter. A specific example is thepedestrian warning sign on the approach to a signalized intersection, aspedestrians would be expected. Remove/change warning signs located near the Mashpee-Barnstable lineadjacent to the bike path with small font requiring significant driver attention forcomprehension.Illumination and supports for runway crossing at Otis Air Force BaseExplore possibilities to shield runway supports and glare from runway lights forpassing motorists.Dark stretches of Roadway Install lighting along dark stretches of road on the N/W section of Route 130.Given challenges with power, it may be necessary to explore solar power optionfor the lighting.Continued maintenanceThe pavement condition, drainage, and coverage resulting from brush are in goodcondition. To assure safety this needs to be maintained.Herring observation area where vehicles and pedestrians conflict Consider warning sign and additional parking restrictions.<strong>Cape</strong> <strong>Cod</strong> <strong>Regional</strong> <strong>Transportation</strong> <strong>Plan</strong> | August 2011Chapter 3: SafetyPage 305
3.4.3.2 Great Neck Road North/Old Barnstable RoadSix safety issues and associated enhancements were identified in this 2009 study:Safety Issue #1. Intersection GeometryEnhancements:1. Increase corner radii to accommodate larger vehicles.2. Narrow the Old Barnstable Road westbound approach and align it with the departurelane on the other side of the intersection to the extent possible within the right-of-way.Safety Issue #2. Grading IssuesEnhancements:1. Change the crown line on Great Neck Road North to facilitate crossing and turningmovements from Old Barnstable Road.2. Re-grade the Old Barnstable Road westbound approach to eliminate the low spot.Safety Issue #3. Limited Sight DistanceEnhancements:1. Measure the sight distances from the Old Barnstable Road westbound approach andcompare them to the required sight distances for the existing conditions. Based on theseresults, the following additional enhancements may be appropriate:2. Relocate signs and fence on the southeast corner to increase visibility for vehiclesexiting Old Barnstable Road westbound.3. Re-align both the horizontal and vertical geometry of Great Neck Road North toprovide adequate sight distance for all approaches.4. Re-grade the slope on the eastern side of the Great Neck Road North northboundapproach to provide adequate sight distance for the Old Barnstable Road westboundapproach.5. Study closing the Old Barnstable Road westbound approach to vehicle traffic. Thiswould include traffic analysis of the Route 28/Great Neck Road/Route 151 rotary toensure that the closure would not create undue traffic delay there.Safety Issue #4. Pavement MarkingsEnhancements:1. Re-stripe and maintain durable pavement markings at the intersection of Great NeckRoad North/Old Barnstable Road.Chapter 3: Safety <strong>Cape</strong> <strong>Cod</strong> <strong>Regional</strong> <strong>Transportation</strong> <strong>Plan</strong> | August 2011Page 306
Safety Issue #5. Sign ImprovementsEnhancements:1. Install new double-sided one-way signs on both sides of the roadway on the OldBarnstable Road westbound approach to improve their visibility to vehicles travelingnorthbound and southbound on Great Neck Road North.2. Replace the worn Intersection Ahead warning sign for the Great Neck Road Northnorthbound approach.3. Install an Intersection Ahead warning sign for the Great Neck Road North southboundapproach.4. Relocate the 45 mph speed limit sign for Great Neck Road North northbound trafficfarther beyond the intersection with Old Barnstable Road. This may requiremodifications to the speed regulations.5. Adjust sign locations, sizes, and heights to conform to MUTCD requirements and notto impair sight distance.6. Remove the CCRTA bus stop sign located on the eastern side of Great Neck RoadNorth just north of Old Barnstable Road.Safety Issue #6. Limited Pedestrian AccommodationsEnhancements:1. Provide a crosswalk at a safe location across Great Neck Road North with pedestrianwarning signs to inform drivers.3.4.4 SANDWICH ROAD SAFETY AUDITSSince 2007, two safety audits were completed in Sandwich:3.4.4.1 Cotuit Road/Harlow Road/South Sandwich RoadThis study identified eight Safety Issues and associated Enhancements and was producedin 2009:Safety Issue #1. Intersection SkewEnhancements:1. Re-align Harlow Road and South Sandwich Road to eliminate the skew.Safety Issue #2. Intersection OffsetEnhancements:1. Re-align Harlow Road and South Sandwich Road to eliminate the offset.2. Relocate the utility pole located on the southeast corner across from South SandwichRoad.<strong>Cape</strong> <strong>Cod</strong> <strong>Regional</strong> <strong>Transportation</strong> <strong>Plan</strong> | August 2011Chapter 3: SafetyPage 307
Safety Issue #3. Asa Meiggs RoadEnhancements:1. Re-align Asa Meiggs Road to intersect Cotuit Road at the preferred 90º angle.Safety Issue #4. Vertical Alignment of Cotuit RoadEnhancements:1. Re-align and re-grade Cotuit Road to eliminate the sag and crest curve combination.Safety Issue #5. Horizontal Alignments of Side StreetsEnhancements:1. Re-align Harlow Road and South Sandwich Road to eliminate their horizontal curvesprior to the intersectionSafety Issue #6. Grading IssuesEnhancements:1. Change the crown line on Cotuit Road to facilitate crossing and turning movementsfrom Harlow Road and South Sandwich Road.Safety Issue #7. Restricted Sight DistanceEnhancements:1. Trim vegetation and maintain intersection sight lines at the intersection of CotuitRoad/Harlow Road/South Sandwich Road.Safety Issue #8. Sign Locations and ConformanceEnhancements:1. Verify that the locations of the “Stop Ahead” warning signs and pavement markings onHarlow Road and South Sandwich Road conform to MUTCD guidelines for size, location,and mounting height.2. Verify that the locations of the “Intersection Ahead” warning signs on Cotuit Roadconform to MUTCD guidelines for size, location, and mounting height.3. Replace street name signs to conform to MUTCD guidelines for letter height.3.4.4.2 - Route 6: Major Highway Median Cross-Over CrashesFrom 2009, this study included a series of recommendations to reduce frequency andseverity of cross over crashes on Route 6 in Sandwich to address several “Risk Factors”and “Risk Ratings.”Areas of open, crossable medianRisk Rating “E” Install barrier in open areas (1.3miles total)Chapter 3: Safety <strong>Cape</strong> <strong>Cod</strong> <strong>Regional</strong> <strong>Transportation</strong> <strong>Plan</strong> | August 2011Page 308
Lack of shoulders (both inside and outside) with bermsRisk Rating “E” – Create 4 foot inside shouldersHigh speedsRisk Rating “D” Increase enforcement“Authorized Vehicle Only” turnaround locations and misuseRisk Rating “C” Optimize location and consolidate turnarounds Use alternative signage for restricted useDrainage problem – ponding occur in several areasRisk Rating “D” Rehabilitate surfaceShort acceleration/deceleration lanes and inadequate signageRisk Rating “D” Provide shoulders Extend accel-decel lane markings Provide adequate and regulating (YIELD) signageDriver guidance – signs worn and obstructedRisk Rating “C” Install new warn signs approaching Interchange No. 2 Clear/trim vegetation Install delineator posts Install rumble strips – inside shoulder3.4.5 YARMOUTH ROAD SAFETY AUDITThere has been one audit completed since 2007 in Yarmouth.3.4.5.1 - Old Townhouse Road/Forest RoadThis study completed in 2010 identified seven Safety Issues and associatedEnhancements:<strong>Cape</strong> <strong>Cod</strong> <strong>Regional</strong> <strong>Transportation</strong> <strong>Plan</strong> | August 2011Chapter 3: SafetyPage 309
Safety Issue #1. Intersection GeometryEnhancements:1. Reconstruct the intersection to remove the offset alignment of Forest Road and tosimplify the movements (i.e., consolidate two Forest Road intersections into one) andclarify control (i.e., signalization).2. Consider vehicular movements to/from the shopping plaza driveway southbound ontoOld Town House Road to right-in/right-out only.3. Consider vehicular movements to/from Constance Avenue in the redesign.4. Provide adequate turning radii to accommodate emergency vehicle (e.g., fire truck)access through the intersection and to the shopping plaza.5. Introduce a traffic signal to reduce angle crashes, clarify control, and better serveconcentrated peak demand generated by the transfer station.6. New traffic signal should include emergency pre-emption.Safety Issue #2. Pavement MarkingsEnhancements:1. Re-stripe and maintain durable pavement markings at the intersection.2. Fill pot-holes and consider a more durable street print product rather than traditionalpaint or thermoplastic pavement markings.Safety Issue #3. Sign Improvements Enhancements:1. Provide advance intersection warning signage on the Old Town House Road eastboundand westbound approaches in the short-term (unsignalized condition).2. Install pedestrian crossing warning signage on the Old Town House Road westboundapproach in the short-term (unsignalized condition).3. Replace signage on the Forest Road northbound approach at Constance Avenue withW2-2L installed on right side of Forest Road northbound in advance of intersection withConstance Avenue.4. Upgrade all existing signage with new reflectorized signs to meet standards ofconsistency with the MUTCD.Safety Issue #4. Sight DistanceEnhancements:1. Trees located along the edge of Old Town House Road in the vicinity of the intersectionshould be relocated or removed. In the short-term, all trees in the vicinity of theintersection should be trimmed to improve sight lines.2. The Garden Club planting area should be relocated to a location that will not blocksight lines.3. The wood guard rail posts along the south side of Old Town House Road should beremoved.Chapter 3: Safety <strong>Cape</strong> <strong>Cod</strong> <strong>Regional</strong> <strong>Transportation</strong> <strong>Plan</strong> | August 2011Page 310
4. Introduce traffic signal control or separate two Forest Road northbound lanes toimprove sight lines.Safety Issue #5. Pedestrian AccommodationsEnhancements:1. Consider installing a crosswalk across the eastern leg of the intersection if signalized.2. Install sidewalk along the north side of Old Town House Road between the shoppingplaza and the Old Town House Road Park and Recreation area entrance.Safety Issue #6. Bicycle AccommodationsEnhancements:1. Redesign of the intersection should incorporate a bicycle connection between the twoexisting bicycle paths. Installation of a traffic signal, and a bike lane or path, wouldprovide a safe connection2. The alignment of the bicycle path across Forest Road near the transfer facility on thenorth side of Old Town House Road should be modified to minimize conflicts withtransfer facility traffic. In the short-term, the transfer facility signage posted on the fenceshould be relocated to improve cyclist and pedestrian visibility.Safety Issue #7. SpeedEnhancements:1. Conduct speed study to determine the prevailing speeds and adjust as necessary basedon findings.2. Post speed limits.3.5 MULTIMODAL TRANSPORTATION SAFETYSafety information is readily available for several modes of travel. The following sectionsprovide safety issue details on several transportation modes.3.5.1 PUBLIC TRANSIT SAFETYPublic transit vehicles are generally considered to operate at a higher level of safety incomparison to private automobiles. Drivers are required to have higher qualificationsand are subject to strict safety guidelines. The <strong>Cape</strong> <strong>Cod</strong> <strong>Regional</strong> Transit Authority hasprovided safety data for the years 2007-2009 as shown in the following table:<strong>Cape</strong> <strong>Cod</strong> <strong>Regional</strong> <strong>Transportation</strong> <strong>Plan</strong> | August 2011Chapter 3: SafetyPage 311
TABLE 10 - INJURIES FROM COLLISIONS/SLIPS AND FALLS IN TRANSIT VEHICLES AND ONTRANSIT PROPERTYJan Feb Mar Apr May Jun Jul Aug Sep Oct Nov Dec2007 0 12008 2 72009 1 4 1 1(Source: <strong>Cape</strong> <strong>Cod</strong> <strong>Regional</strong> Transit Authority)For the years 2007-2009, the values of property damage to CCRTA vehicles and privatevehicles were $27,393 in April 2007 and $22,922 in August 2007 for a total of $50,315.3.5.2 BICYCLIST SAFETYBicycling on <strong>Cape</strong> <strong>Cod</strong> roadways can be a challenge. The mixture of narrow roadways,high traffic volumes, and pleasant summer weather creates a great deal of difficultvehicle-bicycle interaction. <strong>Cape</strong> <strong>Cod</strong>’s pleasant summer weather brings bicyclists ontoroadways at the time when vehicular traffic is at its peak. As a mode that can efficientlytransport travelers pollution-free, it is worthy of our attention in providing facilities thatare safe for cyclists, pedestrians, and other transportation users.The following table includes a town-by-town breakdown of bicycle-vehicle crashes forthe years 2006-2008. With 39 reported crashes over the three-year period, Yarmouthhad the greatest number of bicyclist-vehicle crashes (Dennis was second with 25crashes). Staff has observed numerous cyclists along Route 28 (where many of theidentifiable crashes occurred) during the summer season. Comments at public meetingsindicate that many summer workers in Yarmouth use bicycling to commute to work; themany motels in the area appear to be the origin of vacationers that are biking to thevarious Route 28 attractions (e.g., mini-golf, ice cream, gift shops, etc.).Chapter 3: Safety <strong>Cape</strong> <strong>Cod</strong> <strong>Regional</strong> <strong>Transportation</strong> <strong>Plan</strong> | August 2011Page 312
TABLE 11 - BICYCLIST-VEHICLE CRASH HISTORY (2006-2008)All Crashes FatalTown(3-yeartotal)Crashes (3-year total)Bourne 6 0Sandwich 7 0Falmouth 18 0Mashpee 2 0Barnstable 4 2Yarmouth 39 0Dennis 25 0Harwich 8 0Chatham 13 0Brewster 8 0Orleans 13 0Eastham 6 0Wellfleet 5 0Truro 4 0Provincetown 8 0Total 166 2(Source: MassDOT)Bicyclists are often categorized into three subsets: (A) Experienced, long-distance riders,(B) Occasional riders, and (C) beginners and children. For the type-A rider, most of theirtravel is made along roadways because of the higher travel speed available and the fewerobstacles (driveways etc.) encountered on alternative routes. Type B riders prefer offroadopportunities such as bike paths, but can be comfortable in bike lanes or wideshoulders. Type C riders seek out the least busy sections of bike paths and sidewalks;these riders generally do not use biking for transportation purposes.<strong>Cape</strong> <strong>Cod</strong> <strong>Regional</strong> <strong>Transportation</strong> <strong>Plan</strong> | August 2011Chapter 3: SafetyPage 313
3.5.3 PEDESTRIAN SAFETYPedestrians are among the most vulnerable users of the transportation system, and yet itis important to remember that almost all travelers become pedestrians for at least part ofevery trip. Safe accommodations for walking can encourage a reduction in trafficcongestion and air pollution and encourage a healthier alternate mode. The figuresshown in the following table list the number of vehicle-pedestrian crashes for each town.Yarmouth had the highest number (22) of crashes reported from 2006 to 2008. Thisnumber represents two sides of an issue: the high number of pedestrians observed alongRoute 28 in the summer, representing peoples’ willingness to walk for transportation,however it also shows the deficiencies in pedestrian accommodation (e.g., pedestriancrossings at intersections) resulting in the high crash history.TABLE 12 – PEDESTRIAN-VEHICLE CRASH HISTORY (2006-2008)All Crashes FatalTown(3-yeartotal)Crashes (3-year total)Bourne 15 0Sandwich 5 0Falmouth 16 0Mashpee 4 1Barnstable 6 1Yarmouth 22 1Dennis 15 1Harwich 10 0Chatham 4 0Brewster 6 0Orleans 9 1Eastham 7 0Wellfleet 2 0Truro 0 0Provincetown 5 0Total 126 5(Source: MassDOT)Separate sidewalks and pathways are important to accommodate pedestrians. Atintersection crossings, installation and maintenance of call buttons will provide forChapter 3: Safety <strong>Cape</strong> <strong>Cod</strong> <strong>Regional</strong> <strong>Transportation</strong> <strong>Plan</strong> | August 2011Page 314
etter compliance and safety of pedestrians. Research published by the Institute of<strong>Transportation</strong> Engineers (“Pedestrian Countdown Signals: Experience with anExtensive Pilot Installation,” ITE Journal, January 2006) reports that the number ofpedestrian injury crashes declined by 52 percent after the introduction of countdownsignals. At the time when the pedestrian phase begins the flashing hand-symbol (i.e.,flashing “Don’t Walk”) a numeric countdown signal shows the remaining number ofseconds until the steady hand-symbol (i.e., steady “Don’t Walk”) is displayed. Thisprovides the pedestrians with information necessary to determine whether they shouldstart crossing or speed up their crossing.3.5.4 AIR TRAVEL SAFETYThe Federal Aviation Administration has assembled a database of safety incidents at<strong>Cape</strong> <strong>Cod</strong> airports (Hyannis and Provincetown). During the years 2005-2008, 5incidents were listed in the FAA database for these airports. These data are summarizedin the following table:TABLE 13 - AIR TRAVEL SAFETY INCIDENTSYear Fatal Non-Fatal Incident2005 0 0 12006 0 1 02007 0 1 02008 1 1 0(Source: Federal Aviation Administration)3.5.5 SUMMARY OF GENERAL TRANSPORTATION SAFETYRECOMMENDATIONSWork with state and local agencies to improve the accuracy and timeliness (e.g.,within 12 months of the end of each year) of crash dataConsider protected left turn phases into signalized intersectionsMaintain delineation through more frequent restriping and street cleaningImprove signage standards to include larger letteringImprove lighting level standards, in particular at intersections. Consider placingutilities underground and installing breakaway safety poles for lightingConsider extension of “all red” phases for signalized intersectionsEstablish driver education programs for older driversProvide education on other options for mobilityIncrease education for local young drivers<strong>Cape</strong> <strong>Cod</strong> <strong>Regional</strong> <strong>Transportation</strong> <strong>Plan</strong> | August 2011Chapter 3: SafetyPage 315
Support additional enforcement and warnings during busy traffic season to reach outto young visitor driversDevelop and implement an advertising campaign and roadside signage remindingdrivers that traffic and drunk driving laws are strictly enforced on <strong>Cape</strong> <strong>Cod</strong>.Provide better signage for visitors directing them to popular destinationsInstall signage explaining the rotary “rules of the road” and disseminate similarinformation to be included in visitor brochures and <strong>Cape</strong> related websites such as ‘Go<strong>Cape</strong> <strong>Cod</strong>:’www.gocapecod.orgConsider conversion of conventional intersections (signalized or unsignalized) whichhave high crash rates to roundaboutsPromote the use of red-light cameras at high crash rate signalized intersectionsSupport road designs which are estimated to reduce crashes and improve safety forall users3.6 INTELLIGENT TRANSPORTATION SYSTEMSIntelligent <strong>Transportation</strong> Systems (ITS) are applications of advanced technology in thefield of transportation, with the goals of increasing operation efficiency and capacity,improving safety, reducing environmental costs, and enhancing personal mobility. Apolicy of <strong>Cape</strong> <strong>Cod</strong> MPO is to advocate and endorse the consideration of Intelligent<strong>Transportation</strong> Systems solutions for transportation problems as a routine part of thetransportation planning process. As a stakeholder in the Southeastern Massachusetts<strong>Regional</strong> ITS Architecture, the <strong>Cape</strong> <strong>Cod</strong> MPO is committed to continuing an active rolein these ITS systems. This includes maintaining channels of communication between the<strong>Cape</strong> <strong>Cod</strong> Commission and other stakeholders, including but not limited to: theMassDOT; the Southeastern <strong>Regional</strong> <strong>Plan</strong>ning and Economic Development District(SRPEDD); the Old Colony <strong>Plan</strong>ning Council (OCPC), and the <strong>Cape</strong> <strong>Cod</strong> <strong>Regional</strong> TransitAuthority (CCRTA). A regional ITS architecture is a framework that defines componentsystems and their interconnections. Successful ITS deployment requires an approach toplanning, implementation, and operations that emphasizes collaboration betweenrelevant entities and compatibility of individual systems. The regional architecture is amechanism design to ensure this collaboration and compatibility occurs. Inputs into ITSsystems can involve any variety of a range of collection devices, including:• Loop detectors in the pavement and sophisticated ground level radar systems are ableto collect real time traffic volume and speed data.• Video equipment is often used to monitor the transportation system, which is useful inallowing system operators to immediately detect areas of congestion that may beforming. It is also used to detect incidents such as crashes and disabled vehicles, in turnaccelerating emergency dispatch and the overall incident management process. Videosurveillance is also a useful tool for security and incident management in transit vehiclesand around stops and terminals.Chapter 3: Safety <strong>Cape</strong> <strong>Cod</strong> <strong>Regional</strong> <strong>Transportation</strong> <strong>Plan</strong> | August 2011Page 316
• Automatic vehicle locators (AVL) on board transit vehicles, emergency responsevehicles, and roadside assistance vehicles allow operators to know where vehicles are inreal time that allows for more efficient dispatch and adjustment of traffic controls ifnecessary.• Automated Fare Payment Systems that allow riders on transit systems to payelectronically using a "smart card" (prepaid balance) or in the future conventionalcredit/debit cards rather than cash.• Transmitters onboard transit and emergency vehicles alike are used to pre-empt trafficsignals ahead or to alert travelers at a transit stop that the vehicle is approaching.• Remote weather stations and Doppler radar provide real time weather conditionsoccurring throughout the transportation network, and provide alerts regarding eventssuch as icing or flooding that may be occurring. These are some of the technologicalapplications that can be utilized for managing the regional transportation network. All ofthis information travels over both hard-wired and wireless communication systems tosystems that manipulate the data and distribute it to users of the transportation system.End users of ITS system and the output media include:• Transit Operation Centers that monitor the transit system through video feed, radiocommunications, and AVL signals, allowing operators to make improved decisionsregarding security, dispatch, and incident management.• Traffic Operation Centers that monitor the roadway system through reports fromsystems like loop detection and video feed, allowing operators to make improveddecisions regarding congestion management, incident management, security, andmaintenance management.• Traveler Information Services such as the national 511 System or SmarTraveler locally,which receive traffic data from traffic and transit operations centers and distribute it tousers via hard line and wireless communications.• Variable Message Signage that allows operators from traffic and transit operationcenters to instantly relay messages to users on the system.• Kiosks that receive information from transit operation centers and transit vehicles,relaying it to users of the transit system.MassDOT owns and operates several permanent variable message signs and a large fleetof portable variable message signs throughout the Commonwealth. Permanent stationsare used to alert drivers to major events affecting locations such as the Route 128 beltand Interstate 93, as well as the tunnels. Portable variable message sign trailers are<strong>Cape</strong> <strong>Cod</strong> <strong>Regional</strong> <strong>Transportation</strong> <strong>Plan</strong> | August 2011Chapter 3: SafetyPage 317
located throughout the state and are able to be dispatched to locations wherever andwhenever needed. Often they are used for a major local event, such as a road race orsidewalk carnival. They can also be dispatched for major unplanned events, such as achemical spill that forces an extended closure of a highway. All variable message signsare controlled from the MassDOT Traffic Operations Center in South Boston. MassDOTis using automated vehicle locators on their snow removal and highway maintenancefleet, increasing the efficiency of dispatch of resources to where they are needed.Travelers are able to obtain real time traffic conditions for highways in theCommonwealth, including highway approaches to the <strong>Cape</strong> such as Routes 3 and 495 aswell as the <strong>Cape</strong> <strong>Cod</strong> Canal bridges, through SmartRoutes phone and web links, and willsoon be available through a statewide 511 system and MassDOT website.3.7 CAPE COD COMMISSION’S LOCATION-SPECIFIC SAFETYSTUDIESThe <strong>Cape</strong> <strong>Cod</strong> Commission has completed several “Safety at Three Locations” safetystudies. The following is a summary of the locations that were studied and highlights ofrecommended safety improvements. Full reports are available on the internet:www.gocapecod.org/safety3.7.1 BOURNE: OTIS ROTARYThis location was one of three examined in the 2006 <strong>Transportation</strong> Safety Report.As a short-term improvement, it is recommended that the rotary be restriped for 2-laneswith improved signage. A grade-separation alternative is recommended forconsideration as the long-term solution for this location due to its expected benefits totraffic flow and safety.The next-step for this location would be to hold a public meeting to discuss thealternatives outlined in this report. This meeting should include area residents andbusiness representatives, local agencies, state and local officials, etc. The objective of thismeeting is to build consensus for the optimal safety improvement at the Otis Rotary.3.7.2 EASTHAM: EASTHAM/ORLEANS ROTARYIn 2009, a <strong>Transportation</strong> Safety Report was completed featuring this and two otherlocations. The <strong>Cape</strong> <strong>Cod</strong> Commission <strong>Transportation</strong> Staff identified both short-termand long-term recommendations for the Eastham Rotary. Short-termChapter 3: Safety <strong>Cape</strong> <strong>Cod</strong> <strong>Regional</strong> <strong>Transportation</strong> <strong>Plan</strong> | August 2011Page 318
ecommendations include looking at signage and ideas for safe pedestrian connections.Long-term recommendations include redesigning the rotary to incorporate elements of amodern roundabout.The first recommendation of this study is for the towns of Eastham and Orleans evaluatethe types of signage used to caution motorists of the upcoming rotary and the placementof those signs. There is a large disparity between the accidents on two of the approachesas compared to the other two, and driver awareness is likely related. It is recommendedthat the ‘Rotary’ signs currently placed on the rotary’s island be moved leftwards. Eachapproach has this sign facing it from the island, but the sign is not visible until you arewithin two car lengths of the merge. Shifting the signs left would allow them to be visiblefrom a farther distance.On both the Route 6A/28 and Route 6 from Eastham approaches, where rear-endingcrashes were most prevalent most drivers cited their lack of attention as the contributingfactor to the crash. This study recommends that the towns of Eastham and Orleansinvestigate the potential use of grooved pavement as a means of alerting drivers to theupcoming rotary. Driving over grooved pavement creates a sound that can be disturbingto residents and nearby businesses, so appropriate siting is essential.Route 6 has two travel lanes from Eastham towards the rotary until there is a lane-dropabout a half mile before the rotary. Town officials have shown concern that the signindicating the lane-drop may be presented to drivers too late. This study recommends anevaluation of signage regarding the reduction from two lanes to one.As another short-term improvement, this study recommends the towns of Eastham andOrleans explore options to include sidewalks and crosswalks to accommodatepedestrians. Currently, no sidewalk connects around and through the rotary. There isalso no understood method of traversing the intersection on foot; therefore the actions ofpedestrians are unpredictable to the motorists.Another recommendation is to conduct an analysis of the relationship and issuesconcerning the rotary, Route 6A/28, and Route 6A/28’s northern intersection with CanalRoad. This intersection is already a safety concern to town officials, and its risk tomotorists may be exacerbated by additional development along Canal Road.Town officials have cited a number of concerns related to the Smith Lane approach to therotary. First, while the approach is indeed located in Eastham on Smith Lane, the road’sname causes confusion to drivers who are not aware the road becomes Rock HarborRoad in Orleans in less than 150 feet of driving. Secondly, motorists traveling eastbound<strong>Cape</strong> <strong>Cod</strong> <strong>Regional</strong> <strong>Transportation</strong> <strong>Plan</strong> | August 2011Chapter 3: SafetyPage 319
on Rock Harbor Road have no warning of the upcoming, sharp, right-hand turn towardsthe rotary. This condition results in drivers missing their turns, then stopping short in aconflict zone once their mistakes are realized. Lastly, there is an unnecessarily wide turnfrom the off ramp at this approach onto Smith Lane eastbound. The size of the turningradius creates a large expanse of unmarked asphalt. This study recommends that SmithLane be considered for improvements related to signage and traffic flow (which may ormay not include roadway reconfigurations and restrictions in turning movements).This study’s long-term recommendation includes redesigning the rotary to integrateelements of a modern roundabout. Potential alterations include reshaping theapproaches to have a larger angle of deflection, emphasis on yielding to vehicles alreadywithin the rotary, island refuge for pedestrians, and updated pavement markings thatcorrelate with the changes. This would help foster a more pedestrian-friendlyenvironment (in addition to the operational benefits). A proposed pedestrian networkwould encourage walkers to take the Canal Road sidewalk to its intersection with the<strong>Cape</strong> <strong>Cod</strong> Rail Trail. From there, users can use the bike trail to cross Route 6 and safelyaccess Rock Harbor Road.3.7.3 EASTHAM: ROUTE 6/BRACKETT ROADThe 2008 <strong>Transportation</strong> Safety Report included this as one of three locations studied.As a short-term improvement, it is recommended that the Town of Eastham moveforward with additional stop signs at the <strong>Cape</strong> <strong>Cod</strong> Rail Trail Bike Path at Brackett Road,increase the sight distance at the corners of Brackett Road and the <strong>Cape</strong> <strong>Cod</strong> Rail Trail,construct a Gateway Entrance (signage and landscaping) on Brackett Road to alertmotorist entering the North Eastham Village Area and work with the Village GreenShopping Center owner on parking lot improvements to reduce driver confusion with theplaza parking lot.The Town of Eastham should advance the Brackett Road improvement plan currentlyunder design and continue to work with local and state officials for an upgrade(including Route 6 left turn lanes) of the Route 6, Brackett Road and Old County Roadintersection.Chapter 3: Safety <strong>Cape</strong> <strong>Cod</strong> <strong>Regional</strong> <strong>Transportation</strong> <strong>Plan</strong> | August 2011Page 320
3.7.4 HARWICH: ROUTE 137/ROUTE 39This location was one of three examined in the 2006 <strong>Transportation</strong> Safety Report.Interconnects and access management alternatives should be installed at each parcel inthe vicinity of this intersection. Sidewalks should be installed on both sides of theapproaching roadways to connect major land uses to the surrounding neighborhoods.The next-step for this location would be to hold a public meeting to discuss thealternatives outlined in this report. This meeting should include area residents andbusiness representatives, local agencies, state and local officials, etc. The objective ofthis meeting is to build consensus for the optimal safety improvement at the Route137/39 intersection.3.7.5 ORLEANS: ROUTE 6A/ROUTE 28This location was one of three examined in the 2006 <strong>Transportation</strong> Safety Report.It is recommended that striping, crosswalks, and signage be installed immediately. Inthe longer term, it is recommended that signalization or a modern roundabout beconsidered along with driveway consolidation and other access management techniques.The next-step for this location would be to hold a public meeting to discuss thealternatives outlined in this report. This meeting should include area residents andbusiness representatives, local agencies, state legislators, MassDOT/ Highway, etc. Theobjective of this meeting is to build consensus for the optimal safety improvement at thisintersection. MassDOT/Highway should proceed with designing safety improvementsresulting from the public process.3.7.6 PROVINCETOWN: ROUTE 6/SHANK PAINTER ROADIn 2009, a <strong>Transportation</strong> Safety Report was completed featuring this and two otherlocations.The study found that the length of Shank Painter Road is in need of significantimprovements. The amount and size of curb cuts on both sides of the street makes safepedestrian travel difficult. Town officials and local property owners should worktogether to create a plan to consolidate the breaks in the curbing and make room forpedestrian facilities.<strong>Cape</strong> <strong>Cod</strong> <strong>Regional</strong> <strong>Transportation</strong> <strong>Plan</strong> | August 2011Chapter 3: SafetyPage 321
As this road is an important bicycle and pedestrian thoroughfare in Provincetown,accommodations for these modes should be made along its entire length. The pavedshoulder stretches across many wide curb cuts, including many areas where cars areparking at right angles to the shoulder. Also, crosswalks need to be restriped, as theyhave become faded.This study recommends that a sidewalk plan be created for Shank Painter Road, to createan organized, well-connected pedestrian path and bicycle route. The town may considerpursuing enhancement funds from the <strong>Transportation</strong> Improvement Program (TIP).3.7.7 SANDWICH: ROUTE 6/ROUTE 130 RAMPSThe 2008 <strong>Transportation</strong> Safety Report included these ramps, on opposite sides of Route6, as two of three locations studied.The study recommends that the Massachusetts Department of <strong>Transportation</strong>/Highwaydivision investigate the installation of modern roundabouts at the Route 130/Route 6Westbound Ramp and the Route 130/Route 6 Eastbound Ramp. Commission staff findsmodern roundabouts as the safest solution to the crash problems at these twointersections.3.7.8 TRURO: ROUTE 6 SCHOOL ZONEIn 2009, a <strong>Transportation</strong> Safety Report was completed featuring this and two otherlocations.The study recommends that a private consultant has been commissioned by the <strong>Cape</strong><strong>Cod</strong> Commission with funds from the Unified <strong>Plan</strong>ning Work Program (UPWP) todevelop a plan for the Truro Central School’s installation of a school zone speed limitsign. The draft plan is included in this report’s appendix. With the created plan, ameeting with the Massachusetts Department of <strong>Transportation</strong>/ Highway DivisionDistrict 5 will be conducted to bring the project to completion.Beyond the installation of a school zone, the town may consider a year-round pedestriansignal if conflicts between pedestrians and vehicles are present during the summermonths. Beside Truro Central School, there is a youth baseball field that is usedthroughout the summer and school year. Furthermore, there is a restaurant serving pizzaand ice cream on the opposite side of Route 6. Safe crossing between these twoChapter 3: Safety <strong>Cape</strong> <strong>Cod</strong> <strong>Regional</strong> <strong>Transportation</strong> <strong>Plan</strong> | August 2011Page 322
destinations should be a priority to the town, especially during the summer season, whentraffic volumes increase substantially.Future plans may include a pedestrian refuge in the median of Route 6 to facilitate safecrossing. The following figure is a basic concept of how a refuge island could look onRoute 6 south of the Truro Central School.3.8 CONCLUSIONSafety is the highest priority goal of the <strong>Regional</strong> <strong>Transportation</strong> <strong>Plan</strong>. The <strong>Cape</strong>’stransportation system should ensure that travelers and their possessions will arrive attheir destinations unharmed and undamaged. Travelers should be educated regardingtransportation regulations and traffic laws, and these must also be enforced to preventthe improper use of the transportation system.The importance of safety requires a spectrum of strategies including education,enforcement, and engineering. Specific programs and projects, such as roadway andintersection improvements, will be further refined in the alternatives analysis chapter ofthis RTP.<strong>Cape</strong> <strong>Cod</strong> <strong>Regional</strong> <strong>Transportation</strong> <strong>Plan</strong> | August 2011Chapter 3: SafetyPage 323
Chapter 3: Safety <strong>Cape</strong> <strong>Cod</strong> <strong>Regional</strong> <strong>Transportation</strong> <strong>Plan</strong> | August 2011Page 324
<strong>2012</strong> REGIONAL TRANSPORTATION PLANChapter 4: SecurityEndorsedAugust 22, 2011
Chapter 4: Table of Contents4 Security ......................................................................................................... 3294.1 Emergency Traffic <strong>Plan</strong>ning ................................................................. 3294.2 Public <strong>Transportation</strong> Security ............................................................. 3334.3 Air Travel Security ................................................................................ 3364.4 Intelligent <strong>Transportation</strong> Systems ...................................................... 3364.5 Summary of <strong>Transportation</strong> Security Recommendations .................... 3374.6 Conclusion .............................................................................................. 337Chapter 4: List of FiguresFigure 1 - Evacuation Behavior Response Curves ............................................... 330Figure 2 - Location of Emergency Shelters ......................................................... 333<strong>Cape</strong> <strong>Cod</strong> <strong>Regional</strong> <strong>Transportation</strong> <strong>Plan</strong> | August 2011Chapter 4: Security
Chapter 4: Security <strong>Cape</strong> <strong>Cod</strong> <strong>Regional</strong> <strong>Transportation</strong> <strong>Plan</strong> | August 2011
4. SecurityConcern over security is made clear in the first goal of the <strong>Regional</strong> <strong>Transportation</strong> <strong>Plan</strong>:“Create a transportation system that provides safe travel options for people andfreight, and protects users from natural and external threats.”The transportation system must prepare for natural disasters, such as hurricanes orflood. Moreover, post-September 11 th , protecting users from external threats is also apriority, as indicated by the increased emphasis on security in federal and statetransportation regulations and guidelines. For these reasons, the 2010 <strong>Regional</strong><strong>Transportation</strong> <strong>Plan</strong> sets the goal of providing security to people and goods as theytravel.<strong>Transportation</strong> security includes that of the “users” (i.e., passengers and goods) as wellas that of the infrastructure itself (e.g., bus stations, bridges, etc.).4.1 EMERGENCY TRAFFIC PLANNINGThe most frequently identified security concern is the threat of a weather-related eventsuch as a hurricane. In many cases, the threatened population is a relatively smallpercentage overall and should seek local shelters per the direction of emergency safetyofficials. Most residents and visitors should seek “shelter in place,” a term that refers tostaying in homes or local shelters that are supplied with food, water, etc. The number ofpeople in threatened areas is a small percentage of most towns’ population. Regardless,people should heed warnings of public safety officials and evacuate accordingly.A danger occurs out of panic when vast numbers of people get into their automobileswith the idea that they should “evacuate,” clogging up the roadway network. Thesetraffic jams pose a threat to those who truly need to access the network (persons withhealth problems, injuries, etc.). In the event of a mass exodus from <strong>Cape</strong> <strong>Cod</strong> (due tomajor weather-related, radiation event, etc.), planning is underway by the BarnstableCounty Emergency <strong>Plan</strong>ning Committee, in coordination with the MassachusettsEmergency Management Agency and implementation organizations such as theMassachusetts State Police and MassDOT.<strong>Plan</strong>ning for large-scale traffic flows leaving <strong>Cape</strong> <strong>Cod</strong> requires coordination withneighboring regions. For example, routing <strong>Cape</strong> <strong>Cod</strong> traffic to I-195 West during an<strong>Cape</strong> <strong>Cod</strong> <strong>Regional</strong> <strong>Transportation</strong> <strong>Plan</strong> | August 2011Chapter 4: SecurityPage 329
impending hurricane may bring motorists closer to the hurricane’s landfall. Landfallpredictions always include some uncertainty, such as the exact time and path of impact.When the path of a storm is projected in a wide, imprecise area it can make theevacuation route itself a potentially hazardous area.One of the most difficult variables in planning for evacuations is human behavior, whichcan have the greatest impact on the availability of transportation capacity. The figurebelow illustrates this concept. The chart shows three curves representing the effect ofdifferent response rates versus the percentage of evacuation completed over time. Thischart was developed for an Alabama evacuation study and is meant to be illustrative ofthe issues facing emergency responders during the hours leading up to and during thistype of event.FIGURE 1 - EVACUATION BEHAVIOR RESPONSE CURVES(Source: Alabama Hurricane Evacuation Study - U.S. Army Corps of Engineers, May 2001)Emergency events requiring evacuation can be terrifying experiences, causing a range ofemotions and reactions from confusion to total panic. Reactions vary depending onmany different factors such as age, gender, and socioeconomic conditions. This variedreaction can influence the departure timing and loading levels of evacuation during anemergency event. This in turn impacts the design and implementation of policies andprocedures for effective evacuation (Source: “Heuristic Prioritization of EmergencyEvacuation Staging to Reduce Clearance Time,” Mitchell & Radwan, <strong>Transportation</strong>Research Board 2006 Annual Meeting CD).Chapter 4: Security <strong>Cape</strong> <strong>Cod</strong> <strong>Regional</strong> <strong>Transportation</strong> <strong>Plan</strong> | August 2011Page 330
One method that can be used to improve efficiency is staged evacuation. Stagedevacuation is best used where different parts of the road network may suffer differentlevels of severity over different time windows. By evacuating those populations in thenetwork as part of an optimized sequence, a staged evacuation strategy can best utilizeavailable roadway capacity, optimally distribute the total demand over the evacuationtime horizon, and thus minimize the network congestion level. A properly designedstaged evacuation strategy will significantly reduce congestion on the evacuationnetwork via a more uniform demand distribution over the allowable safety time window.It also allows responsible agencies to prioritize their limited resources in those areas thathave or will suffer the most severe damage (Source: “A Cell-Based Network OptimizationModel for Staged evacuation <strong>Plan</strong>ning Under Emergencies,” Liu, Lai, & Chang,<strong>Transportation</strong> Research Board 2006 Annual Meeting CD).The above-mentioned research has shown that an optimized staged evacuation strategycan effectively mitigate network congestion under various demand patterns, which isreflected in a shorter average travel time for evacuees. This is in comparison with a“simultaneous” – or uncontrolled evacuation.A “<strong>Cape</strong> <strong>Cod</strong> Emergency Traffic <strong>Plan</strong>” (ETP) has been developed by the MassachusettsState Police in cooperation with the Massachusetts Emergency Management Agency(MEMA) and several other agencies to facilitate the egress of a high volume of trafficfrom <strong>Cape</strong> <strong>Cod</strong> in the event of a hurricane, particularly during peak tourist season. Thedesign of the ETP is based upon the need to eliminate the causes of congestion in thearea of the Bourne and Sagamore Bridges and the main arteries leading up to them,Routes 6 and 28. Specific details of the plan may be included in the RTP followingconsultation with state officials. The following is a general outline of the plan’simplementation:As traffic levels build before the hurricane arrives, direct access to and from off-<strong>Cape</strong> locations will be restricted at the bridges in order to allow vehicles tocontinue north from the bridges unimpeded.At higher traffic levels, and as bridge flows warrant (e.g., lower demand at BourneBridge than at Sagamore Bridge), traffic on Route 6 destined for Routes 25 & 495would be diverted through the Massachusetts Military Reservation (MMR).When sustained winds reach 80 mph, the bridges will be closed and the motoristswill have the option of going to designated emergency parking areas in the MMRand to be shuttled to shelter in the MMR.The ready availability of advance information to the public is a vital componentnecessary to maximize the efficiency of the ETP. Traffic will flow only as fast as theslowest vehicles are traveling. The following measures are planned in order to provide a<strong>Cape</strong> <strong>Cod</strong> <strong>Regional</strong> <strong>Transportation</strong> <strong>Plan</strong> | August 2011Chapter 4: SecurityPage 331
high level of public knowledge regarding the various aspects and the changes in trafficpatterns that will be encountered during the ETP:SignageMassDOT will erect ETP signs giving advance notice of all detours and changes intraffic flow. The signs will include a radio frequency for ETP informationFM Radio BroadcastChanges in traffic patterns will be announced on WQRC (99.9 MHz). WQRC willcontinually play a variety of pre-recorded instructions geared to address the variousphases of the ETP.InternetDetour instructions and maps will be available on the Internet from the state policeweb site: It is extremely important that the public is informed of the need to evacuate only under aset of specific scenarios. For example, Hurricane events may only threaten certaincoastal areas. For those residents in the affected areas, public safety officials would likelydirect evacuees to local or regional shelters. By ‘sheltering in place’ or relocating to thenearest emergency shelter, impacts on the roadway network are minimized, freeing upcapacity for emergency responders. The map in the following figure indicates local andregional shelters throughout the County. Updated and higher-resolution maps areavailable on the <strong>Cape</strong> <strong>Cod</strong> Commission’s “Project Impact” website at the address listedhere:Chapter 4: Security <strong>Cape</strong> <strong>Cod</strong> <strong>Regional</strong> <strong>Transportation</strong> <strong>Plan</strong> | August 2011Page 332
FIGURE 2 - LOCATION OF EMERGENCY SHELTERS4.2 PUBLIC TRANSPORTATION SECURITYSecurity of public transportation systems has been regarded with greater importance inrecent years. The Federal Transit Administration (FTA) provides guidance and a widevariety of strategies to maintain and improve security. It is also important to note thatpublic transit may serve an important role in evacuation (e.g., moving residents fromnursing homes etc. to shelters). Also, verification and certification of public transitemployees in security procedures is important to assure response capability.Furthering its commitment to assist public transportation agencies in their efforts, FTAreleased its “Top 20 Security Program Action Items for Transit Agencies” in January2003. This list contains measures recommended by FTA for immediate considerationand implementation by transit agencies to improve both security and emergency<strong>Cape</strong> <strong>Cod</strong> <strong>Regional</strong> <strong>Transportation</strong> <strong>Plan</strong> | August 2011Chapter 4: SecurityPage 333
preparedness. The goal of this program is to ensure that the nation’s publictransportation systems:Are prepared for and well-protected against attacks;Respond rapidly and effectively to natural and human-caused threats anddisasters;Appropriately support the needs of emergency management and public safetyagencies; andCan be quickly and efficiently restored to full capability.The “Top 20” are divided into several categories as listed below. The <strong>Cape</strong> <strong>Cod</strong> RTA’sactions are listed in [brackets] for each item.Management and Accountability1. Written security program and emergency management plans are established.[The CCRTA has established its Safety and Security <strong>Plan</strong>, in coordination withexperts and the Barnstable County <strong>Regional</strong> Emergency <strong>Plan</strong>ning Committee.]2. The security and emergency management plans are updated to reflect antiterroristmeasures and any current threat conditions. [Over the past ten (10)years, the CCRTA has implemented and approved security on a number of fronts,including but not limited to secure door access, surveillance cameras, securityguards, and implementing policies and procedures. In addition, the CCRTA ispresently working with Anchor Group to update the security and emergencymanagement plan to reflect current threat conditions.]3. The security and emergency management plans are an integrated systemprogram, including regional coordination with other agencies, security designcriteria in procurements and organizational charts for incident command andmanagement systems. [The CCRTA is an active member and participant of theBarnstable County <strong>Regional</strong> Emergency <strong>Plan</strong>ning Committee, which suppliesemergency transportation services to the region and agencies.]4. The security and emergency management plans are signed, endorsed andapproved by top management. [The security and emergency management plansare signed, endorsed, and approved by the CCRTA Administrator, Thomas S.Cahir.]5. The security and emergency management programs are assigned to a senior levelmanager. [The security and emergency management programs are assigned toPaula George, Deputy Administrator and Matt Kolva, Facilities Project Manager.]6. Security responsibilities are defined and delegated from management through tothe front line employees. [Security responsibilities are defined and delegatedfrom management to the front line employees. Specifically, our managementcompany will ensure that employees will take Terrorist Activity Recognition andReaction courses, as part of their general training.]7. All operations and maintenance supervisors, forepersons, and managers are heldaccountable for security and emergency management issues under their control.[All aforementioned personnel are held accountable for security and emergencymanagement issues, as outlined in the CCRTA Safety and Security <strong>Plan</strong>.]Chapter 4: Security <strong>Cape</strong> <strong>Cod</strong> <strong>Regional</strong> <strong>Transportation</strong> <strong>Plan</strong> | August 2011Page 334
Security Problem Identification8. A threat and vulnerability assessment resolution process is established and used.[A threat and vulnerability assessment resolution process is established and used,as outlined in CCRTA’s Safety and Security <strong>Plan</strong>.]9. Security sensitive intelligence information sharing is improved by joining the FBIJoint Terrorism Task Force (JTTF) or other regional anti-terrorism task force;the Surface <strong>Transportation</strong> Intelligence Sharing & Analysis Center (ISAC); andsecurity information is reported through the National Transit Database (NTD).[The CCRTA has contracted with Be Safe through the Town of Barnstable’s PoliceDepartment, as well as the Town of Dennis’s Police Department to fulfill joiningthe FBI JTTF. In addition, security sensitive data is reported through NTD.]Employee Selection10. Background investigations are conducted on all new front-line operations andmaintenance employees. [The CCRTA performs Massachusetts CORIinvestigations on all CCRTA employees and contracted employees.]11. Criteria for background investigations are established. [The CCRTA performsMassachusetts CORI investigations, as established by the CCRTA New HirePolices.]Training12. Security orientation or awareness materials are provided to all front-lineemployees. [CCRTA operator provides all new employees with pre-servicetraining that includes Terrorist Activity Recognition and Reaction.]13. Ongoing training programs on safety, security and emergency procedures by workarea are provided. [The CCRTA is in the process of updating all policies andprocedures for all other personnel.14. Public awareness materials are developed and distributed on a system wide basis.[The CCRTA does maintain and distribute public awareness materials, such assignage and pamphlets (See Something? Say Something. Transit Watch) in theHyannis <strong>Transportation</strong> Center].Audits and Drills15. Periodic audits of security and emergency management policies and proceduresare conducted. [The CCRTA periodically audits the security and emergencymanagement policies and procedures.]16. Tabletop and functional drills are conducted at least once every six months andfull-scale exercises, coordinated with regional emergency response providers, areperformed at least annually. [The CCRTA’s participation in the BarnstableCounty <strong>Regional</strong> Emergency <strong>Plan</strong>ning Committee fulfills this requirement andour management company has incorporated functional drills and exercises intoits policies and procedures.]Document Control17. Access to documents of security critical systems and facilities are controlled. [TheCCRTA does regulate access to documents of security critical systems throughsecure door access, a recent implementation of a secure software system, and itsCOOP/Disaster recovery plan.]<strong>Cape</strong> <strong>Cod</strong> <strong>Regional</strong> <strong>Transportation</strong> <strong>Plan</strong> | August 2011Chapter 4: SecurityPage 335
18. Access to security sensitive documents is controlled. [The CCRTA does regulateaccess to security sensitive documents, as required by HIPAA requirements.]Access Control19. Background investigations are conducted of contractors or others who requireaccess to security critical facilities, and ID badges are used for all visitors,employees and contractors to control access to key critical facilities.Homeland Security20. Protocols have been established to respond to the Office of Homeland SecurityThreat Advisory Levels.More information on public transportation security is available from FTA at:4.3 AIR TRAVEL SECURITYSecurity for travel by air is a primary function of the <strong>Transportation</strong> SecurityAdministration (TSA). The TSA has been required to make a number of improvementsto aviation security. The improvements included that by November 19, 2002, screeningof individuals and property in the United States would be conducted by TSA employeesand companies under contract with TSA. Federal law also requires enhancedqualifications training and testing of individuals who perform screening functions. Itrequires that Federal law enforcement officers be present at screening locations. Moreinformation is available at:4.4 INTELLIGENT TRANSPORTATION SYSTEMSIntelligent <strong>Transportation</strong> Systems (ITS) technologies are applied to vehicles androadways that perform communications, data processing, traffic control, surveillance,navigation, sensing, and various other functions that aid in the management of thesecurity process. ITS elements, such as traffic cameras, signal preemption devices andVariable Message Boards (VMB), would provide timely responses for emergency vehiclesand the ability to monitor evacuations during times of natural, or other disasters.The Massachusetts Department of <strong>Transportation</strong>’s Traffic Operations Center (TOC) islocated in South Boston. The TOC’s primary mission is traffic incident managementthroughout the Commonwealth of Massachusetts. The MTOC is the headquarters for theapplication of Intelligent <strong>Transportation</strong> Systems (ITS) around the state. From theMTOC, reports on traffic incidents are relayed to the involved MassDOT district office,which assigns the necessary personnel and equipment, required to abate the incident.The TOC will be integrating information from the <strong>Cape</strong> <strong>Cod</strong> Canal Area IntelligentChapter 4: Security <strong>Cape</strong> <strong>Cod</strong> <strong>Regional</strong> <strong>Transportation</strong> <strong>Plan</strong> | August 2011Page 336
<strong>Transportation</strong> System (under design). The <strong>Cape</strong>’s system will include about 10adjustable (point-tilt-zoom) high definition cameras and supplemental speed detectorsand fixed-view webcams. This system will yield travel time and incident data to travelersand emergency responders.4.5 SUMMARY OF TRANSPORTATION SECURITYRECOMMENDATIONSRecommendations for transportation security may include:Incorporating intelligent transportation systems, such as real-time incidentdetection and dissemination via variable message signs and the internet, into theemergency response system;Fostering communication and cooperation between federal, state, and localagencies for the planning, practice, and implementation of emergency scenarioplans;Designating and indicate, through road signs, emergency evacuation routes, andshelters;Supporting enforcement of state and local traffic laws; andIncreasing surveillance and security efforts at transportation facilities throughout<strong>Cape</strong> <strong>Cod</strong>, such as the Hyannis <strong>Transportation</strong> Center, Falmouth Bus Depot,Woods Hole’s port facilities, park-and-ride lots, and <strong>Cape</strong> <strong>Cod</strong> Canal Bridges.4.6 CONCLUSIONSecurity is a high priority goal of the <strong>Regional</strong> <strong>Transportation</strong> <strong>Plan</strong>. The transportationsystem must be prepared for natural disasters, such as hurricanes. This RTP also addsemphasis on security from federal and state transportation regulations and guidelines.The most pressing security issue facing <strong>Cape</strong> <strong>Cod</strong> is the heavy volume of traffic departingduring weather events, such as impending hurricanes. The alternatives analysis chapterof this <strong>Plan</strong> will include the strategies needed (e.g., traffic flow improvements, traveldemand management) to address such a scenario.<strong>Cape</strong> <strong>Cod</strong> <strong>Regional</strong> <strong>Transportation</strong> <strong>Plan</strong> | August 2011Chapter 4: SecurityPage 337
Chapter 4: Security <strong>Cape</strong> <strong>Cod</strong> <strong>Regional</strong> <strong>Transportation</strong> <strong>Plan</strong> | August 2011Page 338
<strong>2012</strong> REGIONAL TRANSPORTATION PLANChapter 5: Bicycle & Pedestrian IssuesEndorsedAugust 22, 2011
Chapter 5: Table of Contents5. Bicycling and Pedestrian <strong>Plan</strong>ning .............................................................. 3455.1 Bicycle and Pedestrian <strong>Transportation</strong> ................................................ 3485.1.1 Multi-Use Paths ................................................................................. 3485.1.2 Bicycle Routes ................................................................................ 3645.1.3 Sidewalk Network .......................................................................... 3695.1.4 <strong>Cape</strong> <strong>Cod</strong> Pathways ....................................................................... 3705.1.5 Bicycle and Pedestrian Amenities ................................................. 3725.1.6 Bicycle and Pedestrian Facility Accessibility and Mobility ........... 3735.2 Bicycle and Pedestrian Route <strong>Plan</strong>ning Tools ...................................... 3745.2.1 “Route 6B” – Northside Bicycle Route ........................................... 3755.2.2 “Route 28B” – Southside Bicycle Route ......................................... 3815.3 Recent & Ongoing Bicycle/Pedestrian <strong>Plan</strong>ning Efforts ...................... 3865.3.1 Yarmouth Road Corridor Study .................................................... 3865.3.2 Harwich Bicycle/Pedestrian/Transit ............................................ 3885.3.3 Barnstable ...................................................................................... 3905.3.4 Dennisport Revitalization Master <strong>Plan</strong> ......................................... 3925.3.5 Orleans Route 28 Bike Path .......................................................... 3935.3.6 Wareham Bicycle Connections to <strong>Cape</strong> <strong>Cod</strong> ................................. 3955.4 CCNS Integrated Bicycle <strong>Plan</strong> for <strong>Cape</strong> <strong>Cod</strong> ........................................ 3965.4.1 Description of Project Types ......................................................... 3975.4.2 Improvements to Existing Facilities ............................................. 3995.4.3 New Facilities ................................................................................. 4145.4.4 Other Initiatives ............................................................................. 4375.5 Conclusion .............................................................................................. 451Chapter 5: List of FiguresFigure 1 - <strong>Cape</strong> <strong>Cod</strong> Bikeways Logo ..................................................................... 345Figure 2 - Shared Use Path Vision Map .............................................................. 347Figure 3 – Multi-Use Paths and Routes on <strong>Cape</strong> <strong>Cod</strong> ........................................ 349Figure 4 - <strong>Cape</strong> <strong>Cod</strong> Rail Trail Crossing at Main Street, Harwichport ................ 351Figure 5 - <strong>Cape</strong> <strong>Cod</strong> Rail Trail at Brackett Road, Eastham .................................. 351Figure 6 - Harwich-Chatham Rail Trail Extension at the Harwich-Chatham TownLine ................................................................................................................ 351Figure 7 - End of the Harwich-Chatham Rail Trail Extension At Crowell Rd.,Chatham ........................................................................................................ 351Figure 8 - Bicycle Roundabout on the <strong>Cape</strong> <strong>Cod</strong> Rail Trail, Harwich ................. 351Figure 9 - Southern-Side of the Canal Bicycle Path, East of Sagamore Bridge .. 352Figure 10 - Mainland-Side of the Canal Bicycle Path, East of Railroad Bridge .. 352Figure 11 - Shining Sea Bicycle Path at Ter Huen Drive, Falmouth ................... 352Figure 12 - Shining Sea Bicycle Path at Palmer Ave., Falmouth ......................... 352Figure 13 - Provincelands Trail at the Race Point Visitors Center, Facing West 353<strong>Cape</strong> <strong>Cod</strong> <strong>Regional</strong> <strong>Transportation</strong> <strong>Plan</strong> | August 2011Chapter 5: Bike & Pedestrian
Figure 14 - Setucket Road Path East of North Dennis Road, Looking East ....... 354Figure 15 - Setucket Road Path East of North Dennis Road, Looking West .......355Figure 16 - Map of Nickerson State Park Trails .................................................. 356Figure 17 - Nauset Trail from the Salt Pond Visitor’s Center Looking East ........ 357Figure 18 - Nauset Trail from Coastguard Beach Parking Lot in Eastham ......... 357Figure 19 - Head of the Meadow Trail at Head of the Meadow Road, Truro ..... 358Figure 20 - Looking North on Route 130 Bicycle Path at Lovell’s Lane, Mashpee...................................................................................................................... 359Figure 21 - Looking South on Route 130 Bicycle Path at Lovell’s Lane, Mashpee...................................................................................................................... 359Figure 22 - Old Townhouse Road Path East of West Yarmouth Rd., Yarmouth 360Figure 23 - Old Townhouse Road Path West of West Yarmouth Rd., Yarmouth...................................................................................................................... 360Figure 24 - Old Townhouse Road Path at the Bayberry Golf Course in Yarmouth...................................................................................................................... 360Figure 25 - Old Stage Road Path at the Service Road in Barnstable .................. 360Figure 26 - Forest Road Path, Looking North ...................................................... 361Figure 27 - Forest Road Path, Looking South ..................................................... 362Figure 28 - Signage on State Bicycle Route 1 ...................................................... 364Figure 29 - Claire Saltonstall Bikeway ................................................................ 365Figure 30 - Route 28 North of the Davis Straits Intersection, a Designated BicycleRoute in Falmouth ....................................................................................... 366Figure 31 - Low Volume Roads ............................................................................ 368Figure 32 - Sidewalk Network ............................................................................. 369Figure 33 - <strong>Cape</strong> <strong>Cod</strong> Pathways ........................................................................... 372Figure 34 - West Yarmouth Road crossing of the Old Townhouse Road Trail .. 374Figure 35 - Meetinghouse Road crossing of the Harwich-Chatham Extension ofthe <strong>Cape</strong> <strong>Cod</strong> Rail Trail ................................................................................ 374Figure 37 - Route "6B" – Northside Bicycle Route ............................................. 376Figure 38 - Potential Route "6B" in Sandwich ..................................................... 377Figure 39 - Potential Route "6B" in Barnstable ................................................... 377Figure 40 - Potential Route "6B" in Yarmouth ................................................... 378Figure 41 - Potential Route "6B" in Dennis ......................................................... 378Figure 42 - Potential Route "6B" in Brewster ..................................................... 379Figure 43 - Potential Route "6B" in Orleans ....................................................... 380Figure 45 - Potential Route "28B" in Falmouth ................................................... 381Figure 46 - Potential Route "28B" in Mashpee ................................................... 382Figure 47 - Potential Route "28B" in Barnstable ................................................ 383Figure 48 - Potential Route "28B" in Yarmouth ................................................. 383Figure 49 - Potential Route "28B" in Dennis ...................................................... 384Figure 50 - Potential Route "28B" in Harwich .................................................... 384Figure 51 - Potential Route "28B" in Chatham ................................................... 385Figure 52 - Yarmouth Road Proposed Cross Section (looking southerly) .......... 387Figure 53 - Yarmouth Road Recommended Concept <strong>Plan</strong> ................................. 387Figure 54 - Harwich Bicycle/Pedestrian/Transit Study Recommendations ...... 389Chapter 5: Bike & Pedestrian <strong>Cape</strong> <strong>Cod</strong> <strong>Regional</strong> <strong>Transportation</strong> <strong>Plan</strong> | August 2011
Figure 55 - Barnstable Bicycling & Pedestrian <strong>Plan</strong>ning ..................................... 391Figure 56 - Dennis Port <strong>Regional</strong> Bike Way <strong>Plan</strong> ............................................... 393Figure 57 - Orleans Route 28 Bikeway proposal ................................................. 394Figure 58 - Potential Wareham to <strong>Cape</strong> <strong>Cod</strong> Route ............................................ 395Figure 59 – CCNS Upper/Mid-<strong>Cape</strong> Mapped Projects ....................................... 447Figure 60 - CCNS Lower/Outer-<strong>Cape</strong> Mapped Projects ..................................... 448Figure 61 - CCNS Upper/Mid-<strong>Cape</strong> Priority Corridors ...................................... 449Figure 62 – CCNS Lower/Outer-<strong>Cape</strong> Priority Corridors .................................. 450Chapter 5: List of TablesTable 1 – Multi-Use Path and Route Mileage by Town and Region ................... 348Table 2 - Bicycle Path Mileage by Path ............................................................... 363Table 3 - List of Mapped Projects ........................................................................ 446<strong>Cape</strong> <strong>Cod</strong> <strong>Regional</strong> <strong>Transportation</strong> <strong>Plan</strong> | August 2011Chapter 5: Bike & Pedestrian
Chapter 5: Bike & Pedestrian <strong>Cape</strong> <strong>Cod</strong> <strong>Regional</strong> <strong>Transportation</strong> <strong>Plan</strong> | August 2011
5. Bicycling and Pedestrian <strong>Plan</strong>ningBicycles are a low cost, non-motorized form of transportation. Bicycle infrastructure andfacilities require smaller right-of-ways and less overall investment than roadways. Thereare three basic types of bicycle infrastructure: paths, lanes, and routes. Paths generallyhave their own separated right-of-way and follow certain standards for width, grade, andaccessibility. Bicycle lanes are separate lanes within roadways marked for bicycle use.There are currently no bicycle lanes on <strong>Cape</strong> <strong>Cod</strong>. Bicycle routes are roadways with wideshoulders that have been designated for bicycle use. Pedestrians can access shared usepaths and sidewalks. Pedestrian facilities support village centers and local businesses,and encourage travelers to walk instead of driving. According to the Rails to TrailsConservancy, bicycle and pedestrian facilities can increase property values and makeareas more attractive to new residents, businesses, and tourists.FIGURE 1 - CAPE COD BIKEWAYS LOGOBicycle planning efforts on <strong>Cape</strong> <strong>Cod</strong> have grown to such a degree that this RTP isdedicating a stand-alone chapter to the topic of Bicycle and Pedestrian issues –colloquially known as the <strong>Cape</strong> <strong>Cod</strong> Bike <strong>Plan</strong>. In 2010, the <strong>Cape</strong> <strong>Cod</strong> Commission reinitiatedthe program known as “<strong>Cape</strong> <strong>Cod</strong> Bikeways.” A cooperative effort including the<strong>Cape</strong> <strong>Cod</strong> National Seashore, the Commission is working with citizens and organizationsfrom across <strong>Cape</strong> <strong>Cod</strong> to create a <strong>Cape</strong>-wide network of bicycling routes. Whencomplete, <strong>Cape</strong> <strong>Cod</strong> Bikeways will extend from Provincetown to Falmouth and Bourne<strong>Cape</strong> <strong>Cod</strong> <strong>Regional</strong> <strong>Transportation</strong> <strong>Plan</strong> | August 2011Chapter 5: Bike & PedestrianPage 345
and provide connections between the Seashore and the <strong>Cape</strong>'s interior, between thepeninsula's historic landscapes and vibrant downtowns.<strong>Cape</strong> <strong>Cod</strong> Bikeways was initiated in the early 1990s and given a new focus in 2010 as partof the effort to update <strong>Cape</strong> <strong>Cod</strong>'s <strong>Regional</strong> <strong>Transportation</strong> <strong>Plan</strong>. The creation of a <strong>Cape</strong>widebicycling network is an ambitious undertaking that requires planning, mapping,community organizing, fundraising, special events, publicity, negotiation of land andeasements, clearing, and construction work.Further information is available on the internet:www.gocapecod.org/bikewaysThis chapter includes descriptions of the <strong>Cape</strong>’s existing bicycle and pedestrianinfrastructure, introduces tools for bike route planning, and a section of strategies toimprove biking on <strong>Cape</strong> <strong>Cod</strong>.The Commission is currently involved in bicycle/pedestrian planning efforts with thetowns of Sandwich and Harwich and other communities. It is anticipated thatrecommendations from these studies will yield projects for inclusion in the <strong>Regional</strong><strong>Transportation</strong> <strong>Plan</strong>. Summaries of some of these efforts are included in this chapter.A major transportation planning effort was undertaken by the <strong>Cape</strong> <strong>Cod</strong> NationalSeashore in partnership with the <strong>Cape</strong> <strong>Cod</strong> Commission. The effort included outreachthroughout Barnstable County to key stakeholders. The result is an “Integrated Bicycle<strong>Plan</strong> for <strong>Cape</strong> <strong>Cod</strong>/Bicycle Feasibility Study” released in 2010 and forms the basis ofrecommended projects included in this chapter.As an overall framework, the following figure represents an overall vision for bicycle pathconnections to and within <strong>Cape</strong> <strong>Cod</strong>. The segments shown in green represent existingbicycle paths. Orange line segments represent generalized routes; detailed alignmentsare to be defined. This figure represents the <strong>Cape</strong> <strong>Cod</strong> Commission’s vision forexpansion of the <strong>Cape</strong>’s bicycle path infrastructure.Chapter 5: Bike & Pedestrian <strong>Cape</strong> <strong>Cod</strong> <strong>Regional</strong> <strong>Transportation</strong> <strong>Plan</strong> | August 2011Page 346
FIGURE 2 - SHARED USE PATH VISION MAP<strong>Cape</strong> <strong>Cod</strong> <strong>Regional</strong> <strong>Transportation</strong> <strong>Plan</strong> | August 2011Chapter 5: Bike & PedestrianPage 347
5.1 BICYCLE AND PEDESTRIAN TRANSPORTATIONThe following subsections include text, figures and tables that define and describe thebicycle and pedestrian infrastructure of <strong>Cape</strong> <strong>Cod</strong>. This information forms the baselineof the existing system and helps planners identify gaps and opportunities to improvebicycling and walking on <strong>Cape</strong> <strong>Cod</strong>. Since this analysis was performed for the 2007 RTP,Multi-Use Path mileage increased <strong>Cape</strong>-wide by 16.2% and Bike Route mileage increasedby 4.2%.5.1.1 MULTI-USE PATHSTABLE 1 – MULTI-USE PATH AND ROUTE MILEAGE BY TOWN AND REGIONLENGTH IN MILESTown / RegionMulti-UsePathsBike RoutesAll <strong>Cape</strong> 97.4 347.1Upper <strong>Cape</strong> 30.9 173.9Mid <strong>Cape</strong> 19.8 78.4Lower <strong>Cape</strong> 27.3 55.5Outer <strong>Cape</strong> 19.4 39.3Bourne 11.5 27.7Sandwich 3.1 24.5Falmouth 10.7 96.3Mashpee 5.6 25.4Barnstable 6.0 48.9Yarmouth 3.9 15.3Dennis 9.9 14.2Harwich 8.7 20.0Chatham 3.3 13.0Brewster 13.4 11.3Orleans 1.9 11.2Eastham 7.2 0.4Wellfleet 2.8 10.2Truro 1.9 20.6Provincetown 7.5 8.1Chapter 5: Bike & Pedestrian <strong>Cape</strong> <strong>Cod</strong> <strong>Regional</strong> <strong>Transportation</strong> <strong>Plan</strong> | August 2011Page 348
FIGURE 3 – MULTI-USE PATHS AND ROUTES ON CAPE CODA multi-use path is a paved right of way, separate from roadways. A multi-use path(sometimes referred to as a bicycle path) is not a sidewalk. According to the AmericanAssociation of State Highway and <strong>Transportation</strong> Officials (AASHTO), bicycle paths<strong>Cape</strong> <strong>Cod</strong> <strong>Regional</strong> <strong>Transportation</strong> <strong>Plan</strong> | August 2011Chapter 5: Bike & PedestrianPage 349
should have a paved surface 8-10 feet wide, with a 4 inch wide center line. Shoulders of2-feet should be placed on either side of the path, with signage placed no closer than 3feet from the pavement. The cross slope of a bicycle path should be no more than 2%.Bicycle paths must also meet other standards for grading, accessibility, and roadwaycrossings that conform to AASHTO guidelines. There are many bicycle paths throughout<strong>Cape</strong> <strong>Cod</strong>. Some serve recreational needs, while others serve transportation needs.5.1.1.1 <strong>Cape</strong> <strong>Cod</strong> Rail TrailThe <strong>Cape</strong> <strong>Cod</strong> Rail Trail was constructed in the 1970s from the out of service <strong>Cape</strong> <strong>Cod</strong>Line rail right-of-way. Since 1991, an extension, two bridges over Route 6, and a tunnelhave been constructed. The Massachusetts Department of Conservation and Recreation(DCR) owns and maintains the Rail Trail.The Rail Trail runs from Route 134 in Dennis, just north of Great Western Road, toLeCount Hollow Road in Wellfleet. All along the trail are seating areas and trash cans.An extension of the trail, from Harwich to Chatham, was recently completed along theout-of-service Chatham Branch rail right-of-way. A bicycle roundabout was constructedat the intersection of the Rail Trail and the Harwich-Chatham extension. Currently, themain line of the Rail Trail is under renovation. The trail is being repaved and widened,with a grassy shoulder and more amenities. Phase 1 construction began in September2005 on the section from Dennis to Nickerson State Park in Brewster. This portion ofthe Rail Trail was completed and officially reopened on June 17, 2006. The section ofthe trail from Nickerson State Park to Wellfleet was completed in 2007. A furtherextension of the Rail Trail from Route 134 to Willow Street in Yarmouth is currentlybeing studied by the towns of Yarmouth and Dennis in consultation with Barnstabletown officials. The project would include several grade separated crossings and wouldincorporate the Old Townhouse Path. A further extension to the Hyannis<strong>Transportation</strong> Center is also under consideration and is a key recommendation of theYarmouth Road Corridor Study Task Force.The trail is currently 10 feet wide in the new section and 8.5 feet wide in the old sections.The main line is 21.9 miles long, with 45 roadway crossings. The Harwich-ChathamExtension is 6.2 miles long with 15 roadway crossings. DCR estimates that 400,000people use the rail trail annually. In addition, the rail trail is occasionally used foremergency vehicles. Given its length and location, the <strong>Cape</strong> <strong>Cod</strong> Rail Trail can be used tocommute within the Lower and Outer <strong>Cape</strong>.Chapter 5: Bike & Pedestrian <strong>Cape</strong> <strong>Cod</strong> <strong>Regional</strong> <strong>Transportation</strong> <strong>Plan</strong> | August 2011Page 350
FIGURE 4 - CAPE COD RAIL TRAIL CROSSINGAT MAIN STREET, HARWICHPORTFIGURE 5 - CAPE COD RAIL TRAIL ATBRACKETT ROAD, EASTHAMFIGURE 6 - HARWICH-CHATHAM RAIL TRAILEXTENSION AT THE HARWICH-CHATHAMTOWN LINEFIGURE 7 - END OF THE HARWICH-CHATHAMRAIL TRAIL EXTENSION AT CROWELL RD.,CHATHAMFIGURE 8 - BICYCLE ROUNDABOUT ON THE CAPE COD RAIL TRAIL, HARWICH<strong>Cape</strong> <strong>Cod</strong> <strong>Regional</strong> <strong>Transportation</strong> <strong>Plan</strong> | August 2011Chapter 5: Bike & PedestrianPage 351
5.1.1.2 <strong>Cape</strong> <strong>Cod</strong> Canal Bike PathsThe <strong>Cape</strong> <strong>Cod</strong> Canal Bike Paths run along both sides of the <strong>Cape</strong> <strong>Cod</strong> Canal. The ArmyCorps of Engineers owns and maintains the paths as frontage roads for the <strong>Cape</strong> <strong>Cod</strong>Canal. Both sides have benches and sitting areas, and are lit at night. The southern-sidepath is 6.5 miles long, 8 feet wide and has 2 roadway crossings. The mainland-side pathis 7 miles long, 8 feet wide and has 7 roadway crossings.FIGURE 9 - SOUTHERN-SIDE OF THE CANALBICYCLE PATH, EAST OF SAGAMORE BRIDGEFIGURE 10 - MAINLAND-SIDE OF THE CANALBICYCLE PATH, EAST OF RAILROAD BRIDGEFIGURE 11 - SHINING SEA BICYCLE PATH ATTER HUEN DRIVE, FALMOUTHFIGURE 12 - SHINING SEA BICYCLE PATH ATPALMER AVE., FALMOUTH5.1.1.3 Shining Sea Bike PathThe Shining Sea Bike Path, located in Falmouth, was constructed from a portion of theout-of-service Woods Hole Branch rail right-of-way. The first phase of construction,which runs from the Steamship Authority terminal in Woods Hole to the Falmouth BusDepot on Depot Street, was completed in 1976. The second phase, from Depot Street tothe southern crossing of Palmer Avenue, was recently completed. Phase 3 will extendChapter 5: Bike & Pedestrian <strong>Cape</strong> <strong>Cod</strong> <strong>Regional</strong> <strong>Transportation</strong> <strong>Plan</strong> | August 2011Page 352
the bike path from Palmer Avenue to just south of Old County Road. The trail iscurrently 4.6 miles long, 8.5 feet wide, with 11 roadway crossings.5.1.1.4 Provincelands Trails and Herring Cove Beach PathThe Provincelands Trails are the set of trails at Race Point in Provincetown. Theyprovide a path from near Route 6 to the Provincetown beaches and the ProvincetownMunicipal Airport. Travelers primarily use the Provincelands Trails for recreation andnot to commute. The paths were built in the 1960s before bicycle path standards weredeveloped. As a result they have many steep slopes, sharp curves and other hazards.Bicycle traffic is restricted to 10 MPH travel for safety. The Provincelands Trails areowned by the <strong>Cape</strong> <strong>Cod</strong> National Seashore. There are a total of 7.6 miles of bicycle paths,with a paved surface 8 feet wide, and 4 roadway crossings.The Herring Cove Beach Path serves as a connection between the Herring Cove Beachparking lot and Province Land Road in Provincetown. There is also a connection to theProvincelands Trails through the parking lot. The Herring Cove Beach Path is 0.1 mileslong, 8 feet wide, and has no roadway crossings.FIGURE 13 - PROVINCELANDS TRAIL AT THE RACE POINT VISITORS CENTER, FACING WEST5.1.1.5 Setucket Road and Dennis PathsSeveral paths exist in Dennis, creating a network for bicyclists and pedestrians. Thelongest path runs along Old Bass River Road from just south of Bob Crowell Road. The<strong>Cape</strong> <strong>Cod</strong> <strong>Regional</strong> <strong>Transportation</strong> <strong>Plan</strong> | August 2011Chapter 5: Bike & PedestrianPage 353
portion south of Mayfair Street is designated as Bicycle Route 1, part of the ClaireSaltonstall Bikeway. The Old Bass River Road Path is 3.1 miles long, 8.5 feet wide, andcontains 18 roadway crossings. Another nearby path is the Setucket Road Path, whichbegins in Yarmouth at Route 6A and ends west of Airline Road. The path crosses Route134 and Old Bass River Road. The western section of path, until Mayfair Road, is alsodesignated as Bicycle Route 1. The Setucket Road Path is 3.2 miles long, 8.5 feet wide,and contains 19 roadway crossings. The third path in Dennis is located on Old ChathamRoad between Old Bass River Road and Route 134. The Old Chatham Road Path is 0.7miles long, 8.5 feet wide, and contains 1 roadway crossing. All of these paths are ownedand maintain by the Town of Dennis except for the section of path in Yarmouth, which isowned and maintained by that town. They provide a network of bicycle transportationfor residents of Dennis. In total, these three paths are 7.0 miles long, and contain 38roadway crossings.FIGURE 14 - SETUCKET ROAD PATH EAST OF NORTH DENNIS ROAD, LOOKING EASTChapter 5: Bike & Pedestrian <strong>Cape</strong> <strong>Cod</strong> <strong>Regional</strong> <strong>Transportation</strong> <strong>Plan</strong> | August 2011Page 354
FIGURE 15 - SETUCKET ROAD PATH EAST OF NORTH DENNIS ROAD, LOOKING WEST5.1.1.6 Nickerson State Park TrailsSeveral bicycle paths are located within Nickerson State Park in Brewster. These pathsare used for recreation, offering a scenic ride through the park. They are owned by theMassachusetts Department of Environmental Management. There are a total of 6.8miles of bicycle path, with six roadway crossings.<strong>Cape</strong> <strong>Cod</strong> <strong>Regional</strong> <strong>Transportation</strong> <strong>Plan</strong> | August 2011Chapter 5: Bike & PedestrianPage 355
FIGURE 16 - MAP OF NICKERSON STATE PARK TRAILS(Source: Massachusetts Department of Conservation and Recreation)5.1.1.7 Nauset TrailThe Nauset Trail is located at the <strong>Cape</strong> <strong>Cod</strong> National Seashore in Eastham. It begins atRoute 6 and the Salt Pond Visitors Center and runs to Coastguard Beach. A connectionto the <strong>Cape</strong> <strong>Cod</strong> Rail Trail can be made via Bicycle Route 1. The Nauset Trail is owned bythe <strong>Cape</strong> <strong>Cod</strong> National Seashore and used primarily for recreation. The Nauset Trail is1.9 miles long, 8 feet wide, and has six roadway crossings.Chapter 5: Bike & Pedestrian <strong>Cape</strong> <strong>Cod</strong> <strong>Regional</strong> <strong>Transportation</strong> <strong>Plan</strong> | August 2011Page 356
FIGURE 17 - NAUSET TRAIL FROM THE SALT POND VISITOR’S CENTER LOOKING EASTFIGURE 18 - NAUSET TRAIL FROM COASTGUARD BEACH PARKING LOT IN EASTHAM5.1.1.8 Head of the Meadow TrailThe Head of the Meadow Trail is located in Truro in the <strong>Cape</strong> <strong>Cod</strong> National Seashore. Itruns from Head of the Meadow Road to High Head Road in Pilgrim Heights. The trail is<strong>Cape</strong> <strong>Cod</strong> <strong>Regional</strong> <strong>Transportation</strong> <strong>Plan</strong> | August 2011Chapter 5: Bike & PedestrianPage 357
owned by the <strong>Cape</strong> <strong>Cod</strong> National Seashore. It is used primarily for recreationalpurposes. The Head of the Meadow Trail is 1.9 miles long, 8.5 feet wide, and has noroadway crossings.FIGURE 19 - HEAD OF THE MEADOW TRAIL AT HEAD OF THE MEADOW ROAD, TRURO5.1.1.9 Route 28 PathThe Route 28 Path runs along Route 28 in Barnstable from Bearses Way to Old StageRoad. The path was constructed in 1980 by the Town of Barnstable as a safe route to themiddle and high schools. However, some sections of the path have not been designed tobicycle path standards, with narrow pavement, insufficient shoulders, and inadequateroadway crossings. The path is used primarily for commuting, as it connects residences,businesses, schools and other points of interest. The Route 28 Path is 2.5 miles long, 8feet wide, and has 28 roadway crossings.5.1.1.10 Route 130 PathThe Route 130 Path runs along Route 130 from Heritage Memorial Park to just north ofRoute 28 in Mashpee. The path is owned by the town of Mashpee. The Route 130 Pathis 2.4 miles long and has 11 roadway crossings.Chapter 5: Bike & Pedestrian <strong>Cape</strong> <strong>Cod</strong> <strong>Regional</strong> <strong>Transportation</strong> <strong>Plan</strong> | August 2011Page 358
FIGURE 20 - LOOKING NORTH ON ROUTE 130 BICYCLE PATH AT LOVELL’S LANE, MASHPEEFIGURE 21 - LOOKING SOUTH ON ROUTE 130 BICYCLE PATH AT LOVELL’S LANE, MASHPEE<strong>Cape</strong> <strong>Cod</strong> <strong>Regional</strong> <strong>Transportation</strong> <strong>Plan</strong> | August 2011Chapter 5: Bike & PedestrianPage 359
5.1.1.11 Old Townhouse Road TrailThe Old Townhouse Road Trail runs from near Station Avenue, along Old TownhouseRoad, behind the Bayberry Hills Golf Course, to Higgins Crowell Road in Yarmouth.Currently, the Rail Trail Extension Feasibility Study being performed by the towns ofYarmouth and Dennis is looking at using the Old Townhouse Road Trail right-of-way toconnect the Rail Trail to Hyannis and the Claire Saltonstall Bikeway. The OldTownhouse Road Trail is 2 miles long, 8 feet wide, and has three roadway crossings.FIGURE 22 - OLD TOWNHOUSE ROAD PATHEAST OF WEST YARMOUTH RD., YARMOUTHFIGURE 23 - OLD TOWNHOUSE ROAD PATHWEST OF WEST YARMOUTH RD., YARMOUTHFIGURE 24 - OLD TOWNHOUSE ROAD PATH ATTHE BAYBERRY GOLF COURSE IN YARMOUTHFIGURE 25 - OLD STAGE ROAD PATH AT THESERVICE ROAD IN BARNSTABLE5.1.1.12 Old Stage Road PathThe Old Stage Road Path begins at Route 149 in Barnstable, continues along the ServiceRoad, and then turns down Old Stage Road. The path ends at Oak Street, wheretravelers can continue by sidewalk to Route 28 and Centerville shopping areas. The pathChapter 5: Bike & Pedestrian <strong>Cape</strong> <strong>Cod</strong> <strong>Regional</strong> <strong>Transportation</strong> <strong>Plan</strong> | August 2011Page 360
was constructed in the early 1980s and is owned by the Town of Barnstable. It is usedfor both recreation and commuting, connecting West Barnstable and Centerville. TheOld Stage Road Path is 1.9 miles long, and has six roadway crossings.5.1.1.13 Forest Road PathThe Forest Road Path was built alongside Forest Road in 2006. It runs from OldTownhouse Road to Winslow Gray Road in Yarmouth. Continuing south on ForestRoad, users can reach South Yarmouth and Route 28. Although terminating at OldTownhouse Road, the Forest Road Path does not directly connect with the trail there.The Forest Road Path is 1.4 miles long, 8.5 feet wide, and has 8 roadway crossings.FIGURE 26 - FOREST ROAD PATH, LOOKING NORTH<strong>Cape</strong> <strong>Cod</strong> <strong>Regional</strong> <strong>Transportation</strong> <strong>Plan</strong> | August 2011Chapter 5: Bike & PedestrianPage 361
FIGURE 27 - FOREST ROAD PATH, LOOKING SOUTH5.1.1.14 Route 151 PathThe Route 151 Path runs along Route 151 from Mashpee Commons to Old BarnstableRoad in Mashpee. At Old Barnstable Road, 2 forks turn south to access Mashpee HighSchool. A third fork turns north and provides a connection to the Golf Club at Southport.The Route 151 Path is owned by the Town of Mashpee. The path is 1.1 miles long and has1 roadway crossing.Chapter 5: Bike & Pedestrian <strong>Cape</strong> <strong>Cod</strong> <strong>Regional</strong> <strong>Transportation</strong> <strong>Plan</strong> | August 2011Page 362
TABLE 2 - BICYCLE PATH MILEAGE BY PATHPath NameLengthin MilesWidthin FeetNumber ofRoadwayCrossings<strong>Cape</strong> <strong>Cod</strong> Canal Bike Path Mainland 7.04 8 7<strong>Cape</strong> <strong>Cod</strong> 6.52 8 2Total 13.57 8 9<strong>Cape</strong> <strong>Cod</strong> Rail Trail Main Path 21.9 8.5 / 10 45Harwich-Chatham Ext. 6.2 8.5 15Total 28.1 8.5 / 10 60Downtown Falmouth Path 0.2 - 0Forest Road Path 1.4 8.5 8Forestdale School Path 0.4 10Head of the Meadow Trail 1.9 8.5 0Hyannis <strong>Transportation</strong> Center Path 0.4 - 3Nauset Trail 1.9 8 6Nickerson State Park Trails 6.8 - 6Old Stage Road Path 1.9 - 6Old Townhouse Road Path 2.0 8 3Provincelands Trail 7.6 8 4Herring Cove Beach Path 0.1 8 0Route 130 Path 2.4 - 11Route 151 Path 1.1 - 1Route 28 Path 2.5 8 28Setucket Road and Dennis Paths 7.0 8.5 38Shining Sea Bikeway 4.6 8.5 115.1.1.15 Hyannis <strong>Transportation</strong> Center PathThe Hyannis <strong>Transportation</strong> Center Path runs from Route 28 in Barnstable to MainStreet Hyannis. The trail was built during the construction of the Hyannis<strong>Transportation</strong> Center in 2002. The Hyannis <strong>Transportation</strong> Center Path is 0.4 mileslong and has three roadway crossings.<strong>Cape</strong> <strong>Cod</strong> <strong>Regional</strong> <strong>Transportation</strong> <strong>Plan</strong> | August 2011Chapter 5: Bike & PedestrianPage 363
5.1.1.16 Forestdale School PathThe Forestdale School Path is located in Sandwich. It connects Route 130 to theForestdale School. Given that one can walk or bicycle from the nearby neighborhoods,the shared-use path serves the needs of students traveling to and from the school. TheForestdale School Path is 0.4 miles long, 10 feet wide, and has two roadway crossings.5.1.1.17 Downtown Falmouth PathThe Downtown Falmouth Path is located on Hamlin Street in Falmouth, betweenDillingham Avenue and Katherine Lee Bates Road. The bicycle path is owned by theTown of Falmouth. As a connection to downtown Falmouth, the path is used to accesstown hall, the library, and businesses. The Downtown Falmouth Path is 0.2 miles longand has no roadway crossings.5.1.2 BICYCLE ROUTESA bicycle route is any road, path, or trail that has been designated for bicycle use. Inmany cases, these are side streets with a low volume of traffic, or roads with wideshoulders. In the context of this section, only those bicycle routes located on roadwaysare discussed. Roadways designated for bicycle usage have the ability to link pathswhere bicycle rights-of-way are limited or unavailable. Many bicycle routes exist on<strong>Cape</strong> <strong>Cod</strong>, some of which are better signed than others. They allow bicycle users a widenetwork of travel across <strong>Cape</strong> <strong>Cod</strong>.5.1.2.1 Claire Saltonstall BikewayThe Claire Saltonstall Bikeway, or State Bicycle Route 1, is a seriesof bicycle paths and on-street routes that travel from Boston toboth Provincetown and Woods Hole. The bikeway starts on <strong>Cape</strong><strong>Cod</strong> at Route 3A in Bourne. It travels across the Sagamore Bridge,utilizing the bridge’s sidewalk. After the Sagamore Bridge, thebikeway splits. One branch travels south, parallel to Route 28 andeventually joining with the Shining Sea Bikepath, until reachingFIGURE 28 -Woods Hole. The main branch travels parallel to Route 6, joins SIGNAGE ON STATEwith the <strong>Cape</strong> <strong>Cod</strong> Rail Trail, and then continues north toBICYCLE ROUTE 1Provincetown. According to MassBike, the bikeway was mappedand established in 1978 by the Massachusetts General Court as a memorial to ClaireSaltonstall, who died in a bicycle-motor vehicle accident. The Claire Saltonstall Bikeway,indicated by a green oval, is one of the best signed bicycle routes on <strong>Cape</strong> <strong>Cod</strong>.According to MassBike, however, many signs have disappeared and the route isimpossible to follow without a map. The <strong>Cape</strong> <strong>Cod</strong> section of the Claire SaltonstallBikeway is 98.3 miles in length. The Bourne to Provincetown portion is about 75.4 mileslong, while the Bourne to Woods Hole portion is 22.9 miles long. Overall, the ClaireSaltonstall Bikeway is about 165 miles long.Chapter 5: Bike & Pedestrian <strong>Cape</strong> <strong>Cod</strong> <strong>Regional</strong> <strong>Transportation</strong> <strong>Plan</strong> | August 2011Page 364
FIGURE 29 - CLAIRE SALTONSTALL BIKEWAY<strong>Cape</strong> <strong>Cod</strong> <strong>Regional</strong> <strong>Transportation</strong> <strong>Plan</strong> | August 2011Chapter 5: Bike & PedestrianPage 365
5.1.2.2 State Bicycle RoutesMassGIS has also identified other bicycle routes throughout <strong>Cape</strong> <strong>Cod</strong>. Some examplesare Buck Island Road in Yarmouth, Great Western Road in Dennis and Harwich, orGreat Neck Road in. The <strong>Cape</strong> <strong>Cod</strong> Commission and AmeriCorps performed a survey ofmany of these roads in 2006. According to the survey, many of these roads are unsignedand some have sharp turns, no shoulders, or high traffic volumes. Evaluating existingbicycle routes, maintaining proper signage, and identifying possible new routes will helpto encourage more bicycle use on <strong>Cape</strong> <strong>Cod</strong>, both commuter and recreational. In total,there are 172.6 miles of roadway on <strong>Cape</strong> <strong>Cod</strong> designated as bicycle routes by theCommonwealth of Massachusetts.5.1.2.3 Falmouth Bicycle RoutesThe Town of Falmouth has designated many of their roads to be bicycle routes. Someexamples are Gifford Street, Sippewisset Road, Route 151, and Menauhant Road.According to a survey conducted by the <strong>Cape</strong> <strong>Cod</strong> Commission and AmeriCorpsperformed in 2006, many of these routes are signed and have sidewalks. In total, thereare 101.8 miles of roadway in Falmouth designated as bicycle routes.FIGURE 30 - ROUTE 28 NORTH OF THE DAVIS STRAITS INTERSECTION, A DESIGNATEDBICYCLE ROUTE IN FALMOUTHChapter 5: Bike & Pedestrian <strong>Cape</strong> <strong>Cod</strong> <strong>Regional</strong> <strong>Transportation</strong> <strong>Plan</strong> | August 2011Page 366
5.1.2.4 Low Volume RoadsBicyclists and pedestrians can utilize low volume roads with minimal automobileconflicts. <strong>Cape</strong> <strong>Cod</strong> has 462.8 miles of major roads with summer average daily volumes(ADT) of 5,000 vehicles per day or less, and 91.2 miles of major roads with 1,000vehicles per day or less. For reference, an ADT of 5,000 is equivalent to about onevehicle every seven seconds during daylight hours. An ADT of 1,000 is equivalent toabout 1 vehicle every 35 seconds during daylight hours. <strong>Cape</strong> <strong>Cod</strong> also has about 1,803.4miles of local paved roads that are suitable for safe bicycle and pedestrian traffic. Theseroads must be considered as part of the bicycle and pedestrian network, since tripsusually begin or end on side streets or in low traffic residential neighborhoods.<strong>Cape</strong> <strong>Cod</strong> <strong>Regional</strong> <strong>Transportation</strong> <strong>Plan</strong> | August 2011Chapter 5: Bike & PedestrianPage 367
FIGURE 31 - LOW VOLUME ROADSChapter 5: Bike & Pedestrian <strong>Cape</strong> <strong>Cod</strong> <strong>Regional</strong> <strong>Transportation</strong> <strong>Plan</strong> | August 2011Page 368
5.1.3 SIDEWALK NETWORKFIGURE 32 - SIDEWALK NETWORKSidewalks are paved surfaces, usually adjacent to roadways, which are designedprimarily for pedestrian usage. Sidewalks are typically 4 to 6 feet wide, made with slabs<strong>Cape</strong> <strong>Cod</strong> <strong>Regional</strong> <strong>Transportation</strong> <strong>Plan</strong> | August 2011Chapter 5: Bike & PedestrianPage 369
of concrete, paved asphalt, bricks, or other hard substances. The Americans withDisabilities Act requires sidewalk curb cuts to be large enough and shallow enough forwheelchair usage. Telephone poles, road signs, and other architectural barriers mustalso be removed in order to create an unobstructed path for walking. In Massachusetts,bicyclists may ride on sidewalks outside business districts unless otherwise prohibited bylocal ordinances.According to the 2008 Massachusetts Statewide Roadway Inventory File, there are 198.3miles of sidewalk located on <strong>Cape</strong> <strong>Cod</strong>. In addition, 26.42 miles of road have sidewalkson either side. These roads are concentrated primarily in Hyannis and downtownFalmouth. Of all paved roadways on <strong>Cape</strong> <strong>Cod</strong>, 5.1% have a sidewalk on at least one side.The average sidewalk width on <strong>Cape</strong> <strong>Cod</strong> by mileage is 4.4 feet.All of these figures illustrate pedestrian issues that must be addressed by any review ofbicycle and pedestrian transportation. Over 90% of <strong>Cape</strong> <strong>Cod</strong> roadways do not havesidewalks. While many of these streets are low volume and residential, some are not anddo warrant sidewalks. On a street without sidewalks, pedestrians must walk in theshoulders or on private property. This is not only less safe, but it restricts access for theelderly and disabled. Moreover, some sidewalks on <strong>Cape</strong> <strong>Cod</strong> have architecturalbarriers, such as telephone poles, located within the sidewalk. Obstructions like thesemake sidewalk navigation more difficult, especially for the disabled. Expanding theexisting sidewalk network and correcting improperly designed sidewalks will help toencourage pedestrian usage in, around, and between business and population centers.The sidewalk network also includes crosswalks. Crosswalks provide a safe means forpedestrians and other sidewalk users to cross roadways. All crosswalks are marked onthe roadway surface by white paint. Generally, crosswalks located on lower volumeroads have no traffic control devices, or a sign telling motorists to yield to pedestrians.However, many crosswalks have crossing signals that stop traffic, allow pedestrians tocross, and warn pedestrians when traffic is about to resume. Typically, crossing signalsare located with traffic signals at roadway intersections. However there are fourpedestrian signals on <strong>Cape</strong> <strong>Cod</strong> that are not located at a roadway intersection. Ensuringthat crosswalks are located at high pedestrian areas throughout <strong>Cape</strong> <strong>Cod</strong> will help toimprove safety as well as access. Access can also be improved by ensuring thatcrosswalks accommodate all users, including the elderly and disabled. Properly designedcurb cuts that are usable by wheelchairs, tones at crosswalk signals for the blind, andother amenities can significantly improve sidewalk access for the disabled.5.1.4 CAPE COD PATHWAYSThe Barnstable County Commissioners and the <strong>Cape</strong> <strong>Cod</strong> Commissionare working with citizens and organizations from across <strong>Cape</strong> <strong>Cod</strong> tocreate a <strong>Cape</strong>-wide network of walking trails. This network is called<strong>Cape</strong> <strong>Cod</strong> Pathways. When complete, <strong>Cape</strong> <strong>Cod</strong> Pathways will extendfrom Provincetown to Falmouth and Bourne and provide a connectionChapter 5: Bike & Pedestrian <strong>Cape</strong> <strong>Cod</strong> <strong>Regional</strong> <strong>Transportation</strong> <strong>Plan</strong> | August 2011Page 370
etween the Seashore and the <strong>Cape</strong>'s wooded interior, between the peninsula's historicvillages and remaining backcountry. Through the work of many volunteers and civic andenvironmental leaders, the Pathways east-west trail between Provincetown and theupper <strong>Cape</strong> is approximately now one-third dedicated.<strong>Cape</strong> <strong>Cod</strong> Pathways was initiated in November 1993. Since then the project has garneredwidespread support from the Barnstable County Assembly of Delegates, <strong>Cape</strong> <strong>Cod</strong>National Seashore, town officials, conservation organizations, businesses, and othergroups. Trail planning currently under way in <strong>Cape</strong> Communities will result in newlydedicated trails in the years ahead.The creation of a <strong>Cape</strong>-wide trail network is an ambitious undertaking that requiresplanning, mapping, community organizing, fundraising, special events, publicity,negotiation of land and easements, clearing, and construction work. More informationabout <strong>Cape</strong> <strong>Cod</strong> Pathways is available on the internet:www.capecodcommission.org/pathwaysMany of the trailheads have been mapped using Google mapping as shown in thefollowing figure. The green trailhead symbols represent <strong>Cape</strong> <strong>Cod</strong> pathways that areaccessible via public transportation. In addition to the larger goal of connecting trailsthroughout the <strong>Cape</strong>, natural attractions such as rivers, lakes and ponds are recognizedas important features for the Pathways program to provide access.<strong>Cape</strong> <strong>Cod</strong> <strong>Regional</strong> <strong>Transportation</strong> <strong>Plan</strong> | August 2011Chapter 5: Bike & PedestrianPage 371
FIGURE 33 - CAPE COD PATHWAYS5.1.5 BICYCLE AND PEDESTRIAN AMENITIESBeyond bicycle and pedestrian infrastructure, there are various amenities that addressthe needs of the traveler. Employers and businesses almost always have enoughautomobile parking. The same does not always hold true for bicycles. Bicycle racksallow the traveler to securely park their property without fearing that it will be stolen ordamaged. Water fountains, vending machines or nearby cafes provide the traveler withnourishment after their ride or walk. Public restrooms are also useful to bothpedestrians and bicyclists. Showers and locker facilities allow employees to change intoclean clothes. All of these amenities help to encourage non-motorized transportation.There are many amenities available to bicyclists and pedestrians on <strong>Cape</strong> <strong>Cod</strong>. TheHyannis <strong>Transportation</strong> Center has bicycle racks, public restrooms, water fountains,vending machines and other user amenities. In addition, the <strong>Cape</strong> <strong>Cod</strong> <strong>Regional</strong> TransitAuthority (CCRTA) offers bicycle racks with space for two bicycles on each CCRTA bus.Bicycle racks, restrooms, food, and other amenities are also available at the Exit 6 RestChapter 5: Bike & Pedestrian <strong>Cape</strong> <strong>Cod</strong> <strong>Regional</strong> <strong>Transportation</strong> <strong>Plan</strong> | August 2011Page 372
Area near the Barnstable Park-and-Ride Lot. The Steamship Authority Piers in Hyannisand Woods Hole offer restrooms and vending machines to customers who arrive bybicycle. Moreover, some employers offer bicycle and pedestrian amenities to theiremployees. According to the Massachusetts State Bicycle <strong>Plan</strong>, all such amenitiesaddress the “destination barriers” that bicyclists and pedestrians perceive, such as notbeing able to safely park their bicycle, showing up to work sweaty, or arriving at theirworkplace hungry and thirsty. By making non-motorized travel more attractive topotential users, more people will be inclined to ride a bicycle and walk to work.5.1.6 BICYCLE AND PEDESTRIAN FACILITY ACCESSIBILITY ANDMOBILITYNot everyone can ride a bicycle or walk as their primary mode of transportation. Usersmust live relatively close to where they work and shop in order to ensure a reasonabletravel time. The low density of <strong>Cape</strong> <strong>Cod</strong> development is in this way not conducive tobicycle travel. Moreover, a certain level of fitness is necessary to deal with the physicalexertion. On <strong>Cape</strong> <strong>Cod</strong>, where many residents are elderly, bicycling or walking may notbe practical for some travelers. Despite these barriers, there are many potential userswho can be targeted and encouraged to travel by bicycling or walking for its positiveenvironmental, physical, and economic benefits.Bicycle paths and routes can be made more accessible by ensuring that there areadequate entry points, safe roadway crossings, and proper signage. There is a tradeoffbetween entry points and roadway crossings, since roadways are often the place wherebicyclists enter a bicycle path. As the number of entry points increase, so do the numberof roadways bicyclists must cross in order to travel the path. Most <strong>Cape</strong> <strong>Cod</strong> bicyclepath-roadway crossings have yellow stanchions or gates that encourage bicyclists to stopand watch for vehicles before crossing. Two roadway crossings of the <strong>Cape</strong> <strong>Cod</strong> RailTrail in Harwich and Brewster have signals which warn oncoming vehicles whenbicyclists or pedestrians are approaching the intersection. Signage is also important toaccessibility, since it directs users to and along the path. Posted maps, street signs, andsigns listing local points of interest also help to direct travelers to their destinations. Byimplementing safety and signage measures such as these, bicycle and pedestrianfacilities can become more accessible to both first time and frequent users.<strong>Cape</strong> <strong>Cod</strong> <strong>Regional</strong> <strong>Transportation</strong> <strong>Plan</strong> | August 2011Chapter 5: Bike & PedestrianPage 373
FIGURE 34 - WEST YARMOUTH ROADCROSSING OF THE OLD TOWNHOUSE ROADTRAILFIGURE 35 - MEETINGHOUSE ROAD CROSSINGOF THE HARWICH-CHATHAM EXTENSION OFTHE CAPE COD RAIL TRAILBicycle paths on <strong>Cape</strong> <strong>Cod</strong>, with the exception of the Rail Trail and Shining Sea Bikepath,are generally too short, or the wrong location, to facilitate commuting. For example, theNauset Trail only conducts travelers from Route 6 to the <strong>Cape</strong> <strong>Cod</strong> National Seashore.The Forest Road Path does not continue all the way to the commercial activity on Route28. The key is to construct and connect paths in such a way as to link areas withresidential, commercial, and recreational uses. Otherwise, bicyclists will only be able touse bicycle paths as part of a larger bicycle route or for recreational purposes.Because bicycles are small and lightweight, they are very portable and easy to transferfrom mode to mode. Bus services, such as the CCRTA, Plymouth and Brockton, andPeter Pan / Bonanza Bus Lines, can accommodate cyclists with racks and storage areas.The Steamship Authority and other ferry services allow passengers to bring their bicyclesfor a fee. Special reservations can also be made with air carriers in order to transportbicycles. For this reason, bicycle transportation can help to connect users to other modesof transportation.5.2 BICYCLE AND PEDESTRIAN ROUTE PLANNING TOOLSA key component of <strong>Cape</strong> <strong>Cod</strong> Bikeways is to involve the public in identifying the “best”bicycle routes. The bikeways website includes links showing potential on-road bicycleroutes connecting major destinations on <strong>Cape</strong> <strong>Cod</strong> using Google's mapping service.Some non-roadway alternatives (such as the <strong>Cape</strong> <strong>Cod</strong> Canal multi-use path are notshown). The goal of establishing these routes is to provide for the "best" bicycle travelwithin, among, and through the attractive areas of the <strong>Cape</strong> while avoiding narrow andbusy roads such as Route 6A or Route 28.These alternatives provides direct access to major roads and do not require cyclists totravel more than about one and a half times the distance that would be traveled if thecyclist stayed on the major road. Additionally, the alternate route still provides ashowcase for the scenic and historic qualities of the area.Chapter 5: Bike & Pedestrian <strong>Cape</strong> <strong>Cod</strong> <strong>Regional</strong> <strong>Transportation</strong> <strong>Plan</strong> | August 2011Page 374
Town planning officials and concerned citizens are invited to comment and providesuggestions on specific routing. The mid-term goal is to provide online maps and onroadsignage to inform the public (both to help cyclists with way-finding and to alertmotorists of potential bicyclists). Longer-term, those segments of the routes that posethe greatest difficulty in safely biking then will be considered for improvements or for thedevelopment of other alternatives. Two basic regional routes are explored: a northsidebike route complementary to Route 6A connecting the <strong>Cape</strong> <strong>Cod</strong> Canal in Bourne toRock Harbor Road in Orleans (the so-called “Route 6B”); and, a southside bike routecomplementary to Route 28 connecting Woods Hole in Falmouth to Chatham Light (theso-called “Route 28B”).5.2.1 “ROUTE 6B” – NORTHSIDE BICYCLE ROUTEThe following figure shows a potential on-road bicycle route from the<strong>Cape</strong> <strong>Cod</strong> Canal area in Sandwich to the area including the EasthamRotary and Rock Harbor at the Orleans/Eastham town line. Some nonroadwayalternatives (such as the <strong>Cape</strong> <strong>Cod</strong> Canal multi-use path are notshown). The goal of establishing the Northside Route is to provide forthe "best" bicycle travel within, among, and through the areas north ofRoute 6 in the towns from Sandwich to Orleans - and to generally avoidthe narrow and busy Route 6A.FIGURE 36 -ROUTE "6B"LOGOThis alternative provides direct access to Route 6A and does not requirecyclists to travel more than about one and a half times the distance thatwould be traveled if the cyclist stayed on Route 6A. Additionally, thealternate route still provides a showcase for the scenic and historicqualities of the district.This figure was developed as part of the Route 6A Corridor Management <strong>Plan</strong> update,released by the Commission in 2010. The maps indicate useful alternatives to Route 6Aas well as connector routes. The sections of Route 6A identified in red indicate roadsegments where no viable alternative exists.Town-by-town maps showing the main “Route 6B” route are shown in subsequentfigures.<strong>Cape</strong> <strong>Cod</strong> <strong>Regional</strong> <strong>Transportation</strong> <strong>Plan</strong> | August 2011Chapter 5: Bike & PedestrianPage 375
FIGURE 37 - ROUTE "6B" – NORTHSIDE BICYCLE ROUTEChapter 5: Bike & Pedestrian <strong>Cape</strong> <strong>Cod</strong> <strong>Regional</strong> <strong>Transportation</strong> <strong>Plan</strong> | August 2011Page 376
FIGURE 38 - POTENTIAL ROUTE "6B" IN SANDWICH(Source: <strong>Cape</strong> <strong>Cod</strong> Commission, Google Maps)FIGURE 39 - POTENTIAL ROUTE "6B" IN BARNSTABLE(Source: <strong>Cape</strong> <strong>Cod</strong> Commission, Google Maps)<strong>Cape</strong> <strong>Cod</strong> <strong>Regional</strong> <strong>Transportation</strong> <strong>Plan</strong> | August 2011Chapter 5: Bike & PedestrianPage 377
FIGURE 40 - POTENTIAL ROUTE "6B" IN YARMOUTH(Source: <strong>Cape</strong> <strong>Cod</strong> Commission, Google Maps)FIGURE 41 - POTENTIAL ROUTE "6B" IN DENNIS(Source: <strong>Cape</strong> <strong>Cod</strong> Commission, Google Maps)Chapter 5: Bike & Pedestrian <strong>Cape</strong> <strong>Cod</strong> <strong>Regional</strong> <strong>Transportation</strong> <strong>Plan</strong> | August 2011Page 378
FIGURE 42 - POTENTIAL ROUTE "6B" IN BREWSTER(Source: <strong>Cape</strong> <strong>Cod</strong> Commission, Google Maps)<strong>Cape</strong> <strong>Cod</strong> <strong>Regional</strong> <strong>Transportation</strong> <strong>Plan</strong> | August 2011Chapter 5: Bike & PedestrianPage 379
FIGURE 43 - POTENTIAL ROUTE "6B" IN ORLEANS(Source: <strong>Cape</strong> <strong>Cod</strong> Commission, Google Maps)Chapter 5: Bike & Pedestrian <strong>Cape</strong> <strong>Cod</strong> <strong>Regional</strong> <strong>Transportation</strong> <strong>Plan</strong> | August 2011Page 380
5.2.2 “ROUTE 28B” – SOUTHSIDE BICYCLE ROUTEThe following figures show a potential on-road bicycle route fromthe Woods Hole in Falmouth to Chatham Light. The goal ofestablishing the Southside Route is to provide for the "best" bicycletravel within, among, and through the areas south of Route 6 in thetowns from Falmouth to Chatham - and to generally avoid thenarrow and busy Route 28.FIGURE 44 - ROUTE"28B" LOGOThis alternative provides direct access to Route 28 and does notrequire cyclists to travel more than about one and a half times thedistance that would be traveled if the cyclist stayed on Route 28.Additionally, the alternate route still provides a showcase for thescenic and historic qualities of the area.FIGURE 45 - POTENTIAL ROUTE "28B" IN FALMOUTH(Source: <strong>Cape</strong> <strong>Cod</strong> Commission, Google Maps)<strong>Cape</strong> <strong>Cod</strong> <strong>Regional</strong> <strong>Transportation</strong> <strong>Plan</strong> | August 2011Chapter 5: Bike & PedestrianPage 381
FIGURE 46 - POTENTIAL ROUTE "28B" IN MASHPEE(Source: <strong>Cape</strong> <strong>Cod</strong> Commission, Google Maps)Chapter 5: Bike & Pedestrian <strong>Cape</strong> <strong>Cod</strong> <strong>Regional</strong> <strong>Transportation</strong> <strong>Plan</strong> | August 2011Page 382
FIGURE 47 - POTENTIAL ROUTE "28B" IN BARNSTABLE(Source: <strong>Cape</strong> <strong>Cod</strong> Commission, Google Maps)FIGURE 48 - POTENTIAL ROUTE "28B" IN YARMOUTH(Source: <strong>Cape</strong> <strong>Cod</strong> Commission, Google Maps)<strong>Cape</strong> <strong>Cod</strong> <strong>Regional</strong> <strong>Transportation</strong> <strong>Plan</strong> | August 2011Chapter 5: Bike & PedestrianPage 383
FIGURE 49 - POTENTIAL ROUTE "28B" IN DENNIS(Source: <strong>Cape</strong> <strong>Cod</strong> Commission, Google Maps)FIGURE 50 - POTENTIAL ROUTE "28B" IN HARWICH(Source: <strong>Cape</strong> <strong>Cod</strong> Commission, Google Maps)Chapter 5: Bike & Pedestrian <strong>Cape</strong> <strong>Cod</strong> <strong>Regional</strong> <strong>Transportation</strong> <strong>Plan</strong> | August 2011Page 384
FIGURE 51 - POTENTIAL ROUTE "28B" IN CHATHAM(Source: <strong>Cape</strong> <strong>Cod</strong> Commission, Google Maps)<strong>Cape</strong> <strong>Cod</strong> <strong>Regional</strong> <strong>Transportation</strong> <strong>Plan</strong> | August 2011Chapter 5: Bike & PedestrianPage 385
5.3 RECENT & ONGOING BICYCLE/PEDESTRIAN PLANNINGEFFORTSThis section summarizes recent and ongoing bicycle & pedestrian planning effortsunderway by the <strong>Cape</strong> <strong>Cod</strong> Commission and/or bicycle planning groups in oradjacent to Barnstable County. More information is available for many of theseefforts at:www.gocapecod.org/bikeways5.3.1 YARMOUTH ROAD CORRIDOR STUDYYarmouth Road in Barnstable experiences significant vehicle queues during peak hoursof operation. The corridor is the primary access for some <strong>Cape</strong> towns to the <strong>Cape</strong> <strong>Cod</strong>Hospital. Seasonal and peak hour congestion often cause delays for emergency vehiclesen route to the Hospital. The intersection of Yarmouth Road and Route 28 in Barnstableis a known high crash location and is identified in the Hyannis Access Study as anintersection in need of improvements. Yarmouth Road serves as an important accessroad into Hyannis Center, which accommodates both commercial and businessdevelopment. Hyannis Center was recently approved as a Growth Incentive Zone. Aviable Yarmouth Road corridor is significant for many modes of transportation,including walking, biking, automobile, transit and rail. The Hyannis <strong>Transportation</strong>Center is located off Route 28, a short distance from the Yarmouth Road/Route 28intersection. The Yarmouth Road Corridor Study will examine each mode oftransportation (walking, biking, automobile, transit and rail). Information on the studyis available at:www.gocapecod.org/yarmouthroadAfter many months of review and public input, one concept has been recommended:Concept 1a. This concept includes a multi-use path (bike path) connecting the Hyannis<strong>Transportation</strong> Center to a point just south of Route 6. The towns of Yarmouth andDennis are currently planning to extend the existing <strong>Cape</strong> <strong>Cod</strong> Rail Trail just east ofWillow Street (south of Route 6).Concept 1a is a continuation of the four-lane divided Willow Street roadway thatcurrently exists near Route 6 Interchange 7 to the Route 28/Yarmouth Road intersectionin Barnstable and uses a westerly alignment at the Route 28/Yarmouth Roadintersection. The cross section and concept plan are shown in the following figures:Chapter 5: Bike & Pedestrian <strong>Cape</strong> <strong>Cod</strong> <strong>Regional</strong> <strong>Transportation</strong> <strong>Plan</strong> | August 2011Page 386
FIGURE 52 - YARMOUTH ROAD PROPOSED CROSS SECTION (LOOKING SOUTHERLY)FIGURE 53 - YARMOUTH ROAD RECOMMENDED CONCEPT PLAN<strong>Cape</strong> <strong>Cod</strong> <strong>Regional</strong> <strong>Transportation</strong> <strong>Plan</strong> | August 2011Chapter 5: Bike & PedestrianPage 387
5.3.2 HARWICH BICYCLE/PEDESTRIAN/TRANSITAs part of an effort to enhance the economic development of Saquatucket Harbor inHarwich Port, the Town of Harwich is seeking to provide safe and effective pedestrianand bicycle facilities between the <strong>Cape</strong> <strong>Cod</strong> Rail Trail/Old Colony Rail Trail and Route28, with a specific focus on a connection between Harwich Center and Harwich Port. Inaddition, the Town of Harwich is looking to provide safe pedestrian and bicycleconnections as well as shuttle bus service between Wychmere Harbor and SaquatucketHarbor. A <strong>Cape</strong> <strong>Cod</strong> Commission/Town of Harwich effort is underway to meet thefollowing goals:Identify safe and effective pedestrian and bicycle access between the <strong>Cape</strong> <strong>Cod</strong>Rail Trail/Old Colony Rail Trail and Route 28, with a specific focus on aconnection between Harwich Center and Harwich Port.Identify safe and effective pedestrian and bicycle access between Wychmere andSaquatucket Harbors along Route 28 that would intersect with a connection toHarwich Center.Identify the potential for shuttle bus service between Wychmere and SaquatucketHarbors.Coordinate with the <strong>Regional</strong> <strong>Transportation</strong> <strong>Plan</strong>/<strong>Cape</strong> <strong>Cod</strong> Bike <strong>Plan</strong>. A goal ofthis effort is to construct new bicycle/pedestrian facilities using available fundingsources source is the <strong>Cape</strong> <strong>Cod</strong> <strong>Transportation</strong> Improvement Program (TIP)administered by the <strong>Cape</strong> <strong>Cod</strong> Commission and funded by the MassachusettsDepartment of <strong>Transportation</strong> and Federal Highway Administration.Commission staff will work with the Town of Harwich to integrate thesebicycle/pedestrian efforts into the current update of the RTP.From public outreach to concerned citizens and input from town of Harwich officials, thefollowing figure includes a summary of recommended bicycle and pedestrianenhancements in the study area:Chapter 5: Bike & Pedestrian <strong>Cape</strong> <strong>Cod</strong> <strong>Regional</strong> <strong>Transportation</strong> <strong>Plan</strong> | August 2011Page 388
FIGURE 54 - HARWICH BICYCLE/PEDESTRIAN/TRANSIT STUDY RECOMMENDATIONS<strong>Cape</strong> <strong>Cod</strong> <strong>Regional</strong> <strong>Transportation</strong> <strong>Plan</strong> | August 2011Chapter 5: Bike & PedestrianPage 389
5.3.3 BARNSTABLEThe town of Barnstable has a comprehensive Open Space and Recreation <strong>Plan</strong>. The planis available from the Town of Barnstable’s website at:http://town.barnstable.ma.us/GrowthManagement/Comprehensive<strong>Plan</strong>ning/OSRP/default.aspAs part of this effort, town-wide mapping of existing and proposed improvements forbicycling & pedestrian accommodation are shown in the following figure:Chapter 5: Bike & Pedestrian <strong>Cape</strong> <strong>Cod</strong> <strong>Regional</strong> <strong>Transportation</strong> <strong>Plan</strong> | August 2011Page 390
FIGURE 55 - BARNSTABLE BICYCLING & PEDESTRIAN PLANNING<strong>Cape</strong> <strong>Cod</strong> <strong>Regional</strong> <strong>Transportation</strong> <strong>Plan</strong> | August 2011Chapter 5: Bike & PedestrianPage 391
5.3.4 DENNISPORT REVITALIZATION MASTER PLANThe Dennis Port Revitalization Master <strong>Plan</strong> reflects the cumulative efforts of over twohundred individuals and over two years of effort. Looking forward 50 years, this plan is aroad map and a critical resource for directing growth and rebuilding the heart of thecommunity. Under the leadership of the Dennis Port Revitalization Committee, and withneeded support from the Town of Dennis, this plan has taken shape. The RevitalizationMaster <strong>Plan</strong> illustrates physical solutions to Dennis Port’s existing challenges, as relatedto the ten topic areas:transportationpublic safetyeconomic developmentsocial servicesland usehousinghistoric heritagearts & culturealternative energystormwater & wastewaterWhere possible, physical solutions have been incorporated into the Master <strong>Plan</strong>. A linkto the Dennis Port planning website is available from:Implementation Strategies.www.gocapecod.org/bikewaysThe Dennis Port revitalization planning effort focused on three primary nodes:the historic Village Centerthe hotel resort area along Chase Avenuethe cottage colony resort area along Old Wharf RoadThe design team also looked at the Route 28 corridor, to suggest interventions that couldimprove the character of this important gateway. While the provision of bikeways is themost visible element in any bikeway network, bicyclists must also have safe andconvenient places to store their bicycles at a trip’s end. Thus, providing bicycle parkingand other “end-of trip” facilities is critically important in supporting bicycling as a viablemode of transportation. While parking solutions range from the basic bicycle rack tosemi-enclosed bicycle shelters to full bicycle stations all bicycle parking facilities shouldbe attractive and identifiable, space efficient and as close, if not closer, to the associateddestination than any automobile parking. The Bike Way <strong>Plan</strong> also outlines severallocations where the expansion of bicycle parking is needed for recreational andutilitarian use and is shown in the following figures:Chapter 5: Bike & Pedestrian <strong>Cape</strong> <strong>Cod</strong> <strong>Regional</strong> <strong>Transportation</strong> <strong>Plan</strong> | August 2011Page 392
FIGURE 56 - DENNIS PORT REGIONAL BIKE WAY PLAN5.3.5 ORLEANS ROUTE 28 BIKE PATHThe Town of Orleans recently completed a feasibility study for the creation of a safe andcontinuous bike and pedestrian facility that connects South Orleans to Orleans Center.Fay, Spofford, and Thorndike (FST) helped evaluate the Route 28 corridor and itspotential to host such a facility. They met with members of the District 5 office to fullyunderstand the challenges of constructing a facility of this type. At the completion of thestudy and after review and consideration of several off-road alternatives, the Townbelieves that the Route 28 corridor is the best option to connect the two villages. Thestudy found that a Route 28 facility would be the most accessible bike and pedestrianfacility and therefore serve the greatest number of residents and visitors. The followingfigure is a locus map showing select areas along the route that were examined closely.For each location, a conceptual cross section is included in the report showing both ashared use path and a side walk (some on either side of the road) to illustrate how it maywork within the context of the road and its layout. A complete version of the report isavailable here:www.town.orleans.ma.us/Pages/OrleansMA_<strong>Plan</strong>ning/bikefinal<strong>Cape</strong> <strong>Cod</strong> <strong>Regional</strong> <strong>Transportation</strong> <strong>Plan</strong> | August 2011Chapter 5: Bike & PedestrianPage 393
FIGURE 57 - ORLEANS ROUTE 28 BIKEWAY PROPOSALChapter 5: Bike & Pedestrian <strong>Cape</strong> <strong>Cod</strong> <strong>Regional</strong> <strong>Transportation</strong> <strong>Plan</strong> | August 2011Page 394
5.3.6 WAREHAM BICYCLE CONNECTIONS TO CAPE CODA Bicycle planning committee for Wareham is proposing a connection from downtownWareham to Buzzards Bay at the Route 6/28 crossing of Cohasset narrows. Informationis available from the Wareham Community Pathway website:http://www.warehambikepath.comThe following figure shows the potential alignment from Wareham to Buzzards’ Bay:FIGURE 58 - POTENTIAL WAREHAM TO CAPE COD ROUTE<strong>Cape</strong> <strong>Cod</strong> <strong>Regional</strong> <strong>Transportation</strong> <strong>Plan</strong> | August 2011Chapter 5: Bike & PedestrianPage 395
5.4 CCNS INTEGRATED BICYCLE PLAN FOR CAPE CODIn 2010, the <strong>Cape</strong> <strong>Cod</strong> National Seashore (CCNS) completed an Integrated Bicycle <strong>Plan</strong>(“Bicycle Feasibility Study”) for <strong>Cape</strong> <strong>Cod</strong>. This feasibility study was undertaken by theNational Park Service in partnership with the <strong>Cape</strong> <strong>Cod</strong> Commission to identifyimprovements necessary to develop an integrated bicycle network throughout <strong>Cape</strong> <strong>Cod</strong>.This approach will help to ensure an efficient, coordinated approach to addressingneeded bicycle network improvements.With active participation of <strong>Cape</strong> <strong>Cod</strong> Commission staff and many other stakeholders,the study helps lay the groundwork needed to improve bicycling conditions on <strong>Cape</strong> <strong>Cod</strong>by developing a comprehensive and connected bicycle network. Included are a list ofboth infrastructure improvements and programmatic initiatives to promote bicycling,enhance bicycle access and improve safety. This will help establish bicycling as a viabletransportation option while reducing dependence on automobile transportation. This isto be accomplished by creating an integrated, multimodal transportation environmentthroughout <strong>Cape</strong> <strong>Cod</strong>. The study established an approach to identifying opportunitiesfor projects and initiatives, and provides guidance on implementing them in an efficientand coordinated manner.The three primary goals of the CCNS study are:To integrate regional planning and the regional bicycle network with <strong>Cape</strong> <strong>Cod</strong>bicycle facilities and CCNS attractions.To identify projects to improve <strong>Cape</strong> <strong>Cod</strong> bicycle facilities and facilitateintegration with the regional bicycle trail network.To identify projects that would improve bicycle access to and within <strong>Cape</strong> <strong>Cod</strong>National Seashore (Seashore).Projects and CCNS priority corridors are presented in maps at the end of this section.Links to the complete text of the CCNS report will be made available at:http://www.nps.gov/cacoChapter 5: Bike & Pedestrian <strong>Cape</strong> <strong>Cod</strong> <strong>Regional</strong> <strong>Transportation</strong> <strong>Plan</strong> | August 2011Page 396
5.4.1 DESCRIPTION OF PROJECT TYPESThe projects proposed to enhance the bicycling environment on <strong>Cape</strong> <strong>Cod</strong> wereextremely varied in nature, ranging from programmatic initiatives such as education andoutreach efforts and maintenance plans to infrastructure projects providingimprovements to existing routes, as well as the construction of new facilities. Thephysical improvements themselves covered a broad spectrum of projects. They includedimproved signage, enhanced trail crossings at roadways, the creation of connector trails,and new facilities in corridors not currently served by bicycle routes or facilities. Threeprimary classifications were developed to categorize the proposed projects;improvements to existing facilities; new facilities; and other initiatives. These categoriesare described in more detail, as are the individual projects that were selected forinclusion in the study. Maps depicting the locations of the selected projects are includedin this chapter along with a table for cross reference. Projects proposing regionalcorridor improvements have been mapped, however short corridor improvements withan undefined route have not been mapped. Several projects proposed development ofroutes following general corridors. Such routes have been depicted on the maps usingbroad arrows and do not indicate specific or preferred alignments, nor do they reflectenvironmental constraints or sensitive areas that may need to be avoided.5.4.1.1 Improvements to Existing FacilitiesThe bicycling network on <strong>Cape</strong> <strong>Cod</strong> is comprised of many types of facilities of varyingconditions. Though many miles of bicycling routes and paths exist many have deficientconditions relating to safety or usability by less experienced bicyclists such as basicwayfinding and signage, especially for visitors that may not be familiar with the <strong>Cape</strong>.Additionally, access to trip generators such as neighborhoods, major destinations, towncenters, or commercial areas are often lacking. These elements would facilitate greaterutilization of the bicycling network for travel throughout <strong>Cape</strong> <strong>Cod</strong> and less reliance onautomobile travel. A number of proposed projects aim to improve the existing facilitieson the <strong>Cape</strong> and to make uniform the conditions experienced by bicyclists, whether inthe form of improved wayfinding signage, consistent pavement markings, improving onroadwayconditions along existing bike routes, or upgrading facility designs to currentstandards.5.4.1.2 New Facility ConstructionIn order to provide for complete mobility for nonmotorized users a variety of newconstruction projects are needed to extend existing facilities, connect existing facilities todestinations and localities, close gaps in the bicycle network on <strong>Cape</strong> <strong>Cod</strong>, and enhancesafety. This process has resulted in identifying many needed routes or facilities that willprovide safer, more comfortable bicycling conditions for on-roadway routes, extend orconnect facilities such as the <strong>Cape</strong> <strong>Cod</strong> Rail Trail extension and proposed spurs linking<strong>Cape</strong> <strong>Cod</strong> <strong>Regional</strong> <strong>Transportation</strong> <strong>Plan</strong> | August 2011Chapter 5: Bike & PedestrianPage 397
towns and destinations, and close gaps within the network by linking existing routes orfacilities.5.4.1.3 Other Initiatives – maintenance plans, new or revised programsand policies, outreach and educationThough a number of physical improvements have been identified to enhance and expandthe network of bicycle routes throughout the <strong>Cape</strong>, many opportunities exist to improvebicyclist safety and to encourage the use of bicycling both for recreation and as a viabletransportation option. Developing programmatic and policy elements will ensure acomfortable and consistent bicycling environment across the <strong>Cape</strong> for bicyclists ofvarying skills, abilities, and bicycling interests. Such programmatic elements will serve toaddress human factors, thereby creating a safer, more inviting bicycling environment,while also encouraging the use of a continually improving bicycle network as a means ofroutine travel throughout <strong>Cape</strong> <strong>Cod</strong> by both tourists and residents alike. Many of theseproposed projects will work in tandem with projects aimed at improving infrastructureby ensuring awareness of bicycling transportation and recreation options, enhancingoperational safety of bikeways and enhancing the utility of the bicycle network on <strong>Cape</strong><strong>Cod</strong>. This will make the bicycle network more useable by a variety of visitors andresidents, thereby alleviating the existing burden on the transportation network resultingfrom over-reliance on automobiles.5.4.1.4 Selected ProjectsThe following lists of projects reflect those selected through the process described inChapter 4 of the Feasibility Study. The sorting process did not assign a ranking orpriority, but rather categorized them according to the level of benefit and the barriers toimplementation. All proposed projects should be viewed as valid and potential projectsthat may be pursued for funding. Coordination between <strong>Cape</strong> <strong>Cod</strong> National Seashore, the<strong>Cape</strong> <strong>Cod</strong> Commission, and/or the respective municipality will need to coordinateselection and implementation of individual projects. A consolidated list of all proposedprojects is included in the full report available that will be available at:http://www.nps.gov/cacoEach of the 47 recommended projects listed here includes a basic project description,preliminary design concepts, a planning-level cost estimate, and recommendations forimplementation. Some projects have more detailed cost estimates as a result of greaterlevels of detail relating to alignments, the type of facility, proposed configurations, andtotal distance. However many projects are merely conceptual, identifying only a corridoror general route in need of improvement without specifying the project length, type orlevel of accommodation to be provided. Estimates for general conceptual projects onlyinclude unit costs for the different types of possible accommodations and alignmentsthat may be utilized.Chapter 5: Bike & Pedestrian <strong>Cape</strong> <strong>Cod</strong> <strong>Regional</strong> <strong>Transportation</strong> <strong>Plan</strong> | August 2011Page 398
The cost estimates were prepared in 2009/2010, based upon typical project costs in the<strong>Cape</strong> <strong>Cod</strong> region. Due to the variability of construction and materials costs over time, anappropriate inflation factor should be determined and applied when using theseestimates in future years.Each project will require varying levels of environmental compliance dependent uponthe agency undertaking it and the scope of the project. An NPS EnvironmentalScreening Form would be completed for any project arising from this study to determinethe level of environmental compliance required. Projects undertaken within <strong>Cape</strong> <strong>Cod</strong>National Seashore would require NEPA (National Environmental Policy Act) andpossibly MEPA (Massachusetts Environmental Policy Act) documents for environmentalclearance; however the specific level of required compliance would be determinedthrough the individual project scoping process. Projects developed by localities wouldcomply with applicable environmental clearance requirements, also to be determinedduring the project scoping process.The individual project descriptions included in this chapter are intended to providestakeholders with a resource to be used in developing project proposals and fundingrequests through a variety of sources. Conceptual details and planning level costestimates will provide a basis for further development of individual project scopes andproposals. A variety of funding opportunities exist, largely via state and federal grantprograms. Some of the funding sources available include the NPS Park Roads andParkways Program, <strong>Transportation</strong> Enhancement grants, Recreational Trails Program,Congestion Mitigation Air Quality, and several Federal Transit Administration programs,among others.5.4.2 IMPROVEMENTS TO EXISTING FACILITIESThe following is a list of sixteen projects proposing improvements to existing facilities.This list was developed through an extensive public participation process involving all 15<strong>Cape</strong> <strong>Cod</strong> towns and stakeholders including MassDOT. These projects are numbered5.2.1 through 5.2.16.Project 5.2.1: Design Alternatives for <strong>Cape</strong> <strong>Cod</strong> Rail Trail Extension toProvincetownProject Description – The existing <strong>Cape</strong> <strong>Cod</strong> Rail Trail (CCRT), which is maintainedby the Massachusetts Department of Conservation and Recreation, currently terminatesin South Wellfleet, just north of the National Seashore Park headquarters. Bicycle andpedestrian access to the remainder of the Outer <strong>Cape</strong> is largely limited to US Route 6, theprincipal arterial providing motor vehicle (and motor freight) access to this region of the<strong>Cape</strong>. The estimated 400,000 annual users of the CCRT therefore have no access to theOuter <strong>Cape</strong> and many of the attractions within the National Seashore. Extending theCCRT to Provincetown would provide the following benefits:<strong>Cape</strong> <strong>Cod</strong> <strong>Regional</strong> <strong>Transportation</strong> <strong>Plan</strong> | August 2011Chapter 5: Bike & PedestrianPage 399
Continuity in access to over 40 miles of the Outer <strong>Cape</strong> by bicyclists andpedestriansBicycle and pedestrian access to virtually all destinations and attractions within<strong>Cape</strong> <strong>Cod</strong> National SeashoreEnhanced safety by eliminating the need for bicyclists and pedestrians to travelalong Route 6 which has no accommodations for bikes or pedestrians.Provision of a transportation alternative that would facilitate nonmotorizedmobility and access to a significant number of Outer <strong>Cape</strong> destinations, therebyreducing congestion, parking demand, and the associated environmental andsensitive lands impacts.This project would include preparation of an environmental assessment (EA) inaccordance with the National Environmental Policy Act (NEPA) process that includes adescription of the proposed project; the reasonable alternatives under consideration; thesocial, economic and environmental impacts of the alternatives; mitigation measuresand a section on comments and coordination. The project will evaluate alternativealignments and their respective costs, impacts, and connections/ accessibility provided.Preliminary Design Concepts – The three alternative alignments and designconcepts include:Eastern alignmento approximately 20 mileso largely through the National Seashoreo consisting of both on-roadway and shared-use path segmentso primarily undeveloped and natural environmentsInterior, or Bay alignmento mostly on secondary roadway alignmentso via the towns and neighborhoods of Wellfleet, Truro, and Provincetowno primarily developed and largely residential) environmentsAbandoned railroad alignmento located along the western side of the Outer <strong>Cape</strong>o shared-use path with occasional road segmentso a mix of natural landscapes in the National Seashore and developed areasof North Truro and ProvincetownCost Estimate – Costs for 3 conceptual alignments Eastern Shore alignment: design cost $3,385,000 Interior, or Bay alignment: design cost $1,100,000 Rail alignment $2,911,000Design cost estimates at 17% of NET construction costsRecommendations for Implementation – The EA should be undertaken to fullydetermine the extent of all impacts associated with the three alternatives. A subsequentanalysis of the alternatives to determine which, if any of the three options are feasiblealong with costs associated with possible right of way acquisitions, and public inputChapter 5: Bike & Pedestrian <strong>Cape</strong> <strong>Cod</strong> <strong>Regional</strong> <strong>Transportation</strong> <strong>Plan</strong> | August 2011Page 400
should be undertaken to establish a preferred alignment. Mass DCR’s maintenanceresponsibility for the CCRT requires close coordination between the state and CCNS.Project 5.2.2: Wayfinding Signage and Pavement Markings on CCRTProject Description – With an estimated 400,000 users annually the <strong>Cape</strong> <strong>Cod</strong> RailTrail (CCRT) has the potential to serve as a significant alternative transportation facility,not merely a recreational route. Installation of consistent signage along the <strong>Cape</strong> <strong>Cod</strong>Rail Trail to include interpretive, directional, informational, and other wayfindingsignage is needed to both enhance the trail user experience as well as facilitate use of thetrail as a bicycle transportation corridor, especially by those that are not familiar withareas served by the facility. Additionally, improved pavement markings are needed,primarily at the 45 roadway crossings to enhance safety and communicate expectedbehaviors by both trail users and motorists at these conflict points. Motorist and trailuser expectations and actions are not consistent, in part due to trail and roadwaycrossing designs that are inadequate and design treatments that are inconsistent andoften don’t comply with the MUTCD (the Manual on Uniform Traffic Control Devices)regulations or AASHTO guidelines.Preliminary Design Concepts – The specific signage design and placement has to bedetermined, and avoidance of visual clutter is needed, however the primary informationthat needs to be considered for signage includes:• Trail amenities including rest rooms & emergency services• Historic resources• Beaches• National Seashore attractions• Town centers and commercial destinations including restaurants, lodging, retailshopping, bike shops• Distance signage (to destinations)• Connections to intermodal transportation facilities including bus and ferryterminals• Connections to other bicycle facilities & bike routes• Communicating mobility issues for access by different users (including ADAissues)• Safety information such as sand and other surface hazardsCost Estimate – <strong>Complete</strong> signage at $18,400 per mile:• $405,000.00 for the existing CCRT• $129,000.00 for the Old Colony extensionRecommendations for Implementation – This approach will facilitate addressingthe multiple locations that will be enhanced or addressed over time and in a phasedmanner, but this project provides a uniform protocol and design standards so thatconsistency is ensured.<strong>Cape</strong> <strong>Cod</strong> <strong>Regional</strong> <strong>Transportation</strong> <strong>Plan</strong> | August 2011Chapter 5: Bike & PedestrianPage 401
Sign design, content, placement standards, measures to avoid visual clutter, installationand maintenance polices, and other considerations need to be established and agreedupon by stakeholders and responsible parties prior to implementation. The partiesresponsible for installation and maintenance need to be apprised of protocols includingcoordination of responsibilities when multiple agencies are involved. This needs toinclude entities with roadway construction authority so that roadway projects impactingtrail crossings and intersections include appropriate and uniform design treatments andstandards, regardless of locality. As development and implementation of Intelligent<strong>Transportation</strong> Systems occurs wayfinding resources could be added such as locationspecificinformation via cell phone (based upon mile posts along bicycle routes and railtrails).Project 5.2.3: Intersection Improvements on Setucket Road PathProject Description – Intersection treatments along the Setucket Road and OldChatham Road Paths are inconsistent and lacking in conspicuous pavement markingsthat comply with national standards and design guidelines. Designed primarily as a sidepath, there is a resultant 38 roadway crossings in only 7 miles, and as a result a need forhigh visibility crosswalks and other pavement markings to communicate to motoristsand path users the presence of conflict points. Pavement markings and signage alsocommunicate appropriate actions at intersections for both motorists and path users.Additionally, access to the paths needs to be upgraded to provide curb ramps and ADAcompliantdetectable warning surfaces.Preliminary Design Concepts – High visibility crosswalks and improved signage andintersection treatments that are consistent with MUTCD and ADA standards andAASHTO design guidelines need to be selected to be applied uniformly along the facility.Consideration should also be given to evaluating the existing configuration andgeometrics for each of the intersections and changes made that will enhance safety. Thisreview should include issues such as sight distance, bollard placement, path width, angleof approach/crossing (skewed crossings), etc.Cost Estimate – Costs vary subject to existing conditions and improvements needed atindividual locations. Unit costs for typical crossing improvements are provided.• Residential Crossing – $1,500.00• Signalized Crossing – $70,000.00Assumes installation of signalized intersection on two-lane roadway with mast arms,signal heads, pedestrian signals, pavement markings, and appropriate pedestrianupgrades such as curb cuts and ADA curb ramps.Recommendations for Implementation – A complete review of the existingconditions should be conducted and documented and feedback from users should becollected to identify deficient conditions and desired improvements. Existing elementsthat are not consistent with MUTCD standards, AASHTO guidelines, and current bestChapter 5: Bike & Pedestrian <strong>Cape</strong> <strong>Cod</strong> <strong>Regional</strong> <strong>Transportation</strong> <strong>Plan</strong> | August 2011Page 402
practices should be considered for retrofits and improvements. Regulatory and advisorysignage should also be consistent with state law (such as the existing signage instructingbicyclists to dismount to cross intersections). A policy by which the selectedimprovements are installed and maintained needs to be established. Uniform designtreatments need to be consistently applied throughout the length of the facility.Project 5.2.4: Enhance Bicycling Conditions by Providing Paved ShouldersProject Description – Multiple locations were proposed for shoulder widening or theaddition of paved shoulders throughout <strong>Cape</strong> <strong>Cod</strong> along roads appropriate for on-roadbicycling in order to provide safer, more comfortable bicycling conditions while alsoreducing conflicts with motor vehicles. Routes favored by bicyclists and those roadwaysthat serve as connections to destinations, neighborhoods, and existing bicycle facilitiesshould be considered for shoulder improvements when traffic conditions merit. Addingpaved shoulders has additional benefits including pavement edge stabilization, theaddition of a recovery area which reduces roadway departure crashes, and a breakdownarea that allows disabled vehicles to be moved out of the travel lane, thereby mitigatingcongestion impacts from such incidents. These all result in safety, operational, andmaintenance benefits which yield long-term cost savings.Preliminary Design Concepts – Widening or the addition of paved shoulders shouldconsider the existing roadway geometrics. In order to be useful for bicycle travelshoulders and the adjacent travel lane need to be of adequate widths to provide a degreeof separation between the two modes; otherwise safety can be impaired by invitingmotorists to pass too closely to bicyclists that attempt to hug the outside edge of theroadway. In general a four foot shoulder is desirable to provide adequate operatingspace for a bicyclist while allowing motorists unimpeded travel within the adjacent lane.On roads with curb and gutter, the gutter pan and the longitudinal joint effectivelyreduces the useable width of the shoulder and consideration needs to be given to thepaved width of the shoulder exclusive of the gutter pan.Cost Estimate – On-road improvements, unit costs per mile:• Widening to add shoulders/bike lanes – $501,600.00Assumes adding shoulders along both sides of the road.Recommendations for Implementation – A protocol for identifying andprioritizing roads that will receive shoulder improvements needs to first be established.Limited resources dictate that shoulder improvements need to be made to roads wherethe benefits are the most significant and needed. Conditions to be considered shouldinclude:• Roads already heavily used by bicyclists• Designated bike routes with unimproved conditions• Roads connecting to destinations or bicycle facilities• Roads that establish a network or close a network gap• Motor vehicle and truck traffic volumes<strong>Cape</strong> <strong>Cod</strong> <strong>Regional</strong> <strong>Transportation</strong> <strong>Plan</strong> | August 2011Chapter 5: Bike & PedestrianPage 403
• Possible alternate routes (that are more suitable or which can be improved at alower cost)• Existing right of way• Need for relocation of ditches (trench widening or wedging )• Concurrency (opportunities to include shoulders as part of planned orprogrammed road projects)• Coordination across jurisdictions for route continuityFollowing the identification of candidate roads opportunities should be sought to beginimplementing improvements through coordination with other construction andmaintenance projects. Policies and procedures should be established to ensure thatconstruction and maintenance projects determine whether a road is listed as a priorityroute for paved shoulders and then scoped to include the improvements. Routinepavement overlay and resurfacing projects should include shoulder paving for theidentified routes. Consideration should be given to establishing a goal of spending a setpercentage of maintenance and/or paving funds on adding shoulders for bicycleimprovements. Maintenance needs to be considered so that the functionality ofshoulders for bicycling purposes is retained as the natural sweeping action of vehiclesoften results in debris accumulating in the untraveled shoulder.Project 5.2.5: Identify Possible Sidewalks and Pedestrian Crossings nearBrackett Road & Route 6Project Description – Brackett Road in Eastham intersects with the <strong>Cape</strong> <strong>Cod</strong> RailTrail and connects a largely residential area east of the trail to a commercial center at theintersection with Route 6, approximately ¼ mile to the west of the trail. Somepedestrian improvements are partially constructed, however further funding is neededfor completion. Additional sidewalks and pedestrian crossings need to be identified anddesigned to develop a complete network of pedestrian facilities to provide access andimprove safety within this corridor.Preliminary Design Concepts – Sidewalks should be provided to establish linkagesbetween the commercial trip generators along Route 6 with the <strong>Cape</strong> <strong>Cod</strong> Rail Trail andthe residential neighborhoods accessed via Brackett Road. Depending upon trafficvolumes, speeds, and location of pedestrian trip generators, sidewalks should beconsidered along both sides of the street. Appropriate marked crosswalks and signage,consistent with the roadway geometrics and existing traffic patterns should be installedat intersections where the heaviest pedestrian movements are likely to occur. Additionalpedestrian safety countermeasures should be considered where appropriate.Cost Estimate – Sidewalks and crossing improvements, unit costs:• 5’ Sidewalks, bituminous, both sides of street – $120.00/linear foot• 5’ Sidewalks, concrete, both sides of street – $140.00/linear foot• Marked Crossing – $1,500.00• Signalized Crossing – $70,000.00Chapter 5: Bike & Pedestrian <strong>Cape</strong> <strong>Cod</strong> <strong>Regional</strong> <strong>Transportation</strong> <strong>Plan</strong> | August 2011Page 404
Assumes installation of signalized intersection with mast arms, signal heads, pedestriansignals, pavement markings, and appropriate pedestrian upgrades such as curb cuts andADA curb ramps.Recommendations for Implementation – A gap analysis should be undertaken toidentify and prioritize sidewalks and crossings needed to develop a complete networkwhich integrates the existing pedestrian infrastructure (such as the CCRT) with thesurrounding pedestrian trip generators including both residential and commercialorigins and destinations. Safety countermeasures should be considered for locationswhere potential exists for vehicle/pedestrian collisions, primarily at the intersection withthe CCRT and along Route 6 where pedestrian travel may present multiple conflictpoints with vehicle ingress and egress. Access management should be considered atthese locations, and improvements along Route 6 should also seek to improve access totransit stops.Project 5.2.6: Western Extension of CCRT through Independence ParkProject Description – Located along Route 6 in Barnstable, Independence Park, acommercial and industrial business center, lies just to the north of the Hyannis<strong>Transportation</strong> Center and the Barnstable Municipal Airport. Providing a connection tothe CCRT would facilitate greater utilization of the trail for bicycle commuting trips,especially if coordinated with access to the Hyannis <strong>Transportation</strong> Center. Multimodalcommute options would be greatly expanded as a result.Preliminary Design Concepts – The extension should utilize current designguidelines for shared-use paths and rail-trails with a minimum 10’ paved trail width. Awider paved surface should be considered along segments that are envisioned to havehigher volumes of users. Current practices also consider separation of bicycle andpedestrian modes by providing a wider trail surface and designation of walking andbicycling lanes to make for a safer and more enjoyable environment along segmentswhere there is considerable mixing of bike and pedestrian traffic. The proposed westernextension of the CCRT linking the existing terminus in South Dennis to the Hyannis<strong>Transportation</strong> Center would likely utilize an alignment to the east of the regional airportthat is proximate to Independence Park. A short spur, likely passing to the north of theairport would be needed to provide a connection between the business park and theextension of the CCRT. The actual alignment needs to be determined.Cost Estimate – Shared-use path, unit costs per mile along varying alignments:• Adjacent to roadway with utility relocation – $765,600.00• Along new alignment – $871,200.00• Existing corridor (minor grading/clearing) – $792,000.00Recommendations for Implementation – This connection needs to be coordinatedwith planning or construction related to the western extension of the <strong>Cape</strong> <strong>Cod</strong> RailTrail, most notably the extension to the Hyannis <strong>Transportation</strong> Center (Project 5.2.7)<strong>Cape</strong> <strong>Cod</strong> <strong>Regional</strong> <strong>Transportation</strong> <strong>Plan</strong> | August 2011Chapter 5: Bike & PedestrianPage 405
which would result in a CCRT alignment that is proximate to this location. Additionally,Project 5.2.13 should be considered for coordination since it may facilitate a logicaltermini for either a future extension of an off-roadway alignment linking the CCRT to the<strong>Cape</strong> <strong>Cod</strong> Canal Bikeway, or at least serving to access an on-roadway route.Project 5.2.7: Western Extension of CCRT to Hyannis <strong>Transportation</strong> CenterProject Description – The current terminus of the <strong>Cape</strong> <strong>Cod</strong> Rail Trail in SouthDennis lies approximately 8 miles to the east of the Hyannis <strong>Transportation</strong> Center.Connecting the CCRT to Hyannis is significant in that it is an urban center of <strong>Cape</strong> <strong>Cod</strong>with considerable population and commercial activity, and also the site of the <strong>Cape</strong>’sprimary multimodal center providing rail, air, bus, and ferry service. The CCRT servesas one of <strong>Cape</strong> <strong>Cod</strong>’s primary bicycle facilities and by providing direct access to thetransportation center bicycling can become a more integrated mode in the <strong>Cape</strong>’stransportation network and linking the center and Hyannis to multiple communities anddestinations in the Mid and Lower <strong>Cape</strong>.Approximately 3.3 miles of the proposed extension are currently programmed,continuing along the existing abandoned rail bed. The proposed alignment could utilizethe existing two mile long Old Townhouse Road Trail needing only to close a small .15mile gap between those two alignments. Another 1.25 mile section of the Old TownhouseRoad Trail is currently programmed, which would extend the CCRT to Higgins CrowellRoad leaving approximately a 2.5 mile gap to connect to the Hyannis <strong>Transportation</strong>Center. The most likely alignment from that point would continue along the OldTownhouse Road corridor and then in the proximity of Yarmouth Road which providesaccess the Hyannis <strong>Transportation</strong> Center. The proposed extension runs primarilythrough Yarmouth, with short segments at either termini in Dennis and Barnstable.Preliminary Design Concepts – The extension should utilize current designguidelines for shared-use paths and rail-trails with a minimum 10’ paved trail width. Awider paved surface should be considered along segments that are envisioned to havehigher volumes of users. Current practices also consider separation of bicycle andpedestrian modes by providing a wider trail surface and designation of walking andbicycling lanes to make for a safer and more enjoyable environment along segmentswhere there is considerable mixing of bike and pedestrian traffic. Utilization of anyexisting path segments should consider retrofitting to ensure continuity in design,including intersection treatments.Cost Estimate – Shared-use path cost:• utilizing combination of alignments noted – $5,200,800.00Recommendations for Implementation –The proposed corridor and specificalignments have undergone conceptual design but it may be necessary to determinepotential gaps, notably if any existing facilities are to be used. Further, if existingfacilities are to be utilized and integrated into the extension they need to be evaluated forChapter 5: Bike & Pedestrian <strong>Cape</strong> <strong>Cod</strong> <strong>Regional</strong> <strong>Transportation</strong> <strong>Plan</strong> | August 2011Page 406
etrofits or improvements to provide consistency and continuity with the designstandards employed for the remainder of the CCRT. An environmental assessment isneeded before final design and construction can proceed. The extension should also becoordinated with planning or construction related to Projects 5.2.6 and 5.2.13.Project 5.2.8: Connect Chatham Municipal Parking Lot and Old Colony RailTrail and Old Queen Anne Road via Route 137 ImprovementsProject Description – The Old Colony Rail Trail in Chatham lies along the north sideof Route 28 with a trailhead located near the intersection of Route 28 (Main Street) andRoute 137 (Meetinghouse Road). Access north to East Chatham and Brewster is neededand is proposed via roadway improvements including the addition of 4’ paved shouldersalong approximately 1.25 miles of Meetinghouse Road between Main Street and QueenAnne Road.Preliminary Design Concepts – Roadway improvements along Route 137 to provide11’ travel lanes and 4’ paved shoulders. On-roadway improvements and accommodationsare needed to provide direct, comfortable bicycle routes. Shoulder widening, pavementmarkings, signage, intersection enhancements, and other safety countermeasures alongwith wayfinding measures would provide a convenient and comfortable route for cyclistsof varying abilities. Specific design treatments should be sensitive to the particularneeds and context of each road where improvements are made.Cost Estimate – On-road improvements, unit costs per mile:• Signing and striping – $10,560.00• Widening to add shoulders/bike lanes – $501,600.00Assumes adding shoulders, signs, and pavement markings along both sides of the road.Recommendations for Implementation – Opportunities should be sought to beginimplementing improvements through coordination with other construction andmaintenance projects. Routine pavement overlay and resurfacing projects shouldinclude shoulder paving for this route if adequate right of way exists or can be obtained.Maintenance needs to be considered so that the functionality of shoulders for bicyclingpurposes is retained since the natural sweeping action of vehicles often results in debrisaccumulating in the untraveled shoulder.Project 5.2.9: Extension of the Old Colony Rail Trail from Volunteer Park toSchoolhouse PondProject Description – The existing Bicycle Spur from Volunteer Park is called the OldColony Rail Trail and also the Chatham Spur. Currently the Chatham Spur ends inChatham and utilizes a brief on-road alignment in the vicinity of the airport. In order toconnect this trail to Schoolhouse Pond, an extension of the multi-use trail is required fora distance of approximately 3000 feet. Also, a “Share the Road” bike route or bike lane is<strong>Cape</strong> <strong>Cod</strong> <strong>Regional</strong> <strong>Transportation</strong> <strong>Plan</strong> | August 2011Chapter 5: Bike & PedestrianPage 407
equired on Old Queen Anne Road for a distance of 4000 feet to make final connectionsto Sam Ryder Road, the access road to Schoolhouse Pond.Preliminary Design Concepts – The extension should utilize current designguidelines for shared-use paths and rail-trails with a minimum 10’ paved trail width. Awider paved surface should be considered along segments that are envisioned to havehigher volumes of users. Current practices also consider separation of bicycle andpedestrian modes by providing a wider trail surface and designation of walking andbicycling lanes to make for a safer and more enjoyable environment along segmentswhere there is considerable mixing of bike and pedestrian traffic.Cost Estimate – Shared-use path, unit costs per mile along varying alignments:• Adjacent to roadway with utility relocation – $765,600.00• Along new alignment – $871,200.00• Existing corridor (minor grading/clearing) – $792,000.00• Along abandoned RR bed – $660,000.00On-road improvements, unit costs per mile:• Signing and striping – $10,560.00• Widening to add shoulders/bike lanes – $501,600.00Recommendations for Implementation – Landowner issues may present difficultyin acquiring the needed right of way for a trail alignment. Alternative alignments shouldbe investigated to determine the most feasible connection.Project 5.2.10: Connect Shining Sea Bikeway to Gifford StreetProject Description – This proposed connection has been conceived by the FalmouthBikeways Committee. The goal is to provide bicycle access to Gifford Street, a majornorth/south local collector connection Brick Kiln Road to Main Street (Route 28). Thereare a number of local roads that can be used as a bike route to facilitate this connectionincluding Pumping Station Road, Jones Road and Kathleen Lee Bates Road; thepreferred alternative. The most challenging constrain is the crossing of State HighwayRoute 28. The Falmouth Bikeways Committee has made inquiries to MassDOTregarding this location to in hopes to having a pedestrian bridge constructed to facilitatea safe and convenient crossing.Preliminary Design Concepts – The connection is envisioned to utilize local roadswith several possible options including Pumping Station Road, Jones Road, andKatherine Lee Bates Road which is the preferred alternative. Two primary design issuesentail identifying and designing a suitable crossing of Route 28, and access from thebikeway to Route 28 which may involve private property. Few streets provide a directroute from the bike way across Route 28 due to offset intersections. As a result a shortshared-use path spur may be necessary to provide a connection between the bikeway andRoute 28. Wayfinding signage should be installed along the selected route.Chapter 5: Bike & Pedestrian <strong>Cape</strong> <strong>Cod</strong> <strong>Regional</strong> <strong>Transportation</strong> <strong>Plan</strong> | August 2011Page 408
Cost Estimate – Shared-use path, unit costs per mile along varying alignments:• Adjacent to roadway with utility relocation – $765,600.00• Along new alignment – $871,200.00• Existing corridor (minor grading/clearing) – $792,000.00• Along abandoned RR bed – $660,000.00Crossing improvements, unit costs:• Marked Crossing – $1,500.00• Signalized Crossing – $70,000.00Assumes installation of signalized intersection with mast arms, signal heads, pedestriansignals, pavement markings, and appropriate pedestrian upgrades such as curb cuts andADA curb ramps.Recommendations for Implementation – Some have advocated for a pedestrianbridge for the Route 28 crossing, however such structures require significant right of wayand are very costly. Crossing improvements will be needed at the location chosen andspecialized pedestrian crossing signals should be considered such as a HAWK or therectangular rapid flash beacon (RRFB)both of which are only activated when apedestrian or bicycle is present, otherwise allowing the uninterrupted flow of traffic. Thepreferred alignment along surface streets will dictate where the crossing of Route 28 willneed to occur and an evaluation will be needed to determine the appropriate type andlevel of crossing accommodation and countermeasures needed. The alignment optionsshould also consider the potential need for a path connection and related expenses.Project 5.2.11: Extend Shining Sea Bikeway through Bourne to <strong>Cape</strong> <strong>Cod</strong>Canal BikewayProject Description – This proposed connection has been conceived by the FalmouthBikeways Committee. The Route 28 state highway layout is approximately 200 feet wideand contains a very wide, wooded median separating the northbound road from thesouthbound road. The Committee envisions bridging the southbound road way andconstruction of a multi-use path through the wooded median for a distance ofapproximately 6 miles to make a final connection to the <strong>Cape</strong> <strong>Cod</strong> Canal Bikeway. Thiswill provide an alternate route to a branch of Bike Route #1, located on County Road inBourne.It is important to note that the Town of Bourne is in support of an alternate concept forthe connection to the Canal which utilizes a ‘rails-with-trails’ design along the OldColony tracks. (See Project 5.3.8)Preliminary Design Concepts – The extension should utilize current designguidelines for shared-use paths and rail-trails with a minimum 10’ paved trail width. Aspur linking the existing bikeway with the proposed alignment via the media will need tobe identified, either within existing road right of way or along an independent alignment.<strong>Cape</strong> <strong>Cod</strong> <strong>Regional</strong> <strong>Transportation</strong> <strong>Plan</strong> | August 2011Chapter 5: Bike & PedestrianPage 409
Cost Estimate – Shared-use path, unit costs per mile along varying alignments:• Adjacent to roadway with utility relocation – $765,600.00• Along new alignment – $871,200.00• Existing corridor (minor grading/clearing) – $792,000.00• Along abandoned RR bed – $660,000.00Bike/pedestrian bridge, unit costs:• Survey, design, geo-tech, permitting, etc. – $240,000.00• Total lump sum (LS) construction – $1,200,000.00Recommendations for Implementation – Due to the unique alignment throughthe Route 28 median Mass Highway Department will need to be consulted for approvalof both the concept and specific design elements. Because of the cost of a flyover accessto the median it will be important to indicate that this segment of the bikeway wouldhave limited access points. Conceptual plans should incorporate at least a coupleproposed access points to facilitate wider use of the corridor by bicyclists seeking toaccess nearby destinations. Routing of a shared-use path through an interchange canprove difficult and access to the median will also prove challenging. Opportunities suchas utilizing the existing rail alignment south of Route 151 should be investigated to deemwhether access could to the median could be achieved, mitigating the need for a flyover.Project 5.2.12: Parking Improvements at TrailheadsProject Description – Significant usage of the trail facilities on <strong>Cape</strong> <strong>Cod</strong> results ininadequate parking capacity. Both existing and proposed facilities need to plan for andconstruct parking facilities for visitors accessing trailheads by car. Opportunities toutilize existing, but underused parking capacity should also be investigated.Project Location Map – NAPreliminary Design Concepts – Designs will be specific to individual trailheads,parking facilities, and parking demands.Cost Estimate – Construction of parking lot at trailhead:• $50,000.00Recommendations for Implementation – Existing trailheads need to be identifiedwhich currently experience excessive parking demand and opportunities for expansioninvestigated. Possible locations of new trailheads where adequate right of way exists forparking should be identified. Opportunities for joint-use or facility sharing should beinvestigated. <strong>Cape</strong> <strong>Cod</strong> localities should investigate adoption of local ordinances tofacilitate use of shared parking facilities. Model agreements and ordinances should bedeveloped that can be shared among <strong>Cape</strong> <strong>Cod</strong> localities to facilitate use of sharedfacilities. This approach provides an opportunity for facility sharing which increases theChapter 5: Bike & Pedestrian <strong>Cape</strong> <strong>Cod</strong> <strong>Regional</strong> <strong>Transportation</strong> <strong>Plan</strong> | August 2011Page 410
utilization of existing infrastructure while reducing the need for construction ofadditional parking facilities, many of which will be unutilized much of the year.Project 5.2.13: Connect <strong>Cape</strong> <strong>Cod</strong> Canal Bikeway to Hyannis <strong>Transportation</strong>CenterProject Description – Linking the developed areas of Bourne and Sandwich to theHyannis <strong>Transportation</strong> Center, approximately 22 miles away would provide multimodaltransportation options to the Upper <strong>Cape</strong>. Route 6 serves as the primary corridorfacilitating travel between the Upper and Mid-<strong>Cape</strong>, though it is largely unsuitable tobicycle travel. Ultimately an extension of the <strong>Cape</strong> <strong>Cod</strong> Rail Trail along the entire lengthof <strong>Cape</strong> <strong>Cod</strong> is envisioned, though at this time that is not feasible due to costs andlogistics. This project should identify off-roadway alignments to develop some sharedusepath segments while utilizing secondary roads for other segments.Preliminary Design Concepts – The design concepts are subject to determination ofa feasible alignment, whether on-roadway or for share-use path segments. Sinceconditions will vary considerably throughout the region connections should consist ofboth on-road and shared-use path connections. The designs will need to consider theappropriate elements for the context in which the routing takes place. Secondary streetswith low traffic speeds and volumes can provide adequate connections with minimalenhancements such as improved signage and/or pavement markings. Shared-use pathsections should utilize current design guidelines for shared-use paths and rail-trails witha minimum 10’ paved trail width. A wider paved surface should be considered alongsegments that are envisioned to have higher volumes of users. Current practices alsoconsider separation of bicycle and pedestrian modes by providing a wider trail surfaceand designation of walking and bicycling lanes to make for a safer and more enjoyableenvironment along segments where there is considerable mixing of bike and pedestriantraffic.Cost Estimate – Shared-use path, unit costs per mile along varying alignments:• Adjacent to roadway with utility relocation – $765,600.00• Along new alignment – $871,200.00• Existing corridor (minor grading/clearing) – $792,000.00• Along abandoned RR bed – $660,000.00On-road improvements, unit costs per mile:• Signing and striping – $10,560.00• Widening to add shoulders/bike lanes – $501,600.00Recommendations for Implementation – Due to the length and multiplejurisdictions a coordinated planning effort will be required to identify a proposed route<strong>Cape</strong> <strong>Cod</strong> <strong>Regional</strong> <strong>Transportation</strong> <strong>Plan</strong> | August 2011Chapter 5: Bike & PedestrianPage 411
and facilities needed. A corridor approach should be adopted to identify potentialshared-use path alignments throughout the region to ensure connectivity as thesegments can be built in phases, perhaps by different agencies or municipalities. Thedesired conditions and accommodations to be provided along on-roadway segmentsneed to be established and agreed upon by stakeholders so that conditions are consistentfor bicyclists traveling between jurisdictions. <strong>Plan</strong>ning and construction should becoordinated with Projects 5.2.6 & 5.2.7 in order to link proposed projects and develop awider bicycle network.Project 5.2.14: Develop <strong>Plan</strong> for Intermodal Center in FalmouthProject Description – This proposed connection has been conceived by the FalmouthBikeways Committee. The intermodal center is proposed to be located at the formerNorth Falmouth railroad station at the intersection of County Street with the Bay ColonyRail/ Commonwealth of Massachusetts Executive Office of <strong>Transportation</strong> Railroadright-of-way. At the present time this site is at the northern terminus of the Shining SeaBike trail. This lot is unpaved and is currently used as a parking lot for trail users. Thesite supports an active section of Bay Colony Rail operations.Preliminary Design Concepts – This lot is large enough to support a paved parkinglot and bus stop operations. The improvement could include formal curb cuts, a pavedparking field with internal circulation, a ‘kiosk’ type bus shelter mounted on a raisedpedestrian island, and bike racks.Cost Estimate – Multiple facility improvements:• Parking lot – $50,000.00• Bus shelters – $20,000.00• Secure bicycle parking (unit cost)– $1,500.00Recommendations for Implementation – Multiple entities need to coordinateefforts and agree upon the scope of the facility and operations proposed for theintermodal center. The specific configuration and ingress and egress to the facilitywould need to be evaluated and a possibly a traffic study conducted to determine trafficimpacts. It has been proposed that the railroad could provide some level of funding for ashared facility.Project 5.2.15: Improve Bicycle Facilities on Tupper Road South of Route 6AProject Description – Tupper Road in Sandwich provides access to the terminus ofthe <strong>Cape</strong> <strong>Cod</strong> Canal Bikeway, paralleling much busier Route 6A which also serves asMass Bike Route 1. Tupper Road then provides a north/south connection between Route6A and Route 130, Main Street, but lacks any bicycle accommodations. Adding pavedshoulders or other bicycle improvements would provide safer, more comfortablebicycling conditions while also reducing conflicts with motor vehicles. Adding pavedshoulders has additional benefits including pavement edge stabilization, the addition of aChapter 5: Bike & Pedestrian <strong>Cape</strong> <strong>Cod</strong> <strong>Regional</strong> <strong>Transportation</strong> <strong>Plan</strong> | August 2011Page 412
ecovery area which reduces roadway departure crashes, and a breakdown area thatallows disabled vehicles to be moved out of the travel lane, thereby mitigating congestionimpacts from such incidents. These all result in safety, operational, and maintenancebenefits which yield long-term cost savings.Preliminary Design Concepts – Road widening or the addition of paved shouldersshould consider the existing roadway geometrics. In order to be useful for bicycle travelshoulders and the adjacent travel lane need to be of adequate widths to provide a degreeof separation between the two modes, otherwise safety can be impaired by invitingmotorists to pass too closely to bicyclists that attempt to hug the outside edge of theroadway. In general a four-foot shoulder is desirable to provide adequate operatingspace for a bicyclist while allowing motorists unimpeded travel within the adjacent lane.On roads with curb and gutter, the gutter pan and the longitudinal joint effectivelyreduces the useable width of the shoulder and consideration needs to be given to thepaved width of the shoulder exclusive of the gutter pan. Realignment of Mass Bike Route1 (the Claire Saltonstall Bikeway) onto this improved route, complete with appropriatesignage would offer a more appealing route for long-distance bicyclists.Cost Estimate – On-road improvements, unit costs per mile:• Widening to add shoulders/bike lanes – $501,600.00Assumes adding shoulders along both sides of the road.Recommendations for Implementation – Opportunities should be sought to beginimplementing improvements through coordination with other construction andmaintenance projects. Routine pavement overlay and resurfacing projects shouldinclude shoulder paving for this route if adequate right of way exists or can be obtained.Maintenance needs to be considered so that the functionality of shoulders for bicyclingpurposes is retained since the natural sweeping action of vehicles often results in debrisaccumulating in the untraveled shoulder. In order to further develop an improvedcorridor and continuous route, and perhaps a resultant realignment of the ClaireSaltonstall Bikeway, any improvements should be coordinated with Projects 5.3.15 and5.3.17.Project 5.2.16: Evaluate Use of Unpaved Roads for Bike Path Connections in<strong>Cape</strong> <strong>Cod</strong> National SeashoreProject Description – Within the National Seashore a number of unpaved roadscurrently exist which could be utilized to provide bicyclists with access to several popularbicycle trails. This would result in establishment of a unified network without having totravel on the more heavily traveled roadways, particularly Route 6, and which could beaccomplished with minimal improvements, resulting in a low cost enhancement to theexisting, but fragmented bicycle network in the Seashore.<strong>Cape</strong> <strong>Cod</strong> <strong>Regional</strong> <strong>Transportation</strong> <strong>Plan</strong> | August 2011Chapter 5: Bike & PedestrianPage 413
Preliminary Design Concepts – Design issues would largely be limited to providingadequate wayfinding signage to direct bicyclists through the Seashore to populardestinations and trails. Such signage should follow the standards and protocolestablished via Project 5.2.2 (if implemented) to maintain consistency with bicyclewayfinding signage throughout the region.Cost Estimate – NARecommendations for Implementation –Possible connector routes via existingunpaved roads should be identified, especially those that are likely to have the leastimpact to sensitive environmental or historical features within the Seashore. Existingconditions should be evaluated for compatibility with bicycle use and any neededimprovements should be documented for consideration in the planning processincluding grading and additional loads of surface material. Should unpaved roads beused for this purpose a maintenance policy will be needed to ensure conditions suitablefor bicycling are maintained and wayfinding signage will be needed to direct bicyclists todestinations and trails within the Seashore.5.4.3 NEW FACILITIESThe following is a list of twenty two projects proposing construction of new facilities.These projects are number 5.3.1 through 5.3.22.Project 5.3.1: Evaluate Local Roads and Establish Bicycle Connectionsbetween <strong>Cape</strong> <strong>Cod</strong> National Seashore and Neighboring CommunitiesProject Description – A two-phase project proposing to develop planning alternativesto improve bicyclist safety and access by providing connections between <strong>Cape</strong> <strong>Cod</strong>National Seashore and six neighboring communities followed by a pilot projectimplementation component.Component A – Feasibility Study to include• General overview, project purpose and need, local and regional perspectives;• Project Description, including locus map, major constraints and opportunities;• Corridor Right of Way: public vs. private property;• Resources: GIS level environmental resources such as waterways, wetlands,vernal pools, wildlife habitat, management/refuge areas, historicareas/districts/sites, contaminated sites;• Trail or route design criteria;• Structures required; and• Route and trail amenities: parking, access to attractions, wayfinding &interpretive signing.Component B – Implementation of pilot project on 1 roadwayChapter 5: Bike & Pedestrian <strong>Cape</strong> <strong>Cod</strong> <strong>Regional</strong> <strong>Transportation</strong> <strong>Plan</strong> | August 2011Page 414
Preliminary Design Concepts – Conceptual design would include typical sections,alignment, road/water crossings, structures, trail amenities, impacts & mitigation, ROWactions, permitting requirements, and construction. Final design would includeconstruction plans, specifications, right-of-way plans, and bidding documents foradvertising by MassDOT or the municipality.This project proposal assumes a 2 mile pilot project for cost estimating purposesconsisting of minor roadway widening, and intersection and traffic signal improvements.Cost Estimate –• Feasibility Study – $20,000• Pilot project design and construction – $3,471,046.66Recommendations for Implementation – Prior to evaluating local roads forsuitable bicycling conditions it will be necessary to establish evaluation criteria andmetrics. Roadway geometrics, traffic volumes, prevailing speeds, the presence of tripgenerators including residential origins, and directness of travel should be considered.Subsequently, selection of neighboring communities and potential connector routes orcorridors is needed before any feasibility study and analysis can proceed. The list ofpotential routes should be inclusive of a variety of roadways and conditions so thatalternatives can be established and evaluated to determine opportunities and barriers toimplementation of improvements and connections. Off-roadway alignments should beconsidered and evaluated as well including abandoned rail lines, utility line easements,conservation lands, or other possible alignments. Demonstration of the improvementsresulting from the pilot project requires the collection of baseline (current conditions)data for comparison after implementation. Data to be collected will need to bedetermined specific to the community and route selected, however the following shouldbe considered:• Route / facility usage (bike/pedestrian trips)• Type of trips made via corridor / route• Crash data• Perceived level of safety among facility users• Perceived level safety among motorists encountering bicyclists and pedestrians• Ease of wayfindingProject 5.3.2: Feasibility Study and Design of Bike Path along Route 6 fromHerring Cove Parking Lot to Race Point RoadProject Description – A two-phase project to develop a bicycle path connecting theCCNS parking facilities at Herring Cove to other National Seashore facilities, includingthe Province Lands Bicycle Trail at Race Point Road. The first phase is to conduct aFeasibility Study coordinated between the <strong>Cape</strong> <strong>Cod</strong> Commission, the State ofMassachusetts, the National Park Service, and the town of Provincetown to identifydedicated alignment within the existing right of way along the north Side of Route 6from Herring Cove to Race Point Road.<strong>Cape</strong> <strong>Cod</strong> <strong>Regional</strong> <strong>Transportation</strong> <strong>Plan</strong> | August 2011Chapter 5: Bike & PedestrianPage 415
Route 6 is a principal arterial that provides direct access between Herring Cove and theNational Seashore attractions at Race Point, including the Province Lands Bicycle Trail.<strong>Complete</strong>ly lacking in bicycle and pedestrian accommodations, Route 6 has onlyminimally paved shoulders, significant traffic volume, truck traffic, and posted speedlimits varying between 35 MPH and 45 MPH. Though Herring Cove and Race Point areconnected via the Province Lands Bicycle Trail, it is a circuitous path and doesn’tfacilitate convenient and expedient bicycle and pedestrian mobility between the twopoints. Additionally, bicycle access to these two locations from the commercial centerand the neighborhoods of Provincetown is not available. As a result nonmotorizedmodes cannot be comfortably utilized to reach these nearby destinations, resulting ingreater reliance on automobile travel within this region of <strong>Cape</strong> <strong>Cod</strong>.Component A – Feasibility Study to include• General overview, project purpose and need, local and regional perspectives;• Project Description, including locus map, major constraints and opportunities;• Corridor Right of Way: public vs. private property;• Resources: GIS level environmental resources such as waterways, wetlands,vernal pools, wildlife habitat, management/refuge areas, historicareas/districts/sites, contaminated sites;• Trail or route design criteria;• Structures required;• Trail amenities: parking, access to attractions, wayfinding & interpretive signing;• Trail access points providing connections to on-roadway bicycle and pedestrianroutes in Provincetown;• Needed facilities and retrofits to connecting bicycle and pedestrian routes withinProvincetown;• Conceptual Design including typical sections, alignment, road/water crossings,impacts & mitigation, permitting requirements, construction costs; and• Operations & Maintenance requirements.Component B – Class III design and construction plansDesign cost estimates at 17% of NET construction costsPreliminary Design Concepts – Conceptual design would include typical sections,alignment, road/water crossings including trail access points at intersections thatprovide connections to neighborhoods and the commercial center of Provincetown,structures, trail amenities, impacts & mitigation, ROW actions, permitting requirements,and construction. Final design would include construction plans, specifications, rightof-wayplans, and bidding documents for advertising by MassDOT or the municipality.The envisioned project would be approximately 2 miles long.Chapter 5: Bike & Pedestrian <strong>Cape</strong> <strong>Cod</strong> <strong>Regional</strong> <strong>Transportation</strong> <strong>Plan</strong> | August 2011Page 416
Cost Estimate –• Feasibility Study – $20,000• Class III Design & Construction – $3,456,085Recommendations for Implementation – Coordination of stakeholder interests isneeded to fully develop the scope of the feasibility study component. Existing plansshould be consulted to determine how related projects can contribute to the overalldevelopment of a facility that is integrated into the existing bicycle and pedestriannetwork in Provincetown. <strong>Plan</strong>ned or programmed projects that have the potential toimpact concurrency issues, notably those on connector routes providing access to theproposed path should be investigated to determine possible synergies and cost savingswith minimal changes to scopes of work. Specifically any improvements should becoordinated with Project 5.3.12 to integrate efforts at developing linkages throughoutProvincetown and the Province Lands attractions within the Seashore.Project 5.3.3: Identify Possible Connections between the <strong>Cape</strong> <strong>Cod</strong> Rail Trailand <strong>Cape</strong> <strong>Cod</strong> National Seashore TrailsProject Description – Envisioned primarily in Eastham where the Nauset Trail isproximate, but not connected to the <strong>Cape</strong> <strong>Cod</strong> Rail Trail, connections between the CCRTand trails within the Seashore are needed. The CCRT, located to the west of Route 6 isapproximately ½ mile from the Salt Pond Visitor’s Center but requires crossing Route 6to facilitate a direct connection. Just north of the Salt Pond Visitor’s Center (site of thetrailhead) the CCRT passes underneath Route 6 and on-roadway routes could bedesignated without the need to cross Route 6 at-grade, though they would provide lessdirect access.Preliminary Design Concepts – The design concepts are subject to determination ofa feasible alignment to connect Seashore trails to the <strong>Cape</strong> <strong>Cod</strong> Rail Trail. Sinceconditions will vary considerably at each location the connections could consist of bothon-road and shared-use path connections the designs will need to consider theappropriate elements for the context in which the routing takes place. Secondary streetswith low traffic speeds and volumes can provide adequate connections with minimalenhancements such as improved signage and/or pavement markings. Shared-use pathsections could utilize a paved surface, or a natural surface. Unpaved roads should also beconsidered to establish connections.Cost Estimate – Shared-use path, unit costs per mile along varying alignments:• Adjacent to roadway with utility relocation – $765,600.00• Along new alignment – $871,200.00• Existing corridor (minor grading/clearing) – $792,000.00• Along abandoned RR bed – $660,000.00<strong>Cape</strong> <strong>Cod</strong> <strong>Regional</strong> <strong>Transportation</strong> <strong>Plan</strong> | August 2011Chapter 5: Bike & PedestrianPage 417
On-road improvements, unit costs per mile:• Signing and striping – $10,560.00• Widening to add shoulders/bike lanes – $501,600.00Assumes adding shoulders, striping and signage along both sides of the road.Recommendations for Implementation – Locust Road provides the most directaccess between the visitor’s center and the rail-trail, however access via this routerequires and at-grade crossing of Route 6. The intersection is controlled by a signalhowever, and if chosen as the alignment the signal operation should be evaluated forcompatibility with bicycles (bicycle detection, appropriate timing and clearanceintervals). An alternative route would utilize the CCRT underpass beneath Route 6 toaccess the neighborhood streets to the east via Old Orchard Road and School HouseRoad. This option would avoid an at-grade crossing of Route 6 but would result in alonger, more circuitous route. Existing conditions on all potential roadway segmentsshould be evaluated to determine the most feasible routing requiring the leastinfrastructure improvements to keep costs low.Project 5.3.4: <strong>Regional</strong> and local Pedestrian and Bikeway connectivity toDennis PortProject Description – The Town of Dennis, through its Dennis Port RevitalizationCommittee, has established a prime objective of making pedestrian and bikewayconnections to key destinations in the region surrounding the Dennis Port Village. Theseconnections include (among others); providing links to the hotel / motel district locatedon Lower County Road; the playgrounds and historic sites located in South Dennis; theCottage Colony located between Lower County Road and the beach / waterfront area;and a combination of shared routes and/or multi-use paths to provide connections to the<strong>Cape</strong> <strong>Cod</strong> Rail Trail at Route 134, and the Old Colony Rail Trail in Harwich. The variousdesired connections are identified and illustrated in the Dennis Port Master <strong>Plan</strong> whichmay be found online at:www.dennisportrevitalization.orgPreliminary Design Concepts – On-roadway improvements and accommodationsare needed to provide direct, comfortable bicycle routes and safe roadway crossings toaccess the rail trails. Shoulder widening, pavement markings, signage, intersectionenhancements, and other safety countermeasures along with wayfinding measureswould provide a convenient and comfortable route for cyclists of varying abilities.Sidewalks and improved crossings are needed at various locations to establish pedestrianroutes and connections. Specific design treatments should be sensitive to the particularneeds and context of each road where improvements are made.Cost Estimate – Shared-use path, unit costs per mile along varying alignments:Chapter 5: Bike & Pedestrian <strong>Cape</strong> <strong>Cod</strong> <strong>Regional</strong> <strong>Transportation</strong> <strong>Plan</strong> | August 2011Page 418
• Adjacent to roadway with utility relocation – $765,600.00• Along new alignment – $871,200.00• Existing corridor (minor grading/clearing) – $792,000.00• Along abandoned RR bed – $660,000.00On-road improvements, unit costs per mile:• Signing and striping – $10,560.00• Widening to add shoulders/bike lanes – $501,600.00Assumes adding shoulders, signs, and pavement markings along both sides of the road.Sidewalks and crossing improvements, unit costs:• 5’ Sidewalks, bituminous, both sides of street – $120.00/linear foot• 5’ Sidewalks, concrete, both sides of street – $140.00/linear foot• Marked Crossing – $1,500.00• Signalized Crossing – $70,000.00Assumes installation of signalized intersection with mast arms, signal heads, pedestriansignals, pavement markings, and appropriate pedestrian upgrades such as curb cuts andADA curb ramps.Recommendations for Implementation – The feasibility of adding pavedshoulders or bicycle lanes and improving conditions to one or more roads needs to bedetermined. Multiple connections should be considered to provide for access to both railtrails and destinations along the potential routes should be considered when selectingalignments. Routes that serve to connect multiple trip generators would serve toincrease the utilization of bicycling for utility trips and multiple connections wouldestablish a more complete route network in the region. A four foot shoulder is desirableto provide adequate operating space for a bicyclist while allowing motorists unimpededtravel within the adjacent lane.Project 5.3.5: Identify <strong>Regional</strong> Connections between Existing Paths andLocations with High Pedestrian TrafficProject Description – Sidewalks or shared-use paths should be provided to establishconnected and contiguous pedestrian access routes between the commercial tripgenerators, residential neighborhoods, and existing pedestrian facilities wherepedestrian traffic is currently high or for which there is significant latent demand.Pedestrian networks should be established on a regional basis to connect villages andtowns when density and proximity warrant.Preliminary Design Concepts – Depending upon traffic volumes, speeds, andlocation of pedestrian trip generators, sidewalks should be considered along both sides ofthe street. Appropriate marked crosswalks and signage, consistent with the roadwaygeometrics and existing traffic patterns should be installed at intersections where the<strong>Cape</strong> <strong>Cod</strong> <strong>Regional</strong> <strong>Transportation</strong> <strong>Plan</strong> | August 2011Chapter 5: Bike & PedestrianPage 419
heaviest pedestrian movements are likely to occur. Additional pedestrian safetycountermeasures should be considered where appropriate.Cost Estimate – Shared-use path, unit costs per mile along varying alignments:• Adjacent to roadway with utility relocation – $765,600.00• Along new alignment – $871,200.00• Existing corridor (minor grading/clearing) – $792,000.00• Along abandoned RR bed – $660,000.00Sidewalks and crossing improvements, unit costs:• 5’ Sidewalks, bituminous, both sides of street – $120.00/linear foot• 5’ Sidewalks, concrete, both sides of street – $140.00/linear foot• Marked Crossing – $1,500.00• Signalized Crossing – $70,000.00Assumes installation of signalized intersection with mast arms, signal heads, pedestriansignals, pavement markings, and appropriate pedestrian upgrades such as curb cuts andADA curb ramps.Recommendations for Implementation – A gap analysis should be undertaken toidentify and prioritize sidewalks and crossings needed to develop a complete networkwhich integrates the existing pedestrian infrastructure including sidewalks, paths, andneighborhood streets with the surrounding pedestrian trip generators including bothresidential and commercial origins and destinations. Safety countermeasures should beconsidered for locations where potential exists for vehicle/pedestrian collisions,primarily at the intersections with arterial and collector roadways and where commercialentrances or lack of access management results in frequent conflict points. Accessmanagement should be considered at these locations, and improvements should alsoseek to improve access to transit stops when appropriate.Project 5.3.6: Identify a “Shore Route” South of Route 28 from Woods Holein Falmouth to Stage Harbor in ChathamProject Description – Identification of a “Shore Route” of approximately 45 milesproviding bicycle access and connectivity across a region comprised of eight localitieswould link the many destinations and villages of this heavily developed region of the<strong>Cape</strong>. Proposed as an on-roadway route, it would closely follow the coastline alongNantucket Sound. Limited route options in many locations result from a fragmentedroad network that would require use of Rte 28 in many locations. In developed areaswhere Route 28 lies farther from the coast, more route permeability typically exists,allowing for more routing options, though this is intermittent throughout the corridorfrom Falmouth to Chatham.Chapter 5: Bike & Pedestrian <strong>Cape</strong> <strong>Cod</strong> <strong>Regional</strong> <strong>Transportation</strong> <strong>Plan</strong> | August 2011Page 420
Preliminary Design Concepts – On-roadway improvements and accommodationsare needed to provide a relatively direct, comfortable, and connected bicycle route southof the Route 28 corridor. Shoulder widening, pavement markings, signage, intersectionenhancements, and other safety countermeasures along with wayfinding measuresshould be utilized consistent with the context and conditions of the specific roadwayswhere improvements are implemented. Because of the circuitous routing that would berequired wayfinding is an essential element. Where the use of Route 28 is requiredcareful consideration needs to be given to providing bicycle accommodations andcountermeasures that facilitate bicyclists safely entering and departing this heavilytraveled roadway.Cost Estimate – On-road improvements, unit costs per mile:• Signing and striping – $10,560.00• Widening to add shoulders/bike lanes – $501,600.00Assumes adding shoulders, signs, and pavement markings along both sides of the road.Recommendations for Implementation – Due to the regional nature of theproposed project, coordination among the eight localities and the <strong>Cape</strong> <strong>Cod</strong> Commissionis needed. The large area and the lack of a connected network of candidate roadwayspose significant barriers to implementation. Uniformity in accommodations through thecorridor should be sought so that cyclists utilizing the route for travel across the <strong>Cape</strong>will encounter a unified and integrated route from one jurisdiction to the next. Localcomprehensive plans and other local and regional plans should be reviewed andamended to reflect the proposed project, the desired level of accommodations, andmeans by which individual localities can implement improvements. The project shouldbe coordinated with other proposed improvements where new routes might utilize Route28 or parallel corridors such as the proposed improvement and designation of Route 28as a bicycle route (Project 5.3.10) and the proposed “OBHC Triangle Route” (Project5.3.18). Additionally, the improvements should be coordinated with the proposedconnections between the Old Colony Rail Trail and Harwich Port and Dennis Port(Projects 5.3.9 & 5.3.4) in order to ensure linkages that will establish a connectednetwork of bicycle routes.Project 5.3.7: Identify a “Bay Route” from the <strong>Cape</strong> <strong>Cod</strong> Canal in Bourne toOrleansProject Description – A “Shore Route” of approximately 30 miles is envisioned toprovide continuous bicycle access and connectivity across the six localities along <strong>Cape</strong><strong>Cod</strong> Bay. The route would link the villages and destinations of this developed region ofthe <strong>Cape</strong> similar to the proposed “Shore Route” paralleling it along the southern coast ofthe <strong>Cape</strong>. Likewise, the “Bay Route” is envisioned as an on-roadway route following thecoastline along <strong>Cape</strong> <strong>Cod</strong> Bay, north of Route 6 and traversing the popular destinationsalong the coast. Limited route options in many locations result from a road networkfragmented by both manmade and natural features, and which would require use of<strong>Cape</strong> <strong>Cod</strong> <strong>Regional</strong> <strong>Transportation</strong> <strong>Plan</strong> | August 2011Chapter 5: Bike & PedestrianPage 421
Route 6A in many locations. In developed areas where Route 6 lies farther from the coastmore route options exist, most notably in West Barnstable and Dennis. Unlike the Rte 28corridor of the “Shore Route” Route 6A parallels Route 6, providing a largely continuousroute option with slower speeds and traffic volumes than the principal arterial Route 6,though it would still need infrastructure improvements to be a suitable route.Preliminary Design Concepts – On-roadway improvements and accommodationsare needed to provide a relatively direct, comfortable, and connected bicycle route northof Route 6. Shoulder widening, pavement markings, signage, intersectionenhancements, and other safety countermeasures along with wayfinding measuresshould be utilized consistent with the context and conditions of the specific roadwayswhere improvements are implemented. Because of the circuitous routing that might beutilized along secondary and residential streets wayfinding is an essential element.Cost Estimate – On-road improvements, unit costs per mile:• Signing and striping – $10,560.00• Widening to add shoulders/bike lanes – $501,600.00Assumes adding shoulders, signs, and pavement markings along both sides of the road.Recommendations for Implementation – Due to the regional nature of theproposed project, coordination among the six localities and the <strong>Cape</strong> <strong>Cod</strong> <strong>Regional</strong>Commission is needed. The large area and the limited network of connected candidateroadways pose significant barriers to implementation. Uniformity in accommodationsthrough the corridor should be sought so that cyclists utilizing the route for travel acrossthe <strong>Cape</strong> will encounter a unified and integrated route from one jurisdiction to the next.Local comprehensive plans and other local and regional plans should be reviewed andamended to reflect the proposed project, the desired level of accommodations, andmeans by which individual localities can implement improvements. The project shouldbe coordinated with other proposed improvements within or adjacent to the Route 6corridor such as the proposed route through the Sandwich Historic District (Project5.3.27) and the “OBHC Triangle Route” (Project 5.3.18).Project 5.3.8: Relocation of Existing Rail Line and Conversion to TrailProject Description – This 6 mile project in the Town of Bourne proposes to create arails-with-trail facility from the northern terminus of the Shining Sea Bike Path to the<strong>Cape</strong> <strong>Cod</strong> Canal Bikeway via the existing MassDOT/Bay Colony railroad right-of-way(ROW). This existing rail corridor parallels Shore Road in Bourne. Although the titlesuggests that the tracks require relocation, it is possible that the railroad ROW maintainssufficient width to support a new multi-use trail without the need to move the tracks.Chapter 5: Bike & Pedestrian <strong>Cape</strong> <strong>Cod</strong> <strong>Regional</strong> <strong>Transportation</strong> <strong>Plan</strong> | August 2011Page 422
It is important to note that the Town of Falmouth is in support of an alternate conceptfor the connection to the Canal which utilizes the Route 28 median for construction of amulti-use path to make the connection from the Shining Sea bike path to the <strong>Cape</strong> <strong>Cod</strong>Canal. (See Project 5.2.11)Preliminary Design Concepts – The trail should utilize current design guidelines forshared-use paths and rail-trails with a minimum 10’ paved trail width. A wider pavedsurface should be considered along segments that are envisioned to have higher volumesof users. A number of at grade crossings will require individual consideration basedupon the conditions present and safety countermeasures required.Cost Estimate – Shared-use path, unit costs per mile:• Along abandoned RR bed – $660,000.00Crossing improvements, unit costs:• Marked Crossing – $1,500.00• Signalized Crossing – $70,000.00Assumes installation of signalized intersection with mast arms, signal heads, pedestriansignals, pavement markings, and appropriate pedestrian upgrades such as curb cuts andADA curb ramps.Rail relocation costs:• TBD, if necessaryRecommendations for Implementation – Additional research is required toconfirm the layout width of the railroad ROW. The project will also require the design ofnumerous at grade crossings at the various intersection with public and private streets.This would likely be a mega-project requiring significant funding and a phased approach.The initial phase should include linkages to existing trail or on-road routes to be anintegrated facility, not a stand-alone facility.Project 5.3.9: Connect Harwich Port to Old Colony Rail TrailProject Description – Harwich Port is located approximately 1½ miles south of thecenter of Harwich and the Old Colony Rail Trail. Currently there are no bicycle routes oraccommodations linking Harwich Port to the trail. Several potential routes exist, notablyalong Bank, Forest, and South Streets, that could be improved and designated by addingshoulders or bike lanes along with signage, including wayfinding aids.Preliminary Design Concepts – On-roadway improvements and accommodationsare needed to provide direct, comfortable bicycle routes and safe roadway crossings to<strong>Cape</strong> <strong>Cod</strong> <strong>Regional</strong> <strong>Transportation</strong> <strong>Plan</strong> | August 2011Chapter 5: Bike & PedestrianPage 423
access the rail trails. Shoulder widening, pavement markings, signage, intersectionenhancements, and other safety countermeasures along with wayfinding measures willprovide a convenient and comfortable route for cyclists of varying abilities. Specificdesign treatments should be sensitive to the particular needs and context of each roadwhere improvements are made.Cost Estimate – On-roadway improvements (1.5 miles):• Signing and striping – $15,840.00• Widening to add shoulders/bike lanes – $752,400.00Assumes adding shoulders, striping and signage along both sides of the road.Recommendations for Implementation – The feasibility of adding pavedshoulders or bicycle lanes to one or more of the three likely candidate streets needs to bedetermined. Existing right-of-way, utilities, and/or the existence of undevelopedproperties along the candidate routes will largely determine the preferred alignment ofan improved bike route. A four foot shoulder is desirable to provide adequate operatingspace for a bicyclist while allowing motorists unimpeded travel within the adjacent lane.Coordination with Project 5.3.4 and 5.3.6 seeking to improve bicycling conditions in theRoute 28 corridor will help to ensure connectivity.Project 5.3.10 Designate Route 28 as a Bike Route and Improve ConditionsProject Description – Though Route 28 is mainly a secondary highway it serves as theprimary corridor along Nantucket Sound linking 8 towns through the Upper, Mid, andLower <strong>Cape</strong>. Approximately sixty miles of Route 28 provides access to a number ofdestinations across the <strong>Cape</strong> including villages, town centers, the Hyannis<strong>Transportation</strong> Center, and the <strong>Cape</strong> <strong>Cod</strong>/Old Colony Rail Trail. Despite being theprimary route through this heavily developed area of <strong>Cape</strong> <strong>Cod</strong> the road is mostly a twolane,undivided road, often lacking paved shoulders, and is heavily congested duringpeak season. Improvements would provide bicyclists with a convenient and comfortableroute linking the many towns, villages, and destinations along Nantucket Sound.Improvements would also reduce conflicts between bicyclists and motorists and reducecongestion, both by encouraging greater use of bicycling for transportation and byreducing vehicle where passing opportunities don’t currently exist.Preliminary Design Concepts – On-roadway improvements and accommodationsare needed to provide a direct, comfortable bicycle route through the Route 28 corridor.Shoulder widening, pavement markings, signage, intersection enhancements, and othersafety countermeasures along with wayfinding measures should be utilized consistentwith the context and conditions of the specific roadways where improvements areChapter 5: Bike & Pedestrian <strong>Cape</strong> <strong>Cod</strong> <strong>Regional</strong> <strong>Transportation</strong> <strong>Plan</strong> | August 2011Page 424
implemented. In some locations a shared-use path design may be appropriate ordesirable if children and less experience adult bicyclists are intended users of the route.Cost Estimate – Shared-use path, unit costs per mile along varying alignments:• Adjacent to roadway with utility relocation – $765,600.00• Existing corridor (minor grading/clearing) – $792,000.00On-road improvements, unit costs per mile:• Signing and striping – $10,560.00• Widening to add shoulders/bike lanes – $501,600.00Assumes adding shoulders, striping and signage along both sides of the road.Recommendations for Implementation – Due to the regional nature of theproposed project, coordination among the eight localities and the <strong>Cape</strong> <strong>Cod</strong> <strong>Regional</strong>Commission is needed. The large geographic area and the limited right of way in manylocations pose many challenges to implementation. Uniformity in accommodationsthrough the corridor should be considered so that cyclists utilizing the route for travelacross the <strong>Cape</strong> will encounter a unified and integrated route from one jurisdiction to thenext. Local comprehensive plans and other local and regional plans should be reviewedand amended to reflect the proposed project, the desired level of accommodations, andmeans by which individual localities can implement improvements. The project shouldbe coordinated with other proposed improvements where new routes might utilize Route28 or parallel corridors such as the proposed “Shore Route” (Project 5.3.6) and theproposed “OBHC Triangle Route” (Project 5.3.18).Project 5.3.11 Establish Bicycle & Pedestrian Connections between OrleansVillagesProject Description – Sidewalks or shared-use paths providing connected andcontiguous pedestrian access routes between the villages of Orleans and their respectivetrip generators will enhance mobility and increase safety. Bicycle connections also willfacilitate greater mobility and less reliance on automobile travel, and the addition of onroadaccommodations and shared-use path facilities should be considered based uponcontext and intended users. The Village Center, South Orleans, East Orleans, RockHarbor, and Skaket need to be considered for both bicycle and pedestrian connections ascalled for in the Orleans Comprehensive <strong>Plan</strong> (OS22).Preliminary Design Concepts – Depending upon traffic volumes, speeds, and thelocation of pedestrian trip generators, sidewalks should be considered along both sides ofthe street. Appropriate marked crosswalks and signage, consistent with the roadwaygeometrics and existing traffic patterns should be installed at intersections where theheaviest pedestrian movements are likely to occur. Additional pedestrian safetycountermeasures should be considered where appropriate.<strong>Cape</strong> <strong>Cod</strong> <strong>Regional</strong> <strong>Transportation</strong> <strong>Plan</strong> | August 2011Chapter 5: Bike & PedestrianPage 425
On-roadway accommodations, shared-use paths and linkages, bike route signage, androadway widening and striping should be considered to provide enhanced conditions forbicyclists. Due to right of way concerns, on-roadway alignments will likely prove themost feasible options and can utilize secondary and neighborhood streets with lowerspeeds and moderate traffic with minimal improvements while still providing anadequate level of accommodation for most bicyclists.Cost Estimate – Shared-use path, unit costs per mile along varying alignments:• Adjacent to roadway with utility relocation – $765,600.00• Along new alignment – $871,200.00• Existing corridor (minor grading/clearing) – $792,000.00• Along abandoned RR bed – $660,000.00On-road improvements, unit costs per mile:• Signing and striping – $10,560.00• Widening to add shoulders/bike lanes – $501,600.00Sidewalks and crossing improvements, unit costs:• 5’ Sidewalks, bituminous, both sides of street – $120.00/linear foot• 5’ Sidewalks, concrete, both sides of street – $140.00/linear foot• Marked Crossing – $1,500.00• Signalized Crossing – $70,000.00Assumes installation of signalized intersection with mast arms, signal heads, pedestriansignals, pavement markings, and appropriate pedestrian upgrades such as curb cuts andADA curb ramps.Recommendations for Implementation – A gap analysis should be undertaken toidentify and prioritize sidewalks, crossings, shared-use paths, and on-roadwayimprovements needed to develop a complete bicycle and pedestrian network which linksthe villages of Orleans to one another and to existing bicycle and pedestrian tripgenerators. Safety countermeasures should be considered for locations where potentialexists for conflict points with the addition of bicycle and pedestrian facilities.Project 5.3.12 Connect MacMillan Pier to <strong>Cape</strong> <strong>Cod</strong> National SeashoreBicycle PathsProject Description – MacMillan Pier in the heart of Provincetown serves as amultimodal center with local and regional bus service as well as ferry service to Plymouthand Boston. Bicycle travel on the commercial and residential streets of Provincetown ismanageable with lower traffic speeds; however access to the National Seashore becomesmore difficult requiring riding along and crossing collectors and arterials since limitedroutes exist to link the two destinations. Enhancing the ability to access the NationalSeashore bike paths from Provincetown, and specifically MacMillan pier will improveChapter 5: Bike & Pedestrian <strong>Cape</strong> <strong>Cod</strong> <strong>Regional</strong> <strong>Transportation</strong> <strong>Plan</strong> | August 2011Page 426
multimodal options and facilitate greater use of bicycling to access the Seashore withoutrequiring reliance on automobiles.Preliminary Design Concepts – On-roadway improvements and accommodationsare needed to provide direct, comfortable bicycle routes and safe roadway crossings.Shoulder widening, pavement markings, signage, intersection enhancements, and othersafety countermeasures will provide bicyclists with wayfinding along a convenient andcomfortable route for cyclists of varying abilities.Cost Estimate – On-road improvements, unit costs per mile:• Signing and striping – $10,560.00• Widening to add shoulders/bike lanes – $501,600.00Assumes adding shoulders, signs, and pavement markings along both sides of the road.Recommendations for Implementation – Due to the limited roads that willprovide access to the Province Lands Bicycle Trail via Race Point Road several routingoptions should be established and existing conditions evaluated. Needed improvementsshould be determined and the most feasible route chosen for improvements.Coordination with Project 5.3.2, the proposed path linking Herring Cove’s parkingfacilities with Race Point Road, will ensure that intersection improvements and logicalconnections between this on-road route and the proposed provide a continuous andintegrated network linking Provincetown with the Seashore destinations. Coordinationwith Provincetown will be needed.Project 5.3.13 Connect Province Lands Bicycle Trail and Head of theMeadow TrailProject Description – The 7.6-mile Province Lands Bicycle Trail and the 2-mile Headof the Meadow Trail, two of the Seashore’s most popular trails, lie approximately fourmiles apart on the Outer <strong>Cape</strong>. Currently the trails are not accessible from one anotherother than by transiting along Route 6. Though an alignment for a separate trail linkingthese two trails is desirable the dunes and other sensitive features make that difficult toachieve. Use of existing roads, paved or unpaved, is likely needed for at least part of thealignment. Connection of the two trails would reduce the need to access both trails byautomobile, thereby helping to ease congestion and parking demand. If done inconjunction with proposed improvements to link the Province Lands Bicycle Trail withthe commercial and residential center of Provincetown access throughout this region ofthe Seashore has the potential to significantly reduce reliance on automobiles for accessto these Seashore trails.Preliminary Design Concepts – The design concepts are subject to determination ofa feasible alignment to connect the two trails. Likely consisting of both on-road andshared-use path connections, the designs will need to consider the appropriate elementsfor the context in which the routing takes place. If Route 6 is chosen appropriate<strong>Cape</strong> <strong>Cod</strong> <strong>Regional</strong> <strong>Transportation</strong> <strong>Plan</strong> | August 2011Chapter 5: Bike & PedestrianPage 427
accommodations and safety countermeasures will be needed due to the volume andspeeds of traffic. Shared-use path sections could utilize a paved surface, or a naturalsurface, but any design chosen should provide a firm, stable surface that is compatiblewith bicycle use while also providing access to disabled visitors and complying with ADA.Cost Estimate – Shared-use path, unit costs per mile along varying alignments:• Adjacent to roadway with utility relocation – $765,600.00• Along new alignment – $871,200.00• Existing corridor (minor grading/clearing) – $792,000.00• Along abandoned RR bed – $660,000.00On-road improvements, unit costs per mile:• Signing and striping – $10,560.00• Widening to add shoulders/bike lanes – $501,600.00Assumes adding shoulders, striping and signage along both sides of the road.Recommendations for Implementation – Several existing unpaved trails locatedbetween the beach and the dunes, primarily in Truro, should be considered forenhancements to be made compatible with bicycle travel. However, the parabolic dunesand other sensitive natural features are of concern and impacts need to be avoided ormitigated. The paths could retain natural surfaces to avoid both visual andenvironmental impacts associated with hardening, though the environmental impacts ofsuch use would need to be evaluated. Route 6 provides the only roadway alignment toconnect the two trails and options to avoid an on-roadway facility should be consideredsince it would not be inviting to many less experienced bicyclists.Project 5.3.14 Connect Truro Village Center to Truro DestinationsProject Description – Connecting the two villages and the destinations of Truro via abicycle network is needed to facilitate nonmotorized mobility while also enhancing thevisitor experience to this popular summer destination. Largely rural and comprisedprimarily of the National Seashore, Truro has a number of popular seasonal destinationsincluding Head of the Meadow Trail, Coast Guard Beach, the Highlands Center, HostelInternational, and three campgrounds. Truro’s population and developed areas arelargely located in two village centers; Truro and North Truro, both on <strong>Cape</strong> <strong>Cod</strong> Bay, andwhich are connected primarily via Routes 6 and 6A. Like many other parts of the <strong>Cape</strong>the developed areas are not well connected through a network of secondary roadssuitable for bicycling, often requiring use of collectors and arterials for transit betweendestinations. Aside from destinations within the two village centers most of Truro’sattractions are in the National Seashore and require access along and across Routes 6and 6A. The village centers are currently connected via Mass Bike Route 1, primarilyalong Route 6A and Castle Road, both of which have minimal signage but no physicalaccommodations for bicycles.Chapter 5: Bike & Pedestrian <strong>Cape</strong> <strong>Cod</strong> <strong>Regional</strong> <strong>Transportation</strong> <strong>Plan</strong> | August 2011Page 428
Preliminary Design Concepts – Bicycle connections would largely consist of on-roadimprovements with some off-roadway alignments where needed, based upon the needsand bicycling experience of intended users. A number of unpaved roads within theSeashore could be utilized for connections with very low traffic volumes making bicyclingcomfortable for a variety of users; however hardening would be needed in some locationsto provide an adequate surface, although annual grading would likely provide anacceptable surface on unpaved roads that experience very low vehicle use. Wayfindingsignage should be added consistent with the protocols and designs developed elsewhereon the <strong>Cape</strong>.Adequate shoulders exist on much of Route 6 in Truro, including the short section that isutilized for the Claire Saltonstall Bikeway (Mass Bike Route 1), but the shoulder with isreduced at the junction with Route 6A northward in North Truro. Though Mass BikeRoute 1 diverts onto Route 6A at this point many bicyclists still use Route 6. Interchangeimprovements such as bike lane pockets and/or signage should be considered alongRoute 6 to mitigate potential for conflicts at these weave movements, including at thislocation which requires north-bound bicyclists to make a left turn at an uncontrolledintersection.Cost Estimate – Shared-use path, unit costs per mile along varying alignments:• Adjacent to roadway with utility relocation – $765,600.00• Along new alignment – $871,200.00• Existing corridor (minor grading/clearing) – $792,000.00• Along abandoned RR bed – $660,000.00On-road improvements, unit costs per mile:• Signing and striping – $10,560.00• Widening to add shoulders/bike lanes – $501,600.00Assumes adding shoulders, striping and signage along both sides of the road.Recommendations for Implementation – Coordination between Truro and theNational Park Service will be needed to identify desired routes and to develop plans forconnecting destinations within the village centers and the National Seashore. AnEnvironmental Screening Form would need to be completed for the elements within theSeashore to determine the level of environmental compliance required. Because huntingis allowed in some parts of the Seashore consideration needs to be given to routing ofbicyclists through those areas. Habitat fragmentation is also of concern to CCNS andneeds to be considered. Coordination with Project 5.3.13 is needed to develop continuitybetween Truro destinations and the linkages that are proposed to provide access withinthe National Seashore and between the existing Seashore trails.<strong>Cape</strong> <strong>Cod</strong> <strong>Regional</strong> <strong>Transportation</strong> <strong>Plan</strong> | August 2011Chapter 5: Bike & PedestrianPage 429
Project 5.3.15: Connect Shawme-Crowell State Forest to the <strong>Cape</strong> <strong>Cod</strong> CanalBikewayProject Description – Located in Sandwich, the Shawme-Crowell State Forest isproximate to the <strong>Cape</strong> <strong>Cod</strong> Canal Bikeway but lacks an improved route or facility toconnect them. The forest has a variety of park and camping facilities and lies betweenRoutes 6 and 6A with the main entrance off of Rte 130 (Main Street). The ClaireSaltonstall Bikeway does pass the entrance to the forest though there are no bicycleaccommodations or facilities.Preliminary Design Concepts – The short linkage needed to connect the <strong>Cape</strong> <strong>Cod</strong>Canal Bikeway with the state forest allows for several design alternatives to be utilized.An unused alignment for Bayview Rd near the intersection of Route 6A and 130 couldallow for a shared-use path that would access the back of the state forest. The alignmentis currently cleared almost to the <strong>Cape</strong> <strong>Cod</strong> Canal Bikeway, though it would requireaccess across a rail line. An on-road route could be established using secondaryroadways, preferably with bicycle accommodations provided. The most likely alignmentwould utilize Tupper Road and Main Street although shoulders or bike lanes should beconsidered to improve the existing conditions to increase safety and reduce conflicts withautomobiles on these narrow roads that lack paved shoulders. Other possible on-roadroutes could be utilized, but would be less direct. Any route established should utilizewayfinding signage to direct bicyclists to these two facilities.Cost Estimate – Shared-use path, unit costs per mile along varying alignments:• Adjacent to roadway with utility relocation – $765,600.00• Along new alignment – $871,200.00• Existing corridor (minor grading/clearing) – $792,000.00• Along abandoned RR bed – $660,000.00On-road improvements, unit costs per mile:• Signing and striping – $10,560.00• Widening to add shoulders/bike lanes – $501,600.00Assumes adding shoulders, striping and signage along both sides of the road.Recommendations for Implementation – Several improvements in or adjacent tothis general area have been proposed and should be coordinated to develop a connectedand integrated network of bicycle routes and facilities. Projects 5.2.15 (improvements onTupper Rd. south of Rte 6A) and 5.3.17 (bicycle improvements through the SandwichHistoric District) propose improved bicycle facilities in this immediate area and could becombined into a larger project, especially if this proposed connection to the forestutilizes a route along Tupper Road. Data collected during this feasibility study alsoindicate that existing proposed improvements call for a shared-use path or on-roadimprovements on Route 6A which could also facilitate this needed connection. TheChapter 5: Bike & Pedestrian <strong>Cape</strong> <strong>Cod</strong> <strong>Regional</strong> <strong>Transportation</strong> <strong>Plan</strong> | August 2011Page 430
Claire Saltonstall Bikeway should be realigned to utilize an improved route through thiscorridor if bicycle accommodations are provided as a result of these proposed projects.Project 5.3.16: Connect Wellfleet Bay Wildlife Sanctuary to <strong>Cape</strong> <strong>Cod</strong> RailTrailProject Description – Mass Audubon’s Wellfleet Bay Wildlife Sanctuary is located onWellfleet Harbor and is a popular destination with 5 miles of natural walking trails. Thesanctuary is approximately one mile due west of the <strong>Cape</strong> <strong>Cod</strong> Rail Trail at the pointwhere the CCRT passes through the National Seashore, however the trail is located onthe opposite side of Route 6. Further complicating connection of the CCRT to thesanctuary is the need for a connection across private property. Entrance Road providesaccess to the sanctuary and intersects Route 6 across from the Wellfleet Lodge and theWellfleet Motel where the most direct connection could take place. However, the CCRTparallels Route 6 behind the hotels and access from the CCRT to Route 6 would requirecrossing private property.Preliminary Design Concepts – A shared-use path design typical should be utilizedto provide a short, approximately ¼-mile spur linking the CCRT to Route 6. Moresignificantly consideration and installation the appropriate crossing treatments andcountermeasures are needed at the intersection with Route 6. Route 6 is a 2-lane crosssection with a posted speed of 45 MPH at this location. With the traffic volumesexperienced during peak season and the bicycle and pedestrian access from the CCRT,significant bicycle/pedestrian conflicts with motor vehicles would likely result. Minorimprovements might be needed along Entrance Road to include directional signage andpossibly pavement markings to create awareness of a shared-road environment.Cost Estimate – Shared-use path connection (0.25 miles):• Path along new alignment – $217,800.00On-roadway improvements (.35 miles):• Signing and striping – $3,696.00Improved crossing at Route 6:• Marked Crossing – $1,500.00• Signalized Crossing – $70,000.00Assumes installation of signalized intersection with mast arms, signal heads, pedestriansignals, pavement markings, and appropriate pedestrian upgrades such as curb cuts andADA curb ramps.Recommendations for Implementation – Construction costs associated with theshort spur would be minimal, however access across private property (one of the twohotel properties) could potentially increase the costs significantly. A trail easement<strong>Cape</strong> <strong>Cod</strong> <strong>Regional</strong> <strong>Transportation</strong> <strong>Plan</strong> | August 2011Chapter 5: Bike & PedestrianPage 431
would allow access without the need for costly right of way acquisition and the adjacentproperties of the two lodging properties would provide an alignment directly across fromEntrance Road. The somewhat remote location of this proposed spur and the trail trafficgenerated by the sanctuary would likely minimize any potentially undesirable trafficacross the properties. Additionally, some businesses have welcomed access to regionaltrail facilities, recognizing that it has the potential to serve to attract patrons. Pendingdevelopment of the connection, an engineering study should be conducted to determinethe appropriate level of accommodations needed to facilitate safe crossing of Route 6.Project 5.3.17: Identify Potential Bikeway Alignment through SandwichHistoric DistrictProject Description – The Sandwich Historic District lies just to the east of theterminus of the <strong>Cape</strong> <strong>Cod</strong> Canal Bikeway, though there are no designated bike routesthrough Sandwich. A shared-use path through the district likely holds appeal to many,however such an alignment would prove difficult due to lacking right of way. Old King’sHighway (Route 6A) borders the district to the south and is the primary route throughSandwich. Roadways along <strong>Cape</strong> <strong>Cod</strong> Bay are discontinuous and limit the availability ofalternate routes through town.Preliminary Design Concepts – Largely consisting of on-road bike routes the alignmentshould consider the existing conditions and whether shared-road conditions andgeometrics are adequate or in need of improvements. At the least wayfinding signage isneeded, especially for any alignment along secondary roads. Cul-de-sacs and dead-endresidential streets may present challenges in identifying a route, however shortconnections between these types of streets should be considered where appropriate tofacilitate bicycle and pedestrian route connections while still preventing automobilethrough traffic.Cost Estimate – Shared-use path, unit costs per mile along varying alignments:• Adjacent to roadway with utility relocation – $765,600.00• Along new alignment – $871,200.00• Existing corridor (minor grading/clearing) – $792,000.00• Along abandoned RR bed – $660,000.00On-road improvements, unit costs per mile:• Signing and striping – $10,560.00• Widening to add shoulders/bike lanes – $501,600.00Assumes adding shoulders, striping and signage along both sides of the road.Recommendations for Implementation –The route alignment should considerdirectness, ability to access destinations, and the possibility of short connectionsbetween streets that are not currently linked. The Claire Saltonstall Bikeway, also knownChapter 5: Bike & Pedestrian <strong>Cape</strong> <strong>Cod</strong> <strong>Regional</strong> <strong>Transportation</strong> <strong>Plan</strong> | August 2011Page 432
as Mass Bike Route 1 follows Route 6 to the south of the Sandwich Historic District. Dueto the existing conditions along Route 6 any improved alignment through Sandwichshould consider the realignment of this long-distance bike route along an improvedroute. Coordination with Projects 5.2.15, 5.3.15, and particularly 5.3.7 (the proposed“Bay Route”) will help to ensure continuity and establishment of a connected bicyclenetwork. Projects providing regional connections may also be viewed more favorablywith regards to obtaining funding and can be implemented by multiple localities.Project 5.3.18: Identify and Implement “OBHC Triangle” RouteProject Description – Orleans, Brewster, Harwich, Chatham constitute a roughlytriangular area that occupies the region where the Outer <strong>Cape</strong> begins. Limited routeavailability due to a lack of a network of secondary roads that connect these towns willmake difficult the development of a suitable bicycle route of approximately 30 milesconstituting the “OBHC Triangle”. The towns are largely interconnected via routes 6A,39, 28, 137, and 124; all of which have little to no accommodations for bicycles and whichhave considerable vehicular traffic, especially during peak season. Nickerson State Parklies in the center of the region further contributing to the traffic in the region.Preliminary Design Concepts – Envisioned as an on-roadway route linking the fourtowns, a designated route will need to consider roadway improvements in order toadequately accommodate bicycle travel, especially by cyclists other than experiencedcyclists comfortably riding in a shared-roadway environment. Some paved shouldersexist, though in most instances they are inadequate to serve as a bicycle accommodationand are discontinuous. Addition of paved shoulders or traffic control deviceshighlighting a shared-roadway condition should be considered. Such measures couldinclude “share the road” signage or use of “sharrows” officially known as shared lanemarkings. Along roadway segments where adequate paved width exists or may be easilyadded, designated bike lanes may be considered as appropriate.Cost Estimate – On-road improvements, unit costs per mile:• Signing and striping – $10,560.00• Widening to add shoulders/bike lanes – $501,600.00Assumes adding shoulders, signs, and pavement markings along both sides of the road.Recommendations for Implementation – Due to limited routing optionsimplementation will require selection of a route and evaluation of existing conditions todetermine needed improvements and countermeasures. Coordination with Projects5.3.6, 5.3.7 (the proposed “Shore” and “Bay” routes respectively), and 5.3.10 will ensurethat proposed improvements are consistent throughout the region. Since those proposedroutes are of a regional nature segments of the “OBHC” route that are coordinated withthese projects will likely receive greater priority for funding. Emphasis of the efforts tointegrate these proposed routes into a cohesive network linking towns and destinationswould likely increase the potential for funding.<strong>Cape</strong> <strong>Cod</strong> <strong>Regional</strong> <strong>Transportation</strong> <strong>Plan</strong> | August 2011Chapter 5: Bike & PedestrianPage 433
Project 5.3.19 Improve Bicycling Conditions on Route 130 in SandwichProject Description – Bicycling conditions along Route 130 (Forestdale Road/WaterStreet/Main Street) in Sandwich are currently challenging with little or no pavedshoulder, significant traffic volume, and a posted speed limit of 40 MPH. Adding pavedshoulders or other bicycle improvements would provide safer, more comfortablebicycling conditions while also reducing conflicts with motor vehicles. Route 130provides connections to destinations, neighborhoods and the adjacent town of Mashpee.Adding paved shoulders has additional benefits including pavement edge stabilization,the addition of a recovery area which reduces roadway departure crashes, and abreakdown area that allows disabled vehicles to be moved out of the travel lane, therebymitigating congestion impacts from such incidents. These all result in safety,operational, and maintenance benefits which yield long-term cost savings.Preliminary Design Concepts – Widening or the addition of paved shoulders shouldconsider the existing roadway geometrics. In order to be useful for bicycle travelshoulders and the adjacent travel lane need to be of adequate widths to provide a degreeof separation between the two modes, otherwise safety can be impaired by invitingmotorists to pass too closely to bicyclists that attempt to hug the outside edge of theroadway. In general a four foot shoulder is desirable to provide adequate operatingspace for a bicyclist while allowing motorists unimpeded travel within the adjacent lane.On roads with curb and gutter, the gutter pan and the longitudinal joint effectivelyreduces the useable width of the shoulder and consideration needs to be given to thepaved width of the shoulder exclusive of the gutter pan.Cost Estimate – On-road improvements, unit costs per mile:• Widening to add shoulders/bike lanes – $501,600.00Assumes adding shoulders along both sides of the road.Recommendations for Implementation – Opportunities should be sought to beginimplementing improvements through coordination with other construction andmaintenance projects. Routine pavement overlay and resurfacing projects shouldinclude shoulder paving for this route. Maintenance needs to be considered so that thefunctionality of shoulders for bicycling purposes is retained since the natural sweepingaction of vehicles often results in debris accumulating in the untraveled shoulder.Project 5.3.20: Improve Bicycling Conditions on Quaker Meeting HouseRoad in SandwichProject Description – Sandwich Quaker Meeting House Road is located in a heavyresidential area and the roadway currently has intermittent facilities with short segmentsof shared-use paths connecting some subdivision developments. The roadwaygeometrics consist of a two-lane secondary roadway with minimal paved shoulders. As aChapter 5: Bike & Pedestrian <strong>Cape</strong> <strong>Cod</strong> <strong>Regional</strong> <strong>Transportation</strong> <strong>Plan</strong> | August 2011Page 434
esult, the discontinuous nature of the infrastructure makes travel by bicycle difficult foranyone not comfortable with riding in a shared travel lane with automobile traffic. Thereare numerous points of destination along Quaker Meeting House Road includingSandwich High School, Oak Ridge School, and a municipal complex that justify the needfor bicycle accommodations. The town is currently constructing a continuous sidewalkalong the entire length of Quaker Meeting House Road from Route 6A to Route 130. TheTown desires to widen the existing roadway to provide 11’ lanes and 4’ shoulders in bothdirections in conformance to state requirements for bicycle accommodations. Theproposed projects are fully designed and are “shovel ready” but are unfunded.Preliminary Design Concepts – Roadway improvements along Quaker MeetingHouse Road to provide 11’ travel lanes and 4’ paved shoulders. On-roadwayimprovements and accommodations are needed to provide direct, comfortable bicycleaccess to the many destinations in this residential area. Shoulder widening, pavementmarkings, signage, intersection enhancements, and other safety countermeasures alongwith wayfinding measures would provide a convenient and comfortable route for cyclistsof varying abilities.Cost Estimate – On-road improvements, unit costs per mile:• Signing and striping – $10,560.00• Widening to add shoulders/bike lanes – $501,600.00Sidewalks and crossing improvements, unit costs:• 5’ Sidewalks, bituminous, both sides of street – $120.00/linear foot• 5’ Sidewalks, concrete, both sides of street – $140.00/linear foot• Marked Crossing – $1,500.00Recommendations for Implementation – Identification of funding sources andprogramming of funds is needed to facilitate implementation since the projects are fullydesigned. Final designs should be reviewed for appropriate integration with the existingbicycle infrastructure on Quaker Meeting House Road and improvements to the existinginfrastructure, if needed, should be considered in order to provide continuity in theaccommodations.Project 5.3.21: Establish a Bicycle & Pedestrian Connection from Fort HillArea Trails to Governor Prence RoadProject Description – The Town of Eastham, through its <strong>Plan</strong>ning and EconomicDevelopment Department, has identified the Governor Prence Road, a major access tothe Red Maple Swamp and Fort Hill Trail, as the only major crossing of Route 6 thatdoes not have a traffic signal. The Eastham Visitor’s Center is also located at thisintersection which maintains high traffic volumes, has significant left turns, and is a highcrash location. As a result warrants should be easily met to justify a traffic signal. Apedestrian actuated traffic signal at this intersection will encourage residents andvacationers, who now drive to Fort Hill or Hemenway Beach to bike or walk to these<strong>Cape</strong> <strong>Cod</strong> <strong>Regional</strong> <strong>Transportation</strong> <strong>Plan</strong> | August 2011Chapter 5: Bike & PedestrianPage 435
popular destinations. Sidewalks or shared-use paths are needed to establish a connectedand contiguous pedestrian access route between the Fort Hill trails and Governor PrenceRoad which intersects the <strong>Cape</strong> <strong>Cod</strong> Rail Trail less than one mile west of thisintersection. Improved bicycle conditions linking the CCRT with Fort Hill are alsoneeded.Preliminary Design Concepts – Depending upon traffic volumes, speeds, andlocation of pedestrian trip generators, sidewalks should be considered along both sides ofthe street. Appropriate marked crosswalks and signage, consistent with the roadwaygeometrics and existing traffic patterns should be installed at intersections where theheaviest pedestrian movements are likely to occur. Additional pedestrian safetycountermeasures should be considered where appropriate.Cost Estimate – Shared-use path, unit costs per mile along varying alignments:• Adjacent to roadway with utility relocation – $765,600.00On-road improvements, unit costs per mile:• Signing and striping – $10,560.00• Widening to add shoulders/bike lanes – $501,600.00Sidewalks and crossing improvements, unit costs:• 5’ Sidewalks, bituminous, both sides of street – $120.00/linear foot• 5’ Sidewalks, concrete, both sides of street – $140.00/linear foot• Marked Crossing – $1,500.00• Signalized Crossing – $70,000.00Assumes installation of signalized intersection with mast arms, signal heads, pedestriansignals, pavement markings, and appropriate pedestrian upgrades such as curb cuts andADA curb ramps.Recommendations for Implementation – Gaps within the existing pedestrian andbicycle network should be identified for improvements concurrent with the installationof a traffic signal. Appropriate safety countermeasures should be considered for locationswhere potential exists for vehicle/pedestrian collisions, primarily at the intersection ofGovernor Prence and Route 6, as well as along Governor Prence if a connection to theCCRT is desired. Improvements should also seek to improve access to transit stops whenappropriate.Project 5.3.22: Define Loops and Connections to Develop a “Grand <strong>Cape</strong>Tour” Along the <strong>Cape</strong> <strong>Cod</strong> Rail TrailProject Description – The <strong>Cape</strong> <strong>Cod</strong> Rail Trail currently serves as a major bicyclefacility stretching twenty two miles across six of <strong>Cape</strong> <strong>Cod</strong>’s municipalities. Proposedextensions to the north and west would provide access to four additional localities. AChapter 5: Bike & Pedestrian <strong>Cape</strong> <strong>Cod</strong> <strong>Regional</strong> <strong>Transportation</strong> <strong>Plan</strong> | August 2011Page 436
Grand <strong>Cape</strong> Tour would provide visitors to <strong>Cape</strong> <strong>Cod</strong> with bicycle access to towns andSeashore destinations with the CCRT serving as the spine route. Loop routes and spursthat provide direct bicycle access would also result in a connected bicycle networkthroughout much of the lower and outer <strong>Cape</strong> that could be used for utility trips as well.Preliminary Design Concepts – Loop routes and access routes would likely consistof on-road bike routes and shared-use paths depending upon the specific conditions.Each proposed alignment should consider the existing conditions and whether sharedroadconditions and geometrics are adequate or in need of improvements, or whether ashared-use path would be most appropriate for the intended and likely user. Wayfindingsignage is needed, especially for any alignment along secondary roads.Cost Estimate – Shared-use path, unit costs per mile along varying alignments:• Adjacent to roadway with utility relocation – $765,600.00• Along new alignment – $871,200.00• Existing corridor (minor grading/clearing) – $792,000.00• Along abandoned RR bed – $660,000.00On-road improvements, unit costs per mile:• Signing and striping – $10,560.00• Widening to add shoulders/bike lanes – $501,600.00Assumes adding shoulders, striping and signage along both sides of the road.Recommendations for Implementation –The route alignments should considerdirectness, ability to access destinations, and the potential to integrate with the largerbicycle network envisioned for <strong>Cape</strong> <strong>Cod</strong>. Though intended to serve as a contiguousroute throughout the entire area of the existing and proposed CCRT, such a networkwould facilitate bicycle use for commuting and routine utility trips in addition torecreation and tourism. Linkages therefore should consider popular tourism sites as wellas town centers and commercial areas. Coordination with projects that are proximate tothe existing CCRT, as well as future extensions would ensure development of a connectednetwork of bicycle routes and facilities. Coordination of multiple localities, the <strong>Cape</strong> <strong>Cod</strong>Commission, and Massachusetts Department of Conservation and Recreation will berequired.5.4.4 OTHER INITIATIVESThe following is a list of nine projects proposing various initiatives to support andimprove bicycling on <strong>Cape</strong> <strong>Cod</strong>. These projects are number 5.4.1 through 5.2.9.Project 5.4.1: Bike Route Brochure & Wayfinding MapProject Description – A multi-phase project proposing to develop and maintain abrochure, including a wayfinding map that describes the primary destinations accessible<strong>Cape</strong> <strong>Cod</strong> <strong>Regional</strong> <strong>Transportation</strong> <strong>Plan</strong> | August 2011Chapter 5: Bike & PedestrianPage 437
y bicycle including recreation features of pocket parks, beaches, town landings,shopping districts, hiking areas, bike paths, and other facilities and attractions followedby a subsequent implementation phase with wayfinding improvements along a pilotroute.Currently inconsistent signage and pavement markings throughout the <strong>Cape</strong> results inimpaired safety and a poor visitor experience. Destination access is difficult due to thelack of wayfinding and directional signage which contributes to low use of bicycling andbicycle facilities for basic mobility and transportation to access destinations, resulting inover-reliance on autos, especially by visitors not familiar with <strong>Cape</strong> <strong>Cod</strong>. This in turncontributes to congestion and excessive parking demand. By encouraging andfacilitating the use of bicycling as an alternative transportation mode improvements toair quality (all of <strong>Cape</strong> <strong>Cod</strong> is a non-attainment area), reduced congestion, and reducedimpacts to sensitive lands and natural features resulting from illegal spillover parking,especially in the National Seashore, can be achieved.The project will also yield safety improvements by addressing existing conditions whichinclude lacking or inconsistent signage, pavement markings, and inadequate designtreatments at intersections. Motorist and bicyclist/pedestrian expectations and actionsare not uniform, crossings are often inadequate, and design treatments are inconsistentand often don’t comply with MUTCD (the Manual on Uniform Traffic Control Devices)standards.Component A – Conduct a Pilot Study to apply signage to one connector route. Thisproposed element is a follow-on to Project 5.2.2 and would utilize the wayfindingstandards and protocols established via that project.This component would require the following steps:• Identify candidate routes that facilitate mobility and connection to multipledestinations• Identify the pilot route for implementation• Establish baseline data collection needs for comparison after pilotimplementation• Collect baseline dataComponent B – Implement signage and pavement markings along pilot routeComponent C – Develop six wayfinding itineraries with maps for bicycling experienceson <strong>Cape</strong> <strong>Cod</strong> to facilitate connection via bike or walking to destinations and attractionswithin Seashore and local communities, to include:• <strong>Cape</strong> historic resources• trail amenities including restaurants, rest rooms, accommodations, retailshopping area, bike repair/rental shops and emergency services• connections to intermodal transportation facilities including bus and ferryterminals/connectionsChapter 5: Bike & Pedestrian <strong>Cape</strong> <strong>Cod</strong> <strong>Regional</strong> <strong>Transportation</strong> <strong>Plan</strong> | August 2011Page 438
• Sand (surface hazard) and other cautionary items• connections to other bicycle facilities including the Pan Mass Challenge Routeand the Mass Bike Route 1 (Claire Saltonstall Bike Route)• connections to primary destinations (Seashore attractions, town centers)• communicating mobility issues for access by different users (ADA issues)• coordination of all 6 regions to create larger overall “regional experience”The data collection needed for Component A should also consider surveying bicyclistsand users of bicycle routes and facilities regarding needed or desired content and theease with which they can currently navigate the bicycle network on <strong>Cape</strong> <strong>Cod</strong>.Preliminary Design Concepts – Installation of signage and wayfinding amenitiesshould follow the protocols and guidance established as a result of Project 5.2.2 forexisting facilities, relating to signage and wayfinding on the CCRT. Wayfindingitineraries and maps should be printed on water resistant stock and be either pocketsizedallowing use by bicyclists or pedestrians. Maps and related print documentsshould be made available in electronic format as well and updated regularly. Electronicversions have the added benefit of being able to provide more current content, and evenreal-time information such as trail closings and conditions, and links to transitschedules.Cost Estimate –• Signage installation on pilot route – $18,400 per mile• Maps and wayfinding itineraries – $120,000Recommendations for Implementation – Signage, wayfinding, and pavementmarking guidelines and protocol need to be established prior to implementation, eithervia Project 5.2.2 associated with signage of the CCRT, or as a separate effort. Pilot routeselection should follow the implementation guidance established in Project 5.3.2 byidentifying potential connector routes or corridors, evaluating the alternative, anddetermining the specific pilot route. It will also be necessary to determine the baselinedata that needs to be captured or collected, and the process by which that will beaccomplished before the second phase involving signage installation can proceed.Additionally, data collection should include bicyclist’s perception of current wayfindingresources and their needs or desires for content in the printed product. An opportunityfor feedback on the printed product should be included such as a survey or an onlineform that can capture impressions of the quality of the guide/map and needed changesor suggested improvements. Due to the regional focus and the implications for towns,coordination is needed between towns as well as with the Massachusetts Office of Traveland Tourism (MOTT). Coordination with Intelligent <strong>Transportation</strong> Systems couldprovide real-time information and enhance wayfinding and transit service integration.<strong>Cape</strong> <strong>Cod</strong> <strong>Regional</strong> <strong>Transportation</strong> <strong>Plan</strong> | August 2011Chapter 5: Bike & PedestrianPage 439
Project 5.4.2: Establish Nonprofit for Stewardship of the <strong>Cape</strong> <strong>Cod</strong> Rail TrailProject Description – Form a nonprofit 501(c)3 alliance for stewardship of the entire& future <strong>Cape</strong> <strong>Cod</strong> Rail Trail. The CCRT currently provides a continuous 22 mile facilitythat serves as bike and pedestrian corridor through the Outer and Lower <strong>Cape</strong>, providingaccess to communities and attractions on <strong>Cape</strong> <strong>Cod</strong>, including the National Seashore.However visions exist for a facility that will extend throughout the entire length of theOuter and Lower <strong>Cape</strong>, connecting Hyannis to Provincetown, and providing multimodalaccess to much of <strong>Cape</strong> <strong>Cod</strong>. A facility of this size would benefit from the guidance andstewardship of a nonprofit organization to ensure proper care and maintenance, addressoperational and safety considerations, especially those related to improvements andphysical extensions to service new locations, and to help remove or reduce barrierswithin the community to expanding the facility to serve additional towns anddestinations on <strong>Cape</strong> <strong>Cod</strong> via advocacy and generating support for the expansion of thefacility.Preliminary Design Concepts – NACost Estimate –• $70,000.00Recommendations for Implementation – The primary focus of the no-profit needsto be established and a commensurate framework for the organization developed.Similar organizations have been developed for other trail facilities with widely varyingmissions, from safety patrols, to routine maintenance and caretaking efforts such as“adopt a trail” efforts, to broader advocacy and stewardship endeavors aimed atenhancing and expanding a facility and serving to raise funds and support from the localcommunity, including elected officials and business leaders.The scope of the organization needs to be determined along with establishment of agoverning body to ensure proper management of both the organization as well as toprovide direction for a course of action to be taken and sustained. A board or other bodythat is assembled for this purpose should consider carefully the makeup (members)needed to adequately address the and achieve the desired functions.Project 5.4.3: <strong>Cape</strong> <strong>Cod</strong> Nonmotorized Master <strong>Plan</strong>Project Description – Develop a nonmotorized transportation master plan for <strong>Cape</strong><strong>Cod</strong> that consolidates and integrates facilities, routes, and accommodations for bicyclistsand pedestrians, including those owned or managed by localities, the National ParkService, and nonprofit organizations (such as conservation groups) into a single coherentnetwork. Existing route and network plans, proposed facilities, identified gaps and gapanalyses, policies for addressing the needs of bicyclists and pedestrians, and a prioritizedlist of projects and supporting initiatives across jurisdictions and stakeholder agenciesneeds to be established in order to adequately integrate and coordinate bicycleaccommodations throughout <strong>Cape</strong> <strong>Cod</strong>.Chapter 5: Bike & Pedestrian <strong>Cape</strong> <strong>Cod</strong> <strong>Regional</strong> <strong>Transportation</strong> <strong>Plan</strong> | August 2011Page 440
Preliminary Design Concepts –The development of a master plan should seek toestablish uniformity in standards and design guidelines, as well as consistency of policiesand approaches to providing bicycle and pedestrian accommodations across <strong>Cape</strong> <strong>Cod</strong>.The plan should ensure continuity both in developing and connecting bicycle andpedestrian networks and in the actual design and construction of facilities, especiallywhen they cross jurisdictional boundaries in order to facilitate mobility and access bybicyclists and pedestrians as well as to provide a consistent level of service.Cost Estimate – Subject to scoping detailsRecommendations for Implementation – Of primary importance is coordinationacross municipalities, including funding requests and applications and regionalprioritizing of projects. Existing plans should be evaluated for shared visions anddesired projects, as well as to establish consistency in facility design especially atjurisdictional boundaries to ensure continuity of infrastructure and accommodationsalong bicycle routes.Project 5.4.4: Development of Trail Access Parking AgreementsProject Description – Develop agreements with schools to use school parking lotsduring off-times for trail parking to in order to alleviate parking demands resulting fromtrail use. With limited parking available and thousands of daily users of trail facilities on<strong>Cape</strong> <strong>Cod</strong> during peak summer season, parking demand can create problems withfinding adequate parking at or near trailheads. The use of public parking infrastructureat schools during non-school hours will mitigate excessive parking demand while alsoutilizing existing parking facilities, thereby eliminating the need to construct additionalcapacity specifically for trail access. Shared parking efforts similar to this haveeliminated added expenses while also increasing the utilization of an existing publicresource.Preliminary Design Concepts – NACost Estimate – NARecommendations for Implementation – A model agreement should be developedthat can be shared among <strong>Cape</strong> <strong>Cod</strong> localities. Standard signage and policies should bedeveloped to ease implementation and retain uniformity at multiple locations. Localpolitical issues will need to be addressed, however this approach provides an opportunityfor facility sharing which increases the utilization of existing infrastructure whilereducing the need for construction of additional parking facilities, many of which will beunutilized much of the year. Use of school facilities could be limited to time of dayand/or time of year to provide additional parking capacity during peak season whichcoincides with school closures for summer break.<strong>Cape</strong> <strong>Cod</strong> <strong>Regional</strong> <strong>Transportation</strong> <strong>Plan</strong> | August 2011Chapter 5: Bike & PedestrianPage 441
Project 5.4.5: Safety Education & OutreachProject Description – Develop and implement an education and outreach initiativeaimed at bicyclists and motorists with the intent of improving safety for bicyclists. Withbicycling on <strong>Cape</strong> <strong>Cod</strong> being popular for both recreation and transportation there is asignificant need to ensure safety is improved by addressing the human factors related tobicycle crashes, bicycle/motor vehicle collisions, and interactions between roadwayusers. Since human factors are a major contributor to bicycle/motor vehicle crashes thisis a low cost/high value project.Preliminary Design Concepts – NACost Estimate – NARecommendations for Implementation – Education and outreach initiatives cancomprise a broad range of strategies. <strong>Cape</strong> <strong>Cod</strong> stakeholders should develop a strategicapproach to developing and deploying resources by identifying the primary issues thatneed to be addressed, target populations, and the commensurate strategies that shouldbe investigated. Overly broad approaches are likely to be less effective than those aimedat addressing specific challenges and problems that currently exist. A number of safetyand educational initiatives and corresponding materials currently exist aroundMassachusetts and the U.S. Existing resources should be evaluated to determine which,if any can serve as a template for the materials and initiative to be utilized by <strong>Cape</strong> <strong>Cod</strong>communities.Project 5.4.6: Maintenance Program Development & ImplementationProject Description – Develop and implement a maintenance program to ensureappropriate and routine maintenance is provided for bicycle facilities andaccommodations. Because bicycle facilities and accommodations are often outside of theroad right of way or at the least are located along the margins of transportation facilities,they often do not receive the maintenance that is provided to roadway networks.Additionally, bicycle facilities will have maintenance needs that are different than thoseof roadways by virtue of their use and operation. On-roadway facilities such as bikelanes and shoulders often accumulate debris as a result of the natural sweeping action ofmotor vehicles pushing debris outward from the travel lanes, but not beyond theshoulder or bike lane. On roads with shoulder typical sections debris, notably loose soilsand sand, tends to encroach and collect on the shoulder as well. As a result the bicycleaccommodation can become virtually impassable while also constituting a crash or tirepuncture hazard.Drainage grates also pose a significant hazard to bicyclists as a result of raised verticaledges which can damage tires and wheels or deflect a wheel sideways causing a crash.Worse are grates with longitudinal openings that can trap a bicycle wheel, throwing theChapter 5: Bike & Pedestrian <strong>Cape</strong> <strong>Cod</strong> <strong>Regional</strong> <strong>Transportation</strong> <strong>Plan</strong> | August 2011Page 442
ider from the bike. Grate installation, repair, and replacement policies and practicesshould utilize bicycle-friendly grate designs, location outside of the bicycle path of travelif possible, and maintenance which maintains a smooth, flush transition from pavementto grate.Shared-use paths and rail-trails outside of road rights of way often do not receive routinemaintenance. As a result conditions often deteriorate to the point that the facility is notinviting or perhaps even results in compromised safety. A routine maintenance programand budgeting enhances the utility of a facility and can serve to expand the service lifethrough preventive maintenance.Preliminary Design Concepts – NACost Estimate – NARecommendations for Implementation – The many bicycle accommodations on<strong>Cape</strong> <strong>Cod</strong> are the responsibility of a variety of entities, including state and localgovernment. Coordination between stakeholders, memorandums of understanding, andidentification of funding sources will be needed in addition to the development of thepolicies and programmatic elements. If development of a 501(c)3 nonprofit trailadvocacy group proceeds their role in maintenance should be incorporated into theseefforts. Routine evaluation of conditions and planning for maintenance should beincorporated into other infrastructure maintenance policies, activities, and budgets.Project 5.4.7: Interpretive Film Promoting <strong>Cape</strong>-Wide Bicycle Network andBicycle SafetyProject Description – Many of the attributes that make <strong>Cape</strong> <strong>Cod</strong> a populardestination are accessible and enjoyable by bicycle. As efforts to expand the bicyclenetwork on <strong>Cape</strong> <strong>Cod</strong> continue, bicycling as both recreation and a transportation modeon the <strong>Cape</strong> will continue to grow in popularity. Currently many of the bicyclingresources on the <strong>Cape</strong> are not widely known and an interpretive film could serve to bothincrease awareness of bicycling options on the <strong>Cape</strong>, as well as aiding people navigate the<strong>Cape</strong>’s bicycle network and utilize it for accessing destinations and increasing theirmobility on the cape without reliance on automobiles. Additionally, interactions withpedestrians on shared-use paths and motorists on shared roadways results in unsafeconditions at times. Incorporating bicycle safety content into the film provides anopportunity to present safety information in a medium that would likely be betterreceived than that of a stand-alone safety message.Preliminary Design Concepts – NACost Estimate – NARecommendations for Implementation – The proposed film should be available asan online resource and opportunities should be identified to publicize links to the<strong>Cape</strong> <strong>Cod</strong> <strong>Regional</strong> <strong>Transportation</strong> <strong>Plan</strong> | August 2011Chapter 5: Bike & PedestrianPage 443
website. MassBike, other bicycle advocacy or safety organizations, and bicycle clubscould assist in disseminating information on the availability of this resource once it isdeveloped and available.Project 5.4.8: Enhance Bicycle Shuttling OpportunitiesProject Description – As a result of the many gaps in the existing bicycleinfrastructure on the <strong>Cape</strong>, there is a need for convenient and widely accessible bicycleshuttling between destinations. Currently there are a number of transit services on <strong>Cape</strong><strong>Cod</strong> and most buses and transit vans are outfitted with bicycle racks that canaccommodate up to two bicycles. Long headways, infrequent service, and occasionallyheavy demand during peak season however can significantly reduce the utility of thesetransit services, especially when considering the need for a family or group of bicycliststo use shuttle services. Increased capacity and more frequent service, especially in theareas of greatest demand is needed.Preliminary Design Concepts – NACost Estimate – NARecommendations for Implementation – This project would assume that bicycleshuttling is limited to bus services. The <strong>Cape</strong> <strong>Cod</strong> <strong>Regional</strong> Transit Authority shouldwork with localities and the National Park Service to identify destinations, routes, andservice times that are in need of augmentation. Options for outfitting shuttle vehicleswith increased bicycle capacity should be investigated.Project 5.4.9: Utilize Utility Easements and Infrastructure projects toEstablish Bicycle Routes and CorridorsProject Description – Use of utility rights of way and easements for bicycle routes andcorridors has the potential to both increase the options for bicycle routes, while alsoreducing costs related to acquisition of right of way. Existing utility corridors are alsoalready free of many of the physical barriers that can make difficult the development of abicycle network. Such corridors are often already cleared and may also have somedegree of access, often in the form of unpaved roads or trails that are used for utilitymaintenance. Use of theses corridors also have the benefit of providing bicycle facilitiesthat are largely free of conflicting vehicle movements as occur at intersections withroadways and commercial entrances when a path is located beside a roadway. In someinstances utility corridors are the only feasible connections between communities andexisting or proposed bicycle facilities, such as the proposed route across Harwich. Thereare numerous examples of co-use of utility corridors for transmission and recreationaluse including several in Massachusetts. Many utility corridors are currently usedinformally for recreational activities, however in most cases they are private propertyowned by the respective utility company or utility easements on private property.Several factors need to be considered when evaluating co-use of these corridorsincluding:Chapter 5: Bike & Pedestrian <strong>Cape</strong> <strong>Cod</strong> <strong>Regional</strong> <strong>Transportation</strong> <strong>Plan</strong> | August 2011Page 444
Public exposure- State and federal laws govern the separation distance betweenpeople, equipment and some utilities especially electrical transmission lines.Recreational use cannot create additional risk of damage to utility structures ortransmission facilities. Activities cannot preclude future construction or expansion ofthe utilities within the right-of-way. Access to/from, and along the right-of-way formaintenance, emergency repairs or future expansion cannot be impeded by recreationaluse. Recreational use must include a management plan that addresses trash collectionand prevention/repair of erosion. Additional impacts to sensitive environmentalresources will be viewed as a negative.Preliminary Design Concepts – NACost Estimate – variableRecommendations for Implementation – Use of utility corridors can requirecomplex legal agreements. Additionally, in some instances the utility has an easementbut does not own the right of way, requiring the involvement of multiple parties toinclude the actual land owner. Conservation easements should also be investigated todetermine if these can be used to encourage dedication of right of way in the existingutility corridors, whether from the utility company or a third part landowner. Pavedtrails may enhance maintenance access in some corridors, thereby yielding a positivebenefit to the utility company. The 48-mile W&OD Trail in northern Virginia is a primeexample of a long-distance bike path that can be facilitated through the use of a utilitycorridor.<strong>Cape</strong> <strong>Cod</strong> <strong>Regional</strong> <strong>Transportation</strong> <strong>Plan</strong> | August 2011Chapter 5: Bike & PedestrianPage 445
ProjectTABLE 3 - LIST OF MAPPED PROJECTSProject Description5.2.1 Proposed shared-use path corridor for CCRT Extension to Provincetown5.2.3 Setucket Road Path intersection improvements5.2.5 Brackett Rd & Rte 6 sidewalks and improved crossings5.2.6 <strong>Cape</strong> <strong>Cod</strong> Rail Trail extension to Independence Park5.2.7 <strong>Cape</strong> <strong>Cod</strong> Rail Trail extension to Hyannis <strong>Transportation</strong> Center5.2.8 Connect Old Colony Rail Trail and Old Queen Anne Road via Route 137Old Colony Rail Trail extension from Volunteer Park and access to Schoolhouse5.2.9 Pond5.2.10 Connect Shining Sea Bikeway to Gifford Street via on-road route5.2.11 Extend Shining Sea Bikeway through Bourne to <strong>Cape</strong> <strong>Cod</strong> Canal Bikeway5.2.13 Connect <strong>Cape</strong> <strong>Cod</strong> Canal Bikeway to Hyannis <strong>Transportation</strong> Center5.2.14 Develop <strong>Plan</strong> for Intermodal Center in Falmouth5.2.15 Improve Bicycle Facilities on Tupper Road South of Route 6AFeasibility Study & Design of Bike Path along Route 6 from Herring Cove Parking5.3.2 to Race Point RoadIdentify Possible Connections between the <strong>Cape</strong> <strong>Cod</strong> Rail Trail and National5.3.3 Seashore TrailsIdentify a “Shore Route” South of Route 28 from Woods Hole in Falmouth to5.3.6 Stage Harbor in Chatham5.3.7 Identify a “Bay Route” from the <strong>Cape</strong> <strong>Cod</strong> Canal in Bourne to Orleans5.3.8 Relocation of Existing Rail Line and Conversion to Trail5.3.9 Connect Harwich Port to Old Colony Rail Trail5.3.10 Designate Route 28 as a Bike Route and Improve Conditions5.3.12 Connect MacMillan Pier to National Seashore Bicycle Paths5.3.13 Connect Province Lands Bicycle Trail and Head of the Meadow Trail5.3.16 Connect Wellfleet Bay Wildlife Sanctuary to <strong>Cape</strong> <strong>Cod</strong> Rail Trail5.3.17 Identify Potential Bikeway Alignment through Sandwich Historic District5.3.18 Identify and Implement “OBHC Triangle” Route5.3.19 Improve Bicycling Conditions on Route 130 in Sandwich5.3.20 Improve Bicycling Conditions on Quaker Meeting House Road in SandwichEstablish a Bicycle & Pedestrian Connection from Fort Hill Trails to Governor5.3.21 Prence RoadChapter 5: Bike & Pedestrian <strong>Cape</strong> <strong>Cod</strong> <strong>Regional</strong> <strong>Transportation</strong> <strong>Plan</strong> | August 2011Page 446
FIGURE 59 – CCNS UPPER/MID-CAPE MAPPED PROJECTS<strong>Cape</strong> <strong>Cod</strong> <strong>Regional</strong> <strong>Transportation</strong> <strong>Plan</strong> | August 2011Chapter 5: Bike & PedestrianPage 447
FIGURE 60 - CCNS LOWER/OUTER-CAPE MAPPED PROJECTSChapter 5: Bike & Pedestrian <strong>Cape</strong> <strong>Cod</strong> <strong>Regional</strong> <strong>Transportation</strong> <strong>Plan</strong> | August 2011Page 448
FIGURE 61 - CCNS UPPER/MID-CAPE PRIORITY CORRIDORS<strong>Cape</strong> <strong>Cod</strong> <strong>Regional</strong> <strong>Transportation</strong> <strong>Plan</strong> | August 2011Chapter 5: Bike & PedestrianPage 449
FIGURE 62 – CCNS LOWER/OUTER-CAPE PRIORITY CORRIDORSChapter 5: Bike & Pedestrian <strong>Cape</strong> <strong>Cod</strong> <strong>Regional</strong> <strong>Transportation</strong> <strong>Plan</strong> | August 2011Page 450
5.5 CONCLUSIONBicycle and pedestrian transportation are non-motorized forms of transportation. Theinfrastructure for bicycles and pedestrians, such as bicycle paths, bicycle routes, andsidewalks, must follow federal, state, and local design standards in order to ensure safetyand accessibility. There are 83.8 miles of bicycle paths on <strong>Cape</strong> <strong>Cod</strong>, and 333 miles ofbicycle routes. Among these are the <strong>Cape</strong> <strong>Cod</strong> Rail Trail, Shining Sea Bike Path, and theClaire Saltonstall Bikeway. For all paved roads on <strong>Cape</strong> <strong>Cod</strong>, 8.5% have a sidewalk. Lowvolume roads can also be used by bicyclists and pedestrians. Beyond the actualinfrastructure, amenities such as bicycle racks, benches, restrooms, showers, and lockershelp to encourage bicycle and pedestrian use. By connecting and extending bicyclepaths, ensuring proper safety and signage on bicycle routes, and providing travelers withthe proper amenities, bicycle and pedestrian transportation will continue to play animportant role in the <strong>Cape</strong> <strong>Cod</strong> transportation system.<strong>Cape</strong> <strong>Cod</strong> <strong>Regional</strong> <strong>Transportation</strong> <strong>Plan</strong> | August 2011Chapter 5: Bike & PedestrianPage 451
Chapter 5: Bike & Pedestrian <strong>Cape</strong> <strong>Cod</strong> <strong>Regional</strong> <strong>Transportation</strong> <strong>Plan</strong> | August 2011Page 452
<strong>2012</strong> REGIONAL TRANSPORTATION PLANChapter 6: Congestion ManagementEndorsedAugust 22, 2011
Chapter 6: Table of Contents6. Congestion Management .............................................................................. 4576.1. Congestion Management Programs - Background ............................... 4576.2. System Monitoring and Data Collection .............................................. 4596.3. Criteria for Measuring Congestion ....................................................... 4606.4. Analysis ................................................................................................. 4626.5. Develop Strategies to Address Identified Problems ............................. 4636.5.1. Recommendations ......................................................................... 4636.5.2. Recommendations for location specific actions/studies .............. 4646.5.3. Recommendations for regional actions/studies ........................... 4646.6. Congestion Management Reporting ..................................................... 4646.7. Summary of 2009 Traffic Counting Activities ..................................... 4656.8. Existing Congestion indicators ............................................................. 4676.8.1. Traffic ............................................................................................. 4676.8.2. Gas Prices ....................................................................................... 4676.8.3. Volume to Capacity Ratio of <strong>Cape</strong> <strong>Cod</strong> Roads .............................. 4706.8.4. Travel Time Corridors ................................................................... 4746.8.5. Transit Growth .............................................................................. 474Chapter 6: List of FiguresFigure 1 – Congestion Management website main page ..................................... 465Figure 2 - 30 Year Comparison of <strong>Cape</strong> <strong>Cod</strong> Canal Bridge Volumes .................. 466Figure 3 - Historic Gas Prices .............................................................................. 468Figure 4 - Annual Average Daily Traffic: Canal Bridges ..................................... 469Figure 5 - Upper <strong>Cape</strong> <strong>Cod</strong> V/C Ratios................................................................. 471Figure 6 - Mid-<strong>Cape</strong> <strong>Cod</strong> V/C Ratios ................................................................... 472Figure 7 - Outer <strong>Cape</strong> <strong>Cod</strong> V/C Ratios ................................................................ 473Figure 8 - Ratio of Speed/Speed Limit on Selected <strong>Cape</strong> <strong>Cod</strong> Roads ................. 474Figure 9 - <strong>Cape</strong> <strong>Cod</strong> RTA Ridership ..................................................................... 475Chapter 6: List of TablesTable 1 - <strong>Cape</strong> <strong>Cod</strong> Transit Task Force Goals ...................................................... 462Table 2 - RTP Local Traffic Delay Areas (from public comment form) .............. 463Table 3 - <strong>Cape</strong> <strong>Cod</strong> Summer Traffic Growth: 1999-2009 ................................... 465Table 4 - Journey to Work Origins & Destinations ............................................. 476<strong>Cape</strong> <strong>Cod</strong> <strong>Regional</strong> <strong>Transportation</strong> <strong>Plan</strong> | August 2011Chapter 6: Congestion Management
Chapter 6: Congestion Management <strong>Cape</strong> <strong>Cod</strong> <strong>Regional</strong> <strong>Transportation</strong> <strong>Plan</strong> | August 2011
6. Congestion ManagementAny urban area with a population over 200,000 is considered a <strong>Transportation</strong>Management Area, which subjects it to additional planning requirements under theSurface <strong>Transportation</strong> Program. The <strong>Cape</strong> <strong>Cod</strong> Region has been designated as a<strong>Transportation</strong> Management Area (TMA) based on the 2000 Census and is in a nonattainmentarea for air quality with excessive ozone levels. Under the federal statutesthat define the MPO processes and requirements, these conditions make theestablishment of a Congestion Management Program (CMP) a requirement of the <strong>Cape</strong><strong>Cod</strong> Metropolitan <strong>Plan</strong>ning Organization (MPO).6.1. CONGESTION MANAGEMENT PROGRAMS - BACKGROUNDCongestion Management Programs are intended to be a systematic way of:Monitoring, measuring, and diagnosing the causes of congestion on a region’smulti-modal transportation system;Evaluating and recommending alternative strategies to manage or mitigateregional congestion; andMonitoring and evaluating the performance of strategies implemented to manageor mitigate congestion.The CMP is also intended to be a planning tool to help reduce mobile source emissionsand improve regional air quality. To support this planning tool, monitoring oftransportation system performance is an ongoing activity for the <strong>Cape</strong> <strong>Cod</strong> region.“Congestion” is defined as travel time or delay in excess of that normally incurred underlight or free-flow travel conditions. There are two primary types identified for congestionand a successful congestion management program should address both types ofcongestion. The two types of congestion are:1. Recurring congestion that tends to be concentrated into short time periods, suchas "rush hours" and is caused from excessive traffic volumes resulting in reducedspeed and flow rate within the system, and2. Non-recurring congestion caused from unforeseen incidents (road accidents,spills, and stalls) which affect the driver behavior to a considerable extent.Critical to the concept of congestion management is the understanding that theacceptable system performance may vary by type of transportation modes and systems,geographic location, season, and/or time of day. The CMP must reflect parameters thatidentify the degree to which travel time and/or delays are within locally acceptablestandards of mobility to meet the needs of individual states or metropolitan areas.<strong>Cape</strong> <strong>Cod</strong> <strong>Regional</strong> <strong>Transportation</strong> <strong>Plan</strong> | August 2011Chapter 6: Congestion ManagementPage 457
Significant Legislative Elements:The CMP shall be developed, established, and implemented as part of the metropolitanplanning process in accordance with 23 CFR 450.320(c). The statute includes thefollowing requirements:1. Methods to monitor and evaluate the performance of the multimodal transportationsystem, identify the causes of congestion, identify and evaluate alternative actions,provide information supporting the implementation of actions, and evaluate theefficiency and effectiveness of implemented actions.2. Definition of parameters for measuring the extent of congestion and for supportingthe evaluation of the effectiveness of congestion-reduction and mobilityenhancementstrategies for the movement of people and goods. Since levels ofacceptable system performance may vary among local communities, performancemeasures and service thresholds should be tailored to the specific needs of the areaand established cooperatively by the State, affected MPO(s), and local officials inconsultation with the operators of major modes of transportation in the coveragearea.3. Establishment of a program for data collection and system performance monitoringto define the extent and duration of congestion, to help determine the causes ofcongestion, and to evaluate the efficiency and effectiveness of implemented actions.To the extent possible, existing data sources should be used, as well as appropriateapplication of the real-time system performance monitoring capabilities availablethrough Intelligent <strong>Transportation</strong> Systems (ITS) technologies.4. Identification and evaluation of the anticipated performance and expected benefits ofappropriate traditional and nontraditional congestion management strategies thatwill contribute to the more efficient use of existing and future transportation systemsbased on the established performance measures. The following categories ofstrategies, or combinations of strategies, should be appropriately considered for eacharea: <strong>Transportation</strong> demand management measures, including growthmanagement and congestion pricing; Traffic operational improvements; Public transportation improvements; ITS technologies; and, Where necessary, additional system capacity.5. Identification of an implementation schedule, implementation responsibilities, andpossible funding sources for each strategy (or combination of strategies) proposedfor implementation.6. Implementation of a process for periodic assessment of the efficiency andeffectiveness of implemented strategies, in terms of the area's establishedperformance measures. The results of this evaluation shall be provided to decisionmakers to provide guidance on the selection of effective strategies for futureimplementation.Chapter 6: Congestion Management <strong>Cape</strong> <strong>Cod</strong> <strong>Regional</strong> <strong>Transportation</strong> <strong>Plan</strong> | August 2011Page 458
Air Quality Non-attainment AreasIn a <strong>Transportation</strong> Management Area (TMA), such as the <strong>Cape</strong> <strong>Cod</strong> region which isdesignated as being a non-attainment area for ozone, the federal statute also requiresthat the CMP perform an analysis of all reasonable travel demand reduction andoperational management strategies for a corridor in which a proposed project will resultin a significant increase in capacity for single-occupant vehicles (SOVs). This includesadding general purpose lanes to an existing highway or constructing a new highway andshould consider multimodal strategies. If the analysis demonstrates that travel demandreduction and operational management strategies cannot fully satisfy the need foradditional capacity in the corridor and additional SOV capacity is warranted, then theCMP shall identify all reasonable strategies to manage the SOV facility effectively, or tofacilitate its management in the future.Other travel demand reduction and operational management strategies appropriate forthe corridor, but not appropriate for incorporation into the SOV facility itself shall alsobe identified through the CMP. All identified reasonable travel demand reduction andoperational management strategies shall be incorporated into the SOV project orcommitted to by the State and MPO for implementation.6.2. SYSTEM MONITORING AND DATA COLLECTIONA number of tasks are being performed annually to monitor traffic on <strong>Cape</strong> <strong>Cod</strong>.The data collected in the monitoring process will be continually compared to themeasures developed to define congestion. The comparison will be used to identifycongested areas and trigger an investigation into the nature of the demand problems.These demand issues are expected to include regional traffic flows, local trafficgenerators, geometric problems, and access problems.The following programs are currently underway and will continue. These existingprograms are anticipated to provide the bulk of the data for the CMP.Traffic Counting ProgramThe <strong>Cape</strong> <strong>Cod</strong> Commission, funded by MassDOT, has been collecting traffic data since1984. This data includes traffic volumes on key roadway segments around <strong>Cape</strong> <strong>Cod</strong> andturning movement counts collected at key intersections. The traffic counting program isestablished in a systematic way to provide historic data at key locations as resourcesallow. Counts are also made to support traffic studies and, in areas of concern, to identifycongested situations. Development of the annual traffic counting program is done inconsultation with the <strong>Cape</strong> <strong>Cod</strong> Joint <strong>Transportation</strong> Committee. The principal productof this effort is the annual traffic counting report.The traffic counting program will continue to provide data for the CMP. Examination ofchanges in traffic volume will be done and trends will guide further investigation oftraffic problems as part of the CMP. As the traffic counting program is defined each<strong>Cape</strong> <strong>Cod</strong> <strong>Regional</strong> <strong>Transportation</strong> <strong>Plan</strong> | August 2011Chapter 6: Congestion ManagementPage 459
spring, counts to investigate suspected or identified congestion areas will be included. Inaddition, counts will be programmed to monitor congestion in areas where CMPinitiatives are in place.Travel Time AnalysisTravel time has been monitored on a limited basis. Recently, GPS technology has madedeveloping and recording travel time studies easier. Opportunities to use data providedby the automatic vehicle locators on all CCRTA vehicles is currently being explored. It isexpected that this data will be useful in identifying congested areas and congested traveltime periods on many of the <strong>Cape</strong>’s major traffic corridors. The <strong>Cape</strong> <strong>Cod</strong> Commission isdeveloping this procedure along with Bridgewater State College’s GeoGraphics Lab andthe CCRTA. Seasonal and weather related traffic trends are to be identified with this dataand potentially develop strategies to address them. Additional GPS travel time studieswill be recommended to support the CMP investigations especially in identifyingproblem areas within a corridor.Park-and-Ride UsagePark and Ride lot counts are conducted routinely at the three MHD lots in the <strong>Cape</strong> <strong>Cod</strong>region and occupancy developed in terms of capacity. A detailed study was performed todetermine use of the two primary lots in Barnstable and Sagamore includingdetermining overnight use and use by the day of week and time of year. The use andoccupancy of the <strong>Cape</strong>’s park-and-ride lots will continue to be monitored.Transit UsageRidership data is collected routinely by the mobile data computers linked to the fareboxes on the entire fixed route CCRTA system. The ridership on the demand responseservices (B-Bus) is also recorded by the CCRTA. This data has not been studied by the<strong>Cape</strong> <strong>Cod</strong> Commission and development of detailed transit use and patterns of travel willbe incorporated into the CMP.6.3. CRITERIA FOR MEASURING CONGESTIONCriteria, measures of congestion, and the CMP are currently under development andthese must be designed to respect the <strong>Regional</strong> <strong>Transportation</strong> <strong>Plan</strong> (RTP) goals and thephilosophy designed to preserve the valued aspects of <strong>Cape</strong> <strong>Cod</strong>. This will likely make thestandards adopted in many other regions unacceptable for <strong>Cape</strong> <strong>Cod</strong>.<strong>Cape</strong> <strong>Cod</strong> is a unique place with extreme fluctuations in traffic over the course of a yeardue to the recreational nature of the region. The sensitive ecologic and aesthetic natureof the region have long been cherished and this has been reflected in the goals developedfor the RTP.Chapter 6: Congestion Management <strong>Cape</strong> <strong>Cod</strong> <strong>Regional</strong> <strong>Transportation</strong> <strong>Plan</strong> | August 2011Page 460
The philosophy of the <strong>Cape</strong> <strong>Cod</strong> RTP is not to build to accommodate the peak seasondemand but to provide adequate transportation for year-round travel and to provide andpromote alternatives to the automobile. This philosophy is different from the majority ofthe regions in Massachusetts and across the nation. The philosophy of the <strong>Plan</strong> placesmuch more emphasis on management of traffic and providing alternatives to theautomobile for transportation rather than accommodating traffic demand.The development of congestion criteria will be done initially as a separate exercise alongwith a public process to develop measures consistent with the philosophies in the RTP.The measures will be included in the RTP to allow review of these measures andpotential updates on a periodic basis in conjunction with the review of the RTP goals andobjectives.Measures of seasonal as well as year round congestion need to be developed through thetraffic counting program in addition to monitoring of the travel times as well as transitusage. Development of relative conditions and trends between seasonal demand andwinter demand periods must also occur to help determine appropriate strategies foraddressing congestionDevelop Measures of Roadway CongestionThresholds for determining acceptable levels of service will be proposed on the basis ofvolume to capacity ratios and reviewed in terms of defining the extent of congestion or towhat extent these levels of service are exceeded on the <strong>Cape</strong>. Additional measures ofcongestion are to be defined in terms of delay. Travel time analysis and intersectionstudies will be used to identify the locations and corridors that exceed these thresholds.In addition to the levels of traffic, measures of scenic and ecologic value will be includedin the criteria for defining congestion. These criteria will help guide the solutionsproposed to resolve identified congestion.Develop Measures of Public <strong>Transportation</strong> CongestionPublic transportation is becoming increasingly important for <strong>Cape</strong> <strong>Cod</strong>. More than half(51 percent) of <strong>Cape</strong> households are considered “low income” according to theBarnstable County Affordable Housing Needs Analysis (Barnstable County HumanServices Department, 1999) and alternatives to owning cars is becoming moreimportant. The percentage of the population over 65 was 23.1% in the 2000 census andthis segment of the population is growing. Many elders have difficulty driving and arebecoming reliant on alternative forms of transportation.Development of measures of congestion and effectiveness for various modes of publictransportation on <strong>Cape</strong> <strong>Cod</strong> and related solutions to identified problems must beconsistent with the goals (shown in the following table) developed by the <strong>Cape</strong> <strong>Cod</strong>Transit Task Force in the 5-Year <strong>Plan</strong> for public <strong>Transportation</strong> developed in 2002.<strong>Cape</strong> <strong>Cod</strong> <strong>Regional</strong> <strong>Transportation</strong> <strong>Plan</strong> | August 2011Chapter 6: Congestion ManagementPage 461
TABLE 1 - CAPE COD TRANSIT TASK FORCE GOALSGoal Description1. Reduce automobile dependency by providing mobility options.2. Mitigate seasonal traffic by promoting travel to the region without cars, and byproviding seasonal public transportation options.3. Meet the needs of the year-round population for public transportation,especially the needs of those who are "transit dependant" and in need ofhuman services.4. Develop coordination, communication, and cooperation between regionalpublic transportation providers.5. Incorporate smart growth and land use planning decisions into thedevelopment of public transportation.6.4. ANALYSISThe data collected in the monitoring process will be continually compared to themeasures developed to define congestion. The comparison will be used to identifycongested areas and trigger an investigation into the nature of the demand problems.These demand issues are expected to include regional traffic flows, local trafficgenerators, geometric problems, and access problems. The annual traffic studies pursuedby the <strong>Cape</strong> <strong>Cod</strong> MPO staff will be guided by the CMP and target areas for further study.Identify Areas of Roadway CongestionIdentify Areas of Transit CongestionTo further facilitate public comment, a five-page RTP questionnaire was distributed atpublic meetings. The questionnaire was also announced in the <strong>Cape</strong> <strong>Cod</strong> CommissionReporter newsletter, and on the <strong>Cape</strong> <strong>Cod</strong> Commission <strong>Transportation</strong> InformationCenter included an on-line option for respondents to use at this address:www.gocapecod.org/rtpThe questionnaire included questions on goals and priorities, identification of local andregional safety problems, and regional congestion problems. There were also a numberof example projects for respondents to indicate their support (or opposition).Twenty-eight comment forms were submitted electronically or collected at publicmeetings. One of the most valuable benefits of this input was the generation of potentialsolutions. These are discussed at length in a later chapter of the RTP (Analysis ofAlternatives). The questionnaire was also used to gauge respondents’ views regardingcongestion. When considering the region as a whole, common congestion themesemerged including locations such as:Chapter 6: Congestion Management <strong>Cape</strong> <strong>Cod</strong> <strong>Regional</strong> <strong>Transportation</strong> <strong>Plan</strong> | August 2011Page 462
<strong>Cape</strong> <strong>Cod</strong> Canal BridgesYarmouth Road/Willow Street in BarnstableRoute 28 from Falmouth to Yarmouth, especially in the Hyannis area.The respondents were also asked to “…list the top three areas that have the worstLOCAL TRAFFIC DELAY problems” for the town that they resided in or spent the mosttime in. The following table presents a list of the top two locations identified from thequestionnaire:TABLE 2 - RTP LOCAL TRAFFIC DELAY AREAS (FROM PUBLIC COMMENT FORM)(Responses as of 8/23/2010)Town Location#1 Location #2Barnstable Route 132 signals Yarmouth Road/Willow StreetBourne Bourne Rotary Sandwich RoadEasthamRoute 6 southbound to Route 6 northbound @ WellfleetEastham Rotarytown lineFalmouthRoute 28 @ Jones Road/TerTeaticket Highway (Route 28)Heun DriveHarwichMain Street (Route 39) @Route 124Route 6 Exit 11 off rampMashpee Mashpee RotaryRoute 151 @ Old BarnstableRoadOrleans Route 6A @ Main Street Main Street @ Old Colony WayTruro Left turns onto Route 6Yarmouth Route 28 in West Yarmouth Route 28 @ Station Avenue6.5. DEVELOP STRATEGIES TO ADDRESS IDENTIFIEDPROBLEMSThe following subsections include descriptions of the process to be used to produce CMPstrategies.6.5.1. RECOMMENDATIONSThe results of the CMP will include the generation of studies to address issues thatexceed the criteria developed to define transportation congestion for the region. Thesestudies will produce recommendations that will be included in the RTP and TIPprocesses to be considered for construction or implementation.Proposed ProductsDevelop CMP projects from the CMP Study recommendations and include them in theevaluation process for the region’s RTP and TIP.<strong>Cape</strong> <strong>Cod</strong> <strong>Regional</strong> <strong>Transportation</strong> <strong>Plan</strong> | August 2011Chapter 6: Congestion ManagementPage 463
6.5.2. RECOMMENDATIONS FOR LOCATION SPECIFIC ACTIONS/STUDIESRecommendations to the MPO to address issues that exceed the criteria developed todefine transportation congestion for the region will generally come from studiesconducted by the <strong>Cape</strong> <strong>Cod</strong> Commission transportation staff. Recommendations mayalso be developed by the towns and the CCRTA. All recommended projects and strategieswill be evaluated by the Commission and the <strong>Cape</strong> <strong>Cod</strong> Joint <strong>Transportation</strong> Committeeusing the MassDOT evaluation criteria and with the RTP goals. Based on theseevaluations, the CMP projects will be considered by the MPO for inclusion in the RTPand compete for funding within the TIP.6.5.3. RECOMMENDATIONS FOR REGIONAL ACTIONS/STUDIESSome congestion problems will need to be addressed on a corridor-wide or system basisor require significant investments. Studies or remedial actions will be recommended tothe MPO for their consideration and potential inclusion in the TIP or the UPWP.Projects with regional significance may become an initiative of the Statewide<strong>Transportation</strong> Program. These proposed projects may require a more extensiveevaluation with regard to conformity with the Massachusetts State Implementation <strong>Plan</strong>(SIP). These projects may also become <strong>Transportation</strong> Control Measures (TCMs) andincluded as such in the SIP submitted to EPA.6.6. CONGESTION MANAGEMENT REPORTINGThe CMP is an ongoing program that documents the region’s mobility concerns. TheCMP contains the most recent performance monitoring information for the regionaltransportation system. The information and general analysis of the system, using thecriteria defined in the CMP and RTP processes, will provide the basis for the <strong>Cape</strong> <strong>Cod</strong>Commission <strong>Transportation</strong> staff and the <strong>Cape</strong> <strong>Cod</strong> Joint <strong>Transportation</strong> Committee tomake recommendations. These recommendations will be made to the <strong>Cape</strong> <strong>Cod</strong> MPO ascongestion reducing and mobility enhancing actions to be considered in the MPOplanning and programming processes. The main means of providing congestionsinformation is via the <strong>Cape</strong> <strong>Cod</strong> Commission’s <strong>Transportation</strong> Information Center on theinternet:www.gocapecod.org/congestionThe following figure is a screen capture of the main Congestion Management webpage onthe website. Users have access to traffic cameras, speed maps, automated bus locators,trip planners and a number of other tools to identify and avoid congestion.Chapter 6: Congestion Management <strong>Cape</strong> <strong>Cod</strong> <strong>Regional</strong> <strong>Transportation</strong> <strong>Plan</strong> | August 2011Page 464
FIGURE 1 – CONGESTION MANAGEMENT WEBSITE MAIN PAGE6.7. SUMMARY OF 2009 TRAFFIC COUNTING ACTIVITIESThe traffic counting program is the base data source for developing trends in trafficgrowth and potential for growth in traffic congestion. The following information is fromthe <strong>Cape</strong> <strong>Cod</strong> 2009 Traffic Counting Report published in December 2009. The fullreport and access to mapped traffic counts are available at:www.gocapecod.org/countsAccording to <strong>Cape</strong> <strong>Cod</strong> Commission and MassDOT traffic counting data, <strong>Cape</strong>-widetraffic increased 4.51% from 2008 to 2009.The information presented in the following tables and figures includes calculated trafficgrowth rates for sub-regions and major roads in Barnstable County.TABLE 3 - CAPE COD SUMMER TRAFFIC GROWTH: 1999-2009RegionNumber ofComparisons10 Year TotalGrowth10 Year AverageAnnualGrowth RateUpper <strong>Cape</strong> 112 -5.99% -0.62%Mid-<strong>Cape</strong> 86 -10.35% -1.09%Lower <strong>Cape</strong> 76 -11.87% -1.26%Outer <strong>Cape</strong> 56 -13.74% -1.47%All Roads 330 -9.05% -0.95%“Upper” = Bourne, Sandwich, Falmouth, Mashpee“Mid” = Barnstable, Yarmouth, Dennis“Lower” = Harwich, Chatham, Brewster, Orleans“Outer” = Eastham, Wellfleet, Truro, Provincetown<strong>Cape</strong> <strong>Cod</strong> <strong>Regional</strong> <strong>Transportation</strong> <strong>Plan</strong> | August 2011Chapter 6: Congestion ManagementPage 465
FIGURE 2 - 30 YEAR COMPARISON OF CAPE COD CANAL BRIDGE VOLUMESChapter 6: Congestion Management <strong>Cape</strong> <strong>Cod</strong> <strong>Regional</strong> <strong>Transportation</strong> <strong>Plan</strong> | August 2011Page 466
6.8. EXISTING CONGESTION INDICATORSThe <strong>Cape</strong> <strong>Cod</strong> Center for Sustainability in their <strong>Cod</strong> Sustainability Indicators Report hasdeveloped a number of factors that bring together social, economic, and environmentalindicators to be tracked over time. While no single indicator is able to give the entirepicture, tracking representative indicators in many areas provides an overall sense oftrends and of the <strong>Cape</strong>’s progress toward becoming a sustainable region. This report hasdeveloped the following indicators for traffic and transit.6.8.1. TRAFFICThe <strong>Cape</strong> <strong>Cod</strong> Center for Sustainability traffic congestion indicator is based on averageannual daily bridge crossings over the Sagamore and Bourne bridges for and data isavailable over the past 32 years. While there are many possible indicators of congestion,the bridge traffic is easy to measure, provides data on long-term trends, and hassignificant implications for traffic <strong>Cape</strong> wide, as many who bring their cars across thebridge use them for virtually all local or regional trips.Bridge crossings have been rising steadily for most of the past 32 years. Starting in 1972with 41,513 daily bridge crossings, the figures had more than doubled to 93,648 by 1998.There was a gradual increase in crossings between 1972 and 1979. At the beginning of the1980s, the numbers continued to rise, with the most dramatic increase of 10% occurringbetween 1983 and 1984. Overall, there was an increase of 60% in bridge crossings from1980 to 1990. The annual rate of increase has ranged from 0.5% to 4% during the 1990s.There are no signs indicating that these numbers will decrease in the future. The graphin the previous figure shows a 30 year comparison of monthly combined average dailytraffic from 1979 and 2009.6.8.2. GAS PRICESGas prices have varied significantly and affect the use of the automobile and transit. Thefollowing Massachusetts retail price/gallon data (as of November 2009) is fromwww.gasbuddy.com.<strong>Cape</strong> <strong>Cod</strong> <strong>Regional</strong> <strong>Transportation</strong> <strong>Plan</strong> | August 2011Chapter 6: Congestion ManagementPage 467
FIGURE 3 - HISTORIC GAS PRICESChapter 6: Congestion Management <strong>Cape</strong> <strong>Cod</strong> <strong>Regional</strong> <strong>Transportation</strong> <strong>Plan</strong> | August 2011Page 468
FIGURE 4 - ANNUAL AVERAGE DAILY TRAFFIC: CANAL BRIDGES<strong>Cape</strong> <strong>Cod</strong> <strong>Regional</strong> <strong>Transportation</strong> <strong>Plan</strong> | August 2011Chapter 6: Congestion ManagementPage 469
6.8.3. VOLUME TO CAPACITY RATIO OF CAPE COD ROADSThe following figures present Level of Service information for many <strong>Cape</strong> <strong>Cod</strong> locationsbased on the volume to capacity ratio. The thresholds for these ratios are shown in thefollowing table:Symbol V/C Ratio Threshold Level of Service (LOS)• 0.8 C or Better• 0.9 D• 1.0 E• >1.0 FThe Level of Service (LOS) calculations are performed for locations where the CCC hascollected summer traffic counting data. The traffic volumes used represent a consistentsummer weekday 4-5 p.m. peak hour. Roadway capacities were extracted from the <strong>Cape</strong><strong>Cod</strong> travel demand forecasting model and originated from the Office of <strong>Transportation</strong><strong>Plan</strong>ning at MassDOT.Roadway LOS only shows part of the congestion picture. In many cases trafficcongestion bottlenecks occur at intersections. Intersection analyses are morecomplicated and performed on a case-by-case basis. Such locations are often identifiedthrough public input and consultations with local traffic officials such as CCJTCmembers.Chapter 6: Congestion Management <strong>Cape</strong> <strong>Cod</strong> <strong>Regional</strong> <strong>Transportation</strong> <strong>Plan</strong> | August 2011Page 470
FIGURE 5 - UPPER CAPE COD V/C RATIOS<strong>Cape</strong> <strong>Cod</strong> <strong>Regional</strong> <strong>Transportation</strong> <strong>Plan</strong> | August 2011Chapter 6: Congestion ManagementPage 471
FIGURE 6 - MID-CAPE COD V/C RATIOSChapter 6: Congestion Management <strong>Cape</strong> <strong>Cod</strong> <strong>Regional</strong> <strong>Transportation</strong> <strong>Plan</strong> | August 2011Page 472
FIGURE 7 - OUTER CAPE COD V/C RATIOS<strong>Cape</strong> <strong>Cod</strong> <strong>Regional</strong> <strong>Transportation</strong> <strong>Plan</strong> | August 2011Chapter 6: Congestion ManagementPage 473
6.8.4. TRAVEL TIME CORRIDORSThe following figure shows travel time information on selected major corridors on <strong>Cape</strong><strong>Cod</strong> (e.g., Route 28, Route 6A, and Route 6 in the Outer <strong>Cape</strong>). The CCC has collectedspeed data on the color-coded segments. The above graphic shows the observed speeddivided by the speed limit of each road segment. (Observed speeds were collected atvarious times of the day during summer weekdays). Road segments color coded greeninclude a ratio of 1.0 – this represents travel speeds matching the speed limit. Heavilycongested roadways are represented in red (speed/speed limit ranges from 0.11-0.50).FIGURE 8 - RATIO OF SPEED/SPEED LIMIT ON SELECTED CAPE COD ROADS6.8.5. TRANSIT GROWTHThe indicator used by the <strong>Cape</strong> <strong>Cod</strong> Center for Sustainability to monitor transit,measures the total number of riders using public transit annually. This indicatorChapter 6: Congestion Management <strong>Cape</strong> <strong>Cod</strong> <strong>Regional</strong> <strong>Transportation</strong> <strong>Plan</strong> | August 2011Page 474
measures local and regional (on-<strong>Cape</strong>) ridership on public transit systems, but does notmeasure the ridership on private carriers or commuters to Boston.This measure of annual ridership documents one aspect of the alternatives to theautomobile. The Outer <strong>Cape</strong> Flex service was introduced on June 1, 2006 and was moresuccessful than anticipated and will be monitored for trends in future years.System-wide RidershipCCRTA Annual Ridership: FY89 - FY101,000,000One-Way Trips800,000600,000400,000200,000089 90 91 92 93 94 95 96 97 98 99 00 01 02 03 04 05 06 07 08 09 10Fiscal YearFIGURE 9 - CAPE COD RTA RIDERSHIPSource: <strong>Cape</strong> <strong>Cod</strong> <strong>Regional</strong> Transit AuthorityFY 2010 ridership increased 8.7% from 2009 following a more modest increase of 0.3 %for the year before. Growth has varied but continued a positive trend since 2006. The<strong>Cape</strong> <strong>Cod</strong> <strong>Regional</strong> Transit Authority (CCRTA) has implemented a major new service inMay 2006 (The Flex) on the Outer <strong>Cape</strong> that has increased their annual ridershipsignificantly.For reference, the following table from the 2000 Census show the numbers of reportedcommuters from other Counties to employment in Barnstable County.<strong>Cape</strong> <strong>Cod</strong> <strong>Regional</strong> <strong>Transportation</strong> <strong>Plan</strong> | August 2011Chapter 6: Congestion ManagementPage 475
TABLE 4 - JOURNEY TO WORK ORIGINS & DESTINATIONSChapter 6: Congestion Management <strong>Cape</strong> <strong>Cod</strong> <strong>Regional</strong> <strong>Transportation</strong> <strong>Plan</strong> | August 2011Page 476
<strong>2012</strong> REGIONAL TRANSPORTATION PLANChapter 7: Analysis of AlternativesEndorsedAugust 22, 2011
Chapter 7: Table of Contents7 Analysis of Alternatives ................................................................................. 4817.1 Types of <strong>Transportation</strong> Alternatives .................................................... 4817.1.1 <strong>Transportation</strong> Programs ................................................................... 4817.1.2 <strong>Transportation</strong> Projects ................................................................. 4827.1.3 “Smart” Solutions .......................................................................... 4827.1.4 <strong>Transportation</strong> Studies .................................................................. 4827.2 Population and Employment Growth ................................................... 4837.3 Evaluation Criteria ................................................................................ 4877.4 Recent CCC <strong>Transportation</strong> <strong>Plan</strong>ning Efforts ....................................... 4917.4.1 Yarmouth Road Corridor Study/Hyannis Access StudyImplementation ............................................................................................. 4917.4.2 Route 6A Corridor Management <strong>Plan</strong> Update .............................. 4937.5 Additional <strong>Regional</strong> Efforts ................................................................... 5017.5.1 Open<strong>Cape</strong> ....................................................................................... 5017.5.2 Local <strong>Transportation</strong> Center Study ................................................ 5017.5.3 <strong>Transportation</strong> Partner Study ........................................................ 5017.5.4 Renewable Fuel Partnership ......................................................... 5027.5.5 Cultural Coast Ferry <strong>Plan</strong> .............................................................. 5027.5.6 Coordinated Human Service transportation <strong>Plan</strong> ........................ 5027.5.7 Outer <strong>Cape</strong> Maintenance Facility Study ....................................... 5037.5.8 Monomoy Access Study ................................................................. 5047.5.9 Parking and Transit Study ............................................................. 5057.5.10 ITS Implementation <strong>Plan</strong> .............................................................. 5057.6 <strong>Transportation</strong> Alternatives ................................................................. 5077.6.1 <strong>Transportation</strong> Programs .............................................................. 5087.6.2 <strong>Transportation</strong> Projects .................................................................. 5117.6.3 Smart Solutions Considered ........................................................... 5217.6.4 <strong>Transportation</strong> Studies Considered .............................................. 5247.7 Conclusion .............................................................................................. 527Chapter 7: List of TablesTable 1 - Estimated Employment, Population & Households ............................ 484Table 2 - Population Forecasts by Town ............................................................. 485Table 3 - Employment Forecasts by Town .......................................................... 486Table 4 - Household Forecasts by Town ............................................................. 486Table 5 - Route 6A Enhanced Bicycle Accommodation Segments ..................... 500Table 6 - <strong>Transportation</strong> Programs Considered ................................................. 509Table 7 - <strong>Transportation</strong> Projects Considered ..................................................... 512<strong>Cape</strong> <strong>Cod</strong> <strong>Regional</strong> <strong>Transportation</strong> <strong>Plan</strong> | August 2011Chapter 7: Alternatives
Table 8 - Smart Solutions Considered ................................................................. 522Table 9 - <strong>Transportation</strong> Studies Considered ..................................................... 525Chapter 7: Alternatives <strong>Cape</strong> <strong>Cod</strong> <strong>Regional</strong> <strong>Transportation</strong> <strong>Plan</strong> | August 2011
7. Analysis of AlternativesIn the previous chapters of the <strong>Regional</strong> <strong>Transportation</strong> <strong>Plan</strong> (RTP), many existing andpotential future problems have been identified, as well as potential solutions.Specifically, detailed information on many of the safety improvements is available inChapter 3 (Safety). Detailed information on many of the bicycle/pedestrian alternativesis available in Chapter 5 (<strong>Cape</strong> <strong>Cod</strong> Bike <strong>Plan</strong>). This chapter includes information on themany potential solutions, analysis methods used, and descriptions of alternatives.Summaries of recent CCC transportation planning efforts and additional regional effortsare included in this chapter. The results of these analyses are used in the financiallyconstrainedprioritization listing in the following chapter – Chapter 8 (Financial <strong>Plan</strong>and Recommended Projects).7.1 TYPES OF TRANSPORTATION ALTERNATIVESFor purposes of organization, each alternative has been placed in one of four categories:<strong>Transportation</strong> Programs<strong>Transportation</strong> ProjectsSmart Solutions<strong>Transportation</strong> StudiesThese categories are described in detail in the following sections. The final section onthis chapter includes a detailed summary analysis of each alternative.7.1.1 TRANSPORTATION PROGRAMSThe RTP, as a long-range transportation planning document, covers a time-span beyondour ability to define every specific project to be implemented up to the year 2035. It istherefore important to reserve resources (funds) over the life of the plan for specifictransportation categories that support the RTP goals. The following “Programs” areexamples proposed to meet the requirements of the RTP goals:Roadway resurfacingBridge replacement/reconstructionTransit operating assistance & capital needsIntersection improvementsBicycle/pedestrian projects<strong>Regional</strong> bike networkIntelligent <strong>Transportation</strong> SystemsLand conservation<strong>Cape</strong> <strong>Cod</strong> <strong>Regional</strong> <strong>Transportation</strong> <strong>Plan</strong> | August 2011Chapter 7: AlternativesPage 481
A full listing of all Programs is available in the section at the end of this chapter.7.1.2 TRANSPORTATION PROJECTSThe second, and most specific category of transportation alternatives, is the listing oftransportation “projects.” Examples that fall into the “projects” category include:Signalization of a specific intersectionConstruction of additional travel lanes along a specific road segmentOperation of new transit service in a specific areaNew bicycle path construction between specific end pointsSpecific projects are individually discussed in the listing at the end of this chapter.7.1.3 “SMART” SOLUTIONSThis category of alternatives includes solutions that do not require major investments incapital or operations. These are called “Smart” Solutions because they do requirethoughtful promotion and coordination of transportation services that for the most partalready exist. The following are examples of Smart Solutions:Encourage people to take the ferry from New Bedford instead of Woods Hole toMartha’s Vineyard to reduce vehicle congestion over the canal bridges.Coordinate <strong>Cape</strong> <strong>Cod</strong> RTA and Ferry Schedules with each otherDevelop, Sign, and Publish a <strong>Cape</strong>-wide Bicycle Route SystemSmart Solutions are fully listed at the end of this chapter.7.1.4 TRANSPORTATION STUDIESThis fourth and final category of alternatives encompasses ideas that have notbeen fully realized. From the public participation process, there have been manyoccasions on which a clear course of action is not revealed. In these cases, theremay be many conflicting (and potentially infeasible) “solutions” proposed.Perhaps the only consensus is that there is in fact a problem worthy of furtherreview. Therefore, this final category forms the basis for future planning efforts.These <strong>Transportation</strong> Studies provide the vehicle for generating programs,projects, and smart solutions. Examples of <strong>Transportation</strong> Studies may includethe following types of activities:Analyze the need for improvements of highway crossings of the <strong>Cape</strong> <strong>Cod</strong> Canal.Analyze the safety impacts of changes to the Route 3 approach to the SagamoreBridge.Analyze usage patterns and survey passengers for suggested improvements to theOuter <strong>Cape</strong> Flex service.Chapter 7: Alternatives <strong>Cape</strong> <strong>Cod</strong> <strong>Regional</strong> <strong>Transportation</strong> <strong>Plan</strong> | August 2011Page 482
<strong>Transportation</strong> Studies are individually discussed in the section at the end of thischapter.7.2 POPULATION AND EMPLOYMENT GROWTHThe Massachusetts Department of <strong>Transportation</strong> (MassDOT) has consulted with <strong>Cape</strong><strong>Cod</strong> Commission staff on the potential growth of Barnstable County.MASS DOT 2035 MUNICIPAL PROJECTION METHODSMassDOT’s projections pivot around trends established in the existing municipaldemographic projections done by the RPA’s in collaboration with MassDOT. Resultingfrom both RPA staff comments and newly available information, the following majorchanges have been made to MassDOT’s original draft population and employmentprojections (February 2010):Statewide and regional totals adjusted to latest available 2010 estimates.2009 U.S. Census population estimates by municipality, as well as 2009 DET municipalemployment figures (and 2010 state unemployment rates), were not yet available duringdevelopment of the original forecasts. These new estimates have provided a better gaugeof regional population growth, and a more accurate accounting of how the currentrecession has affected total employment. Many of these changes have been carriedthrough to future forecast years (due to starting with a significantly larger or smallerbase in 2010). 2010 Census results became available in time for inclusion in this RTPand are reflected in the tables listed in this section.Improved relationships between labor force size, participation rates, jobs,and unemployment rates.The revised 2020 estimates for total employment are now more consistent with theprojected size of the available labor force. Although all regions are expected to add jobsthis decade, 2020 unemployment rates will still be slightly higher than the pre-recessionlevels due to the growth of the labor force (many economists predict that unemploymentrates will remain high for several years – or more). Massachusetts state unemploymentrates assumed for these forecasts are as follows:<strong>Cape</strong> <strong>Cod</strong> <strong>Regional</strong> <strong>Transportation</strong> <strong>Plan</strong> | August 2011Chapter 7: AlternativesPage 483
2010 2017 2020 2025 2030 2035(actual)9.2% 7.9% 6.7% 5.8% 5.3% 5.0%By 2020, all regions are forecast to at least return to their 2000 employment level, withsome experiencing further growth over and above those levels. While in general, aquicker recovery from the recession is now forecast, the job growth from 2020 to 2035will be at a significantly slower pace.Adjustments to regional shares and ratios.Each region’s shares of population and employment compared to statewide totals havebeen smoothed across forecast years to eliminate unlikely spikes or dips from (forecast)year to year. Similarly, the employment-to-population ratios are now slightly moreconsistent across historical and forecast years, with 2010 being treated as a dip (fewerjobs per person) due to the lingering recessionBased on the methods outlined above, the following table presents the estimatedincreases in population and employment in Barnstable County as well as theCommonwealth.TABLE 1 - ESTIMATED EMPLOYMENT, POPULATION & HOUSEHOLDS2010 2017 2020 2025 2030 2035<strong>Cape</strong> <strong>Cod</strong>Employment 88,900 94,000 98,000 100,000 102,000 104,000Population 215,888 230,000 236,000 245,010 256,000 266,000Households 95,755 103,000 106,000 112,000 117,000 122,000MassachusettsEmployment 3,111,600 3,258,900 3,331,500 3,362,400 3,395,400 3,418,800Population 6,547,629 6,762,900 6,840,800 6,980,900 7,131,600 7,282,100Households 2,547,075 2,704,000 2,751,100 2,832,600 2,912,700 2,980,500Source: Massachusetts Department of <strong>Transportation</strong>Chapter 7: Alternatives <strong>Cape</strong> <strong>Cod</strong> <strong>Regional</strong> <strong>Transportation</strong> <strong>Plan</strong> | August 2011Page 484
Distribution of Forecasts by MunicipalityUsing anticipated remaining growth in employment, population, and households from a2000 EOEA build-out study as a guide for distribution, the MassDOT County totals weredistributed on a town-by-town basis for the year 2035. Town numbers for interveningyears were developed through interpolation and factoring to meet the MassDOT controltotals for each year.The following three tables include breakdowns for population and employment for eachof the <strong>Cape</strong>’s fifteen towns.TABLE 2 - POPULATION FORECASTS BY TOWNPOPULATIONTown 2010 2017 2020 2025 2030 2035Barnstable 45,193 47,840 48,970 50,640 52,720 54,600Bourne 19,754 20,940 21,440 22,190 23,110 23,950Brewster 9,820 10,820 11,240 11,900 12,660 13,370Chatham 6,125 6,570 6,770 7,050 7,400 7,720Dennis 14,207 14,720 14,930 15,230 15,650 16,010Eastham 4,956 5,200 5,300 5,450 5,650 5,820Falmouth 31,531 33,730 34,660 36,080 37,780 39,340Harwich 12,243 13,270 13,700 14,370 15,150 15,880Mashpee 14,006 15,560 16,220 17,250 18,420 19,520Orleans 5,890 6,240 6,390 6,610 6,890 7,140Provincetown 2,942 3,240 3,370 3,570 3,800 4,010Sandwich 20,675 21,630 22,040 22,620 23,390 24,060Truro 2,003 2,390 2,560 2,830 3,120 3,400Wellfleet 2,750 3,230 3,430 3,760 4,110 4,450Yarmouth 23,793 24,620 24,980 25,460 26,150 26,730Grand Total 215,888 230,000 236,000 245,010 256,000 266,000Source: Massachusetts Department of <strong>Transportation</strong><strong>Cape</strong> <strong>Cod</strong> <strong>Regional</strong> <strong>Transportation</strong> <strong>Plan</strong> | August 2011Chapter 7: AlternativesPage 485
TABLE 3 - EMPLOYMENT FORECASTS BY TOWNEMPLOYMENTTown 2010 2017 2020 2025 2030 2035Barnstable 26,090 26,940 27,830 27,960 28,110 28,260Bourne 7,300 8,800 9,620 10,550 11,460 12,360Brewster 2,640 2,790 2,900 2,960 3,010 3,070Chatham 2,920 3,000 3,080 3,090 3,090 3,090Dennis 4,580 4,930 5,180 5,340 5,510 5,670Eastham 1,160 1,220 1,270 1,290 1,320 1,340Falmouth 14,250 14,690 15,160 15,220 15,280 15,350Harwich 3,680 3,950 4,140 4,270 4,390 4,510Mashpee 4,590 5,050 5,350 5,590 5,830 6,060Orleans 4,070 4,250 4,410 4,470 4,520 4,580Provincetown 2,420 2,440 2,500 2,470 2,440 2,420Sandwich 5,090 5,280 5,460 5,500 5,540 5,580Truro 540 600 630 660 690 720Wellfleet 1,070 1,220 1,320 1,400 1,490 1,580Yarmouth 8,500 8,840 9,150 9,230 9,320 9,410Grand Total 88,900 94,000 98,000 100,000 102,000 104,000Source: Massachusetts Department of <strong>Transportation</strong>TABLE 4 - HOUSEHOLD FORECASTS BY TOWNHouseholdsTown 2010 2017 2020 2025 2030 2035Barnstable 19,225 20,510 21,040 22,120 23,000 23,890Bourne 7,866 8,470 8,720 9,220 9,630 10,050Brewster 4,383 5,020 5,280 5,770 6,220 6,660Chatham 3,085 3,320 3,420 3,610 3,770 3,930Dennis 6,928 7,020 7,060 7,180 7,240 7,300Eastham 2,388 2,480 2,510 2,600 2,660 2,720Falmouth 14,069 15,240 15,730 16,690 17,500 18,310Harwich 5,623 6,220 6,470 6,940 7,360 7,770Mashpee 6,118 7,130 7,560 8,350 9,060 9,770Orleans 2,950 3,110 3,170 3,310 3,420 3,530Provincetown 1,765 1,940 2,010 2,160 2,280 2,400Sandwich 7,776 8,180 8,350 8,700 8,970 9,250Truro 984 1,270 1,390 1,610 1,810 2,010Wellfleet 1,366 1,710 1,850 2,110 2,350 2,590Yarmouth 11,229 11,380 11,440 11,630 11,730 11,820Grand Total 95,755 103,000 106,000 112,000 117,000 122,000Source: Massachusetts Department of <strong>Transportation</strong>Chapter 7: Alternatives <strong>Cape</strong> <strong>Cod</strong> <strong>Regional</strong> <strong>Transportation</strong> <strong>Plan</strong> | August 2011Page 486
7.3 EVALUATION CRITERIAThe evaluation of transportation alternatives is ultimately based on the goals of the<strong>Regional</strong> <strong>Transportation</strong> <strong>Plan</strong> (RTP). For an alternative to be eligible forrecommendation, it must be consistent with, or avoid inconsistencies with any of thegoals of the RTP. These goals, discussed in the first chapter, are summarized as follows:1. Safety and Security2. Congestion Relief3. Multimodal Accessibility4. System Maintenance5. Environmental Protection6. Community Orientation7. Equitability8. Cooperation among StakeholdersMassDOT’s Project Design and Development Guide provides some guidance onperforming evaluations.For example, Highway System Preservation Projects may be evaluated according to:Conditiono Pavement Condition (in consideration of pavement managementprinciples)o Pavement structural adequacy (as available)o Bridge conditiono Condition of other bridge infrastructure elementso Degree and severity of deterioration of other infrastructureo Compliance with minimum access standardsUsageo Traffic volumes and truck usageo Pedestrian and bicycle usage and/or connectivity (as it is sometimesdifficult to provide good pedestrian and bicycle data, connectivity to othertrails, downtown areas, neighborhoods, schools, etc., should also beconsidered)o Effect on connectivity for the closure or restriction of bridgeso Effect on safety and congestionCost Effectiveness (as applicable)o Cost per daily traffic (average daily traffic or ADT) and/orpedestrian/bicycle user, as availableo Cost per lane mileo Cost per ADT/lane mile<strong>Cape</strong> <strong>Cod</strong> <strong>Regional</strong> <strong>Transportation</strong> <strong>Plan</strong> | August 2011Chapter 7: AlternativesPage 487
MassDOT’s guide suggests that System Improvement/Expansion Projects should beevaluated according to:Condition and Service QualityMobilityo Magnitude and duration of congestiono Travel time and connectivity/accesso Number of new pedestrians, bicycles, or transit riders that will use thefacility (if available) or other measure of project’s potential to encouragenon-automobile oriented travel (influenced by the project’s proximity toactivity centers and destinations--downtowns, neighborhoods, schools,parks, etc., as well as by its connectivity to other existing or plannedbicycle and pedestrian routes).Safety and Securityo Crash rate compared to state average (if crash rate is not available, ageneral assessment of anticipated safety impacts can be substituted)o <strong>Transportation</strong> security and evacuation routeso Bicycle and pedestrian safetyo Bicycle comfort index (as described in Chapter 3)Community Effects and Environmental Justiceo Residentialo Environmental justice for low income and minority neighborhoods,including residents that have English as a second language.o Public supportLand Use and Economic Developmento Businesso Sustainable development (including compact & mixed-use development)o Consistency with local and regional plans (including Land Use VisionMaps)Environmental and Air Quality/Climate Effectso Air and water qualityo Historical and cultural resourceso Wildlife habitat and endangered speciesCost Effectivenesso Cost per ADT and/or pedestrian/bicycle user, as availableo Cost per lane mileo Cost per ADT/lane mileRecent <strong>Cape</strong> <strong>Cod</strong> <strong>Regional</strong> <strong>Transportation</strong> <strong>Plan</strong>s included other criteria for evaluation:Travel Miles (1 benefit = 10,000 VMT reduced)Travel Hours (1 benefit = 1,000 VHT reduced)Safety (“Equivalent Property Damage Only” Method)Air Quality (1 benefit = 100kg of VOC or 100 kg of NOx reduced)The <strong>Cape</strong> <strong>Cod</strong> Commission maintains a database of implemented, currently approved,proposed, and potential projects. The database includes summary information such as adescription of the project as well as estimates of the costs associated with it. A "GoalChapter 7: Alternatives <strong>Cape</strong> <strong>Cod</strong> <strong>Regional</strong> <strong>Transportation</strong> <strong>Plan</strong> | August 2011Page 488
Compatibility Analysis" is used as a screening of the project. Should the project detractfrom an RTP Goal, a finding of "Incompatible" may be noted. If one or more"Incompatible" statements occur, the project is considered incompatible and no furtheranalysis is warranted. In addition, a determination is made regarding the amount that aproject contributes to advancing the goal. These scores are numerical values based onqualitative evaluations.Several specific criteria may used in the analysis of projects. Such criteria include:Travel Miles:The benefits quantified for this criterion are based on the output of the regionaltransportation model when available. 1 Benefit = 10,000 modeled VMT reduced. If aproject is expected to have automobile travel mileage reduction but does not lend itself tomodeling, the best estimates of the benefits will be used.Travel Hours:The benefits quantified for this criterion are based on the output of the regionaltransportation model when available. 1 Benefit = 1,000 modeled VHT reduced. If aproject is expected to have regional travel time reduction but does not lend itself tomodeling, the best estimates of the benefits will be used.Safety:Solutions for areas with the largest safety problems are likely to have the greatest benefit.Safety evaluations may be based on the “EPDO” method where the EPDO, or “EquivalentProperty Damage Only” is calculated by assigning a value of 5 to each injury crash and 10to each fatality crash. For intersections EPDO is adjusted by Million Entering Vehicles(MEV) and for road segments is adjusted by Million Vehicle Miles Traveled (MVMT).These figures are expected to be used in future improvements to the projects database.Air Quality:Benefits are related to reductions in the precursors of ozone as determined from outputof the regional transportation model air quality programs (when available). 1 Benefit =reduction of 100 kg of VOC or 100 kg of NOx.Goal Benefit:Based on scores developed under the compatibility analysis, the scores are multiplied byweighting factors (currently 1) and added together to equal the goal benefit.<strong>Cape</strong> <strong>Cod</strong> <strong>Regional</strong> <strong>Transportation</strong> <strong>Plan</strong> | August 2011Chapter 7: AlternativesPage 489
A transportation project may have benefits under several criteria. The magnitude ofthese benefits is comparable between projects. This means that a large project whencompared to a smaller one (e.g., a multi-town transit service vs. a smaller service in asingle village) would have greater quantified benefits (e.g., more reduced automobilemileage). All the criteria benefits may be totaled together into a "Benefit Level."The Benefit Level can then be divided into the RTP Projected Cost (in millions of dollars)to come up with a "Score." This method allows the relative benefits of large and smallprojects to be compared on a benefit/cost basis.7.3.1.1 <strong>Cape</strong> <strong>Cod</strong> <strong>Regional</strong> Transit Authority PrioritiesThe <strong>Cape</strong> <strong>Cod</strong> <strong>Regional</strong> Transit Authority (CCRTA) is both an important member of the<strong>Cape</strong>’s transportation planning organization and a provider of essential transportationservices. In the development of priorities for the RTP, the CCRTA supports the followingbroad categories:• Transit Enhancements• Transit Service Expansion• Transit Capital Improvements to all CCRTA parcels of land• Transit Energy Efficient projects and programs• Rail Operating Assistance• Transit ITS Improvements• Transit Operating Assistance• Transit Capital Needs• Rerouting/Redirecting Current Transit RoutesChapter 7: Alternatives <strong>Cape</strong> <strong>Cod</strong> <strong>Regional</strong> <strong>Transportation</strong> <strong>Plan</strong> | August 2011Page 490
7.4 RECENT CCC TRANSPORTATION PLANNING EFFORTSThis section includes summaries of transportation recommendations from effortsundertaken since the 2007 RTP.7.4.1 YARMOUTH ROAD CORRIDOR STUDY/HYANNIS ACCESS STUDYIMPLEMENTATIONYarmouth Road in Barnstable experiences significant vehicle queues during peak hoursof operation. The corridor is the primary access for some <strong>Cape</strong> towns to the <strong>Cape</strong> <strong>Cod</strong>Hospital. Seasonal and peak hour congestion often delay emergency vehicles access tothe Hospital. The intersection of Yarmouth Road and Route 28 in Barnstable is a knownhigh crash location and is identified in the Hyannis Access Study as an intersection inneed of improvements. Yarmouth Road serves as an important access road into HyannisCenter, which accommodates both commercial and business development. HyannisCenter was recently approved as a Growth Incentive Zone. A viable Yarmouth Roadcorridor is significant for many modes of transportation, including walking, biking,automobile, transit and rail. The Hyannis <strong>Transportation</strong> Center is located off Route 28,a short distance from the Yarmouth Road/Route 28 intersection. The Yarmouth RoadCorridor Study has examined each mode of transportation (walking, biking, automobile,transit and rail). After many months of review and public input, “Concept 1a” has beenrecommended (see figure below). Concept 1a and 1b are continuations of the four-lanedivided Willow Street roadway that currently exists near Route 6 Interchange 7.Concepts 1a continues that four-lane divided roadway from the Higgins CrowellStreet/Willow Street intersection in Yarmouth to the Route 28/Yarmouth Roadintersection in Barnstable. Concept 1a uses a westerly alignment at the Route28/Yarmouth Road intersection.Concept 1a and all other considered concepts include a multi-use path. These conceptsare available for viewing by at:www.gocapecod.org/yarmouthroad<strong>Cape</strong> <strong>Cod</strong> <strong>Regional</strong> <strong>Transportation</strong> <strong>Plan</strong> | August 2011Chapter 7: AlternativesPage 491
FIGURE 1 - YARMOUTH ROAD CONCEPT 1A<strong>Plan</strong>ning for improvements recommended by MassDOT’s Hyannis Access Study includea potential grade-separation of the Airport Rotary. The following figure shows aChapter 7: Alternatives <strong>Cape</strong> <strong>Cod</strong> <strong>Regional</strong> <strong>Transportation</strong> <strong>Plan</strong> | August 2011Page 492
edesign of the rotary as a modern roundabout with the two approaches of Route 28connected via an underpass.FIGURE 2 - HYANNIS ACCESS STUDY IMPLEMENTATION - AIRPORT ROTARY GRADESEPARATION7.4.2 ROUTE 6A CORRIDOR MANAGEMENT PLAN UPDATERoute 6A consists of approximately 34 miles of state highway that extends along the<strong>Cape</strong> <strong>Cod</strong> Bay shoreline, traversing seven communities from the village of Sagamore inthe town of Bourne to the U.S. Highway Route 6 Rotary at the Eastham/Orleans border.The Massachusetts state legislature designated the roadway as a “Scenic Byway” in 1992,in recognition of its distinctive scenic and historic character. In 1995, the <strong>Cape</strong> <strong>Cod</strong>Commission (CCC) issued the Route 6A Corridor Management <strong>Plan</strong> (CMP) through agrant provided by the state’s Interim Scenic Byways program. The main purpose of theplan was to focus on resource protection along the corridor while addressing traffic andsafety needs. A secondary purpose was to inform MassDOT policy on management ofscenic roads and to assist in the development of the state’s Scenic Byways program. Thepurpose of the Route 6A Corridor Management <strong>Plan</strong> Update is to continue the same<strong>Cape</strong> <strong>Cod</strong> <strong>Regional</strong> <strong>Transportation</strong> <strong>Plan</strong> | August 2011Chapter 7: AlternativesPage 493
mission as the original plan, using current data. The full text of the CMP Update isavailable online:www.gocapecod.org/6Away<strong>Transportation</strong> Recommendations from the CMP update include:General <strong>Transportation</strong> Improvement Strategies:The following strategies advance the goals of the CMP and serve as the basis for thetransportation implementation recommendations:Improve access management. By combining driveways, constructing interconnectionsbetween adjacent parcels, or eliminating excess driveways andunnecessary “wide-open” pavement, traffic flow and safety is improved.Encourage non-automobile travel of the corridor. Alternate travel modesshould be supported by development of non-automobile transportation facilities,education, and marketing. Using alternate transportation such as biking andwalking reduces the impacts on air quality, safety, and energy use associated withautomobile travel and enhances the Route 6A experience by reducing traffic.Develop flexible roadway standards. Allowing for narrower travel lanes canencourage lower travel speeds and enhance the safety of non-motorized travelsuch as walking or biking.<strong>Transportation</strong> Implementation RecommendationsThe following recommendations for implementation advance strategies to address trafficflow and safety along Route 6A, as well as support other CMP goals.IMPLEMENTATION RECOMMENDATION:Speed-management techniquesThe 1995 CMP recommended exploring “speed zoning” to address safety concerns onRoute 6A. Speed zoning is the process of (1) recording the speeds of vehicles on asegment of roadway and (2) setting the “appropriate” speed limits. Determination of thespeed limit usually is based on the speed at which 85 percent or few motorists travelalong that given segment of the road. The current speed zones on Route 6A vary, withchanges occurring over relatively short distances. Drivers frequently exceed the speedlimit; in many of the higher speed zones (speed limit 45 mph) this impacts the comfortand safety of pedestrians and bicyclists.The traditional method of establishing speed limits would likely result in higher speedlimits throughout the corridor, which would be inappropriate with the scenic bywaysprogram goals of accommodating a variety of roadway users (including pedestrians andChapter 7: Alternatives <strong>Cape</strong> <strong>Cod</strong> <strong>Regional</strong> <strong>Transportation</strong> <strong>Plan</strong> | August 2011Page 494
icyclists). Establishing greater uniformity in the corridor’s speed limits and loweringthem in areas where speed limits are high to better serve the various types of users wouldimprove safety along the corridor.The greatest potential benefit of speed management for Route 6A is to bring uniformityand reduce the variability of average travel speeds. Higher travel speeds generally are notas great a concern for safety as differences in speeds and the resulting conflicts. It isimportant to keep in mind that compliance is necessary for speed limits to be effective.The Institute of <strong>Transportation</strong> Engineers has issued the following reasons for usingcaution when establishing speed limits:What realistic speed limits do:Encourage compliance from the majority of drivers;Give a clear reminder of reasonable and prudent speeds;Provide an effective enforcement tool to the police;Minimize public antagonism toward police enforcement, which results fromobviously unreasonable regulations; andEncourage drivers to travel at the speed where the risk of crash involvement isthe lowest.What unrealistic speed limits do:Discourage voluntary compliance;Create the perception of “speed traps;”Cause public antagonism toward the police;Create a bad image for a community in the eyes of tourists; andMay increase the potential for crashes.“Traffic calming” techniques such as geometric and visual cues can also be used toencourage motorists to travel at safer speeds. This approach involves reducing theperceived width or straightness of the travel lane through changes in pavement texturealong the shoulders; pavement markings; strategic use of curbing; and other techniquesto give motorists cues to drive slower. For information on traffic-calming techniques,see:Educational and enforcement programs:http://www.gocapecod.org/calming.htmLower speed limit signs alone generally are ineffective for reducing speed. New signage(e.g., “High Traffic Enforcement Area”) may have an immediate effect on motoristbehavior, but absent other factors (such as constant police attention), the signage overtime may be ignored. Traditional speed enforcement has limited “educational” value<strong>Cape</strong> <strong>Cod</strong> <strong>Regional</strong> <strong>Transportation</strong> <strong>Plan</strong> | August 2011Chapter 7: AlternativesPage 495
since it is usually intermittent or only in effect in a few ideal locations (due to visibility,officers’ safety etc).In some states, speed enforcement is accomplished via speed cameras coupled withtraffic radar equipment. When a vehicle is measured to be traveling over the speed limit,digital cameras record images of the driver and the license plate, along with data such astravel speed, time and date, etc. The information is reviewed for accuracy and then acitation is mailed to the motorist. Massachusetts laws do not explicitly supportenforcement through speed cameras. However, in recent years legislation has supportedthe Massachusetts Turnpike Authority’s use of camera-based automated enforcement ofelectronic toll lanes. For a review of state laws that affect implementation of strategiessuch as “photo radar,” see the Governors Highway Safety Association:http://www.statehighwaysafety.org/html/stateinfo/laws/auto_enforce.htmlIn summary, speed management for the Route 6A corridor should include the followingelements:Establish 35 miles per hour speed limits for the entire scenic byway;Establish 25 miles per hour speed limits within village centers along the scenicbyway;Reduce travel lane width to 10 feet (remaining width for shoulder use by nonmotorizedtravel); andExplore educational and enforcement programs.IMPLEMENTATION RECOMMENDATION:Connect sidewalks throughout the Scenic Byway (on both sides of the road in villagecenters)Substantial areas along Route 6A have no pedestrian paths. Without accommodationsfor walking (for pleasure/recreation or for a short trip), travelers are forced to choosecars. Sidewalks serve a basic need for many of the shorter trips along the byway. Whenpedestrians are not present, sidewalks are also useful for beginning cyclists and lowspeed biking. MassDOT has indicated that 4-foot wide sidewalks are acceptable(narrowing intermittently to 3-feet at restrictions such as utility poles).IMPLEMENTATION RECOMMENDATION:Provide public transit serviceProviding continuous, frequent, and coordinated public transit service can support othernon-automobile uses (bikes are accommodated on racks of all <strong>Cape</strong> <strong>Cod</strong> <strong>Regional</strong> TransitAuthority buses) throughout the corridor. Public transit uses relieve the stress ofautomobile demand and its associated congestion and safety problems. One of the mostChapter 7: Alternatives <strong>Cape</strong> <strong>Cod</strong> <strong>Regional</strong> <strong>Transportation</strong> <strong>Plan</strong> | August 2011Page 496
viable options for improving public transit and access along the corridor would be toprovide summer shuttle service. A Route 6A summer shuttle bus could serve as analternative to automobile travel for visitors and residents during the peak seasons whencar traffic is heaviest on the roadway.IMPLEMENTATION RECOMMENDATION:RoundaboutThe intersection of Route 6A/Route 132 is a concern for drivers due to the wide expanseof pavement, high speed approaches, and complicated traffic channelization. In addition,non-motorized travel such as by bicycle is highly risky since some turning maneuversrequire multiple points of exposure to potential side-on collisions. The current <strong>Cape</strong> <strong>Cod</strong><strong>Regional</strong> <strong>Transportation</strong> <strong>Plan</strong> (RTP) has identified construction of a roundabout at thislocation as the 19th highest priority project on <strong>Cape</strong> <strong>Cod</strong>. According to the RTP, such aproject would “improve traffic flow and safety of the Route 6A/Route 132 intersectionthrough channelization of traffic movements (roundabout).”The following figure illustrates a roundabout concept for the intersection of Route6A/Route 132. Modern roundabouts have been shown to improve traffic safety andtraffic flow as well as provide other community benefits. The geometry of a properlydesigned roundabout encourages low-speed entry, circulation, and exit that is consistentfor each approaching roadway. In certain circumstances roundabouts can havesignificantly improved operations compared to signalized intersections and manyunsignalized intersections. The main advantage of roundabouts is that they providecontinuous traffic flow, as there is no “all-red” phase where all traffic must stop. Aroundabout’s continuous traffic flow generally results in less noise than the stop-idleacceleratetraffic movements of a signalized intersection.A correctly designed roundabout encourages consistent lower speeds of all users—a saferoption—versus the wide range of operating speeds at a signalized or unsignalizedintersection (containing a mixture of stopped vehicles and high-speed through traffic).Additionally, the geometry of a modern roundabout is well-suited for creating a“gateway” to welcome visitors to a special area.Due to the proximity of residences to the Route 6A/Route 132 intersection, it isimportant to use a low noise-emitting surface for the truck apron (the rumble strip insidethe circulating roadway). A stamped-asphalt installation (as used at the Route 39/QueenAnne’s Road roundabout in Harwich) is recommended.<strong>Cape</strong> <strong>Cod</strong> <strong>Regional</strong> <strong>Transportation</strong> <strong>Plan</strong> | August 2011Chapter 7: AlternativesPage 497
FIGURE 3 - INTERSECTION OF ROUTE 6A, ROUTE 132, AND OAK STREET IN BARNSTABLE(Photo taken from Route 132, facing north. Source: CCC)FIGURE 4 - ROUNDABOUT CONCEPT: RT 6A, RT 132, OAK ST IN BARNSTABLEChapter 7: Alternatives <strong>Cape</strong> <strong>Cod</strong> <strong>Regional</strong> <strong>Transportation</strong> <strong>Plan</strong> | August 2011Page 498
IMPLEMENTATION RECOMMENDATION:Shared-use pavement markingsTraffic lanes on roads such as Route 6A are often too narrow for sharing side-by-side bybicyclists and passing automobiles or trucks. Bicyclists riding too close to the roadwayedge run the risks of being run off the road, being “clipped” by overtaking motorists whomisjudge passing clearance, or encountering drainage structures, poor pavement, debris,and other hazards.Riding farther to the left may help avoid these problems (and is legally permitted whereneeded for safety) but can run counter to motorist expectations and be hazardous. Apavement marking that indicates the legal and appropriate bicyclist line of travel, andcues motorists to pass with sufficient clearance, is recommended for certain locations onroute 6A.Guidance for proper installation indicates that a shared-lane marking should not beplaced on roadways that have a speed limit above 35 miles per hour. Markings should beplaced immediately after an intersection and spaced at intervals not greater than 250feet thereafter. If used on a street without on-street parking (like most of Route 6A), thecenters of the markings should be at least 4 feet from the face of the curb, or from theedge of pavement where there is no curb. The centers of the markings should be 11 feetfrom the edge where there is parking.An example of a “sharrow” pavement marking on a narrow road is shown in thefollowing photo:<strong>Cape</strong> <strong>Cod</strong> <strong>Regional</strong> <strong>Transportation</strong> <strong>Plan</strong> | August 2011Chapter 7: AlternativesPage 499
FIGURE 5 - "SHARROW" PAVEMENT MARKING(Source: National Committee on Uniform Traffic Control Devices 2007)For Route 6A, the most effective use of the sharrow markings would be on road segmentsthat are not served by alternate routes suitable for regional bike travel. Four segments ofRoute 6A do not have suitable alternate routes for bicycle use. These are identified by awestern and an eastern roadway intersection as shown in the Table 4 (next page).TABLE 5 - ROUTE 6A ENHANCED BICYCLE ACCOMMODATION SEGMENTSTown Western Transition Eastern TransitionLength(miles)Sandwich Chipman Road Spring Hill Road 0.5Sandwich Jacobs Meadow Road Old County Road 0.4Barnstable Parker Road Keveney Lane 5.0Brewster Stony Brook Rd (E) Tubman Road 0.1The longest segment is approximately five miles long from Parker Road to Keveney Lanein Barnstable.Chapter 7: Alternatives <strong>Cape</strong> <strong>Cod</strong> <strong>Regional</strong> <strong>Transportation</strong> <strong>Plan</strong> | August 2011Page 500
IMPLEMENTATION RECOMMENDATION:Collect vehicle classification dataThe <strong>Cape</strong> <strong>Cod</strong> Commission traffic counting program should collect vehicle classificationdata at all Route 6A automated traffic count locations. (Twelve locations are scheduledfor the 2010 traffic counts.) This will help determine the number of large trucks usingRoute 6A, which not only poses potential safety concerns but also could impact thecondition of the roadway.7.5 ADDITIONAL REGIONAL EFFORTSThis section provides summaries of regional efforts that are likely to benefit the <strong>Cape</strong>’stransportation system.7.5.1 OPENCAPEThe Open<strong>Cape</strong> initiative will provide a fiber-optic backbone for <strong>Cape</strong> <strong>Cod</strong>. This willprovide capacity to support intelligent transportation systems in two ways: directconnections and 700 MHZ radio systems. This $40 million project is underway and isexpected to be complete by 1/31/2013.The <strong>Cape</strong> <strong>Cod</strong> ITS implementation planning has been oriented toward utilization of thissystem. There are 12 strands available to the Commonwealth for their use and it isexpected these will be incorporated into the <strong>Cape</strong>’s eventual ITS design.7.5.2 LOCAL TRANSPORTATION CENTER STUDYSites for local transportation centers were recommended in short- and long-term publictransportation plans. FTA funding to develop locations on the Lower and Outer <strong>Cape</strong>were provided and a site selection was done for Orleans and two concepts were exploredin Provincetown. Currently, the town of Orleans is not interested in hosting atransportation center and funding for the Provincetown center has not been identified.7.5.3 TRANSPORTATION PARTNER STUDYThe <strong>Transportation</strong> Partner Study included the development of inexpensive wirelessautomatic vehicle location technology and has been included on public and privatetransportation. The system will include local transit, intercity bus, and ferries. The real-<strong>Cape</strong> <strong>Cod</strong> <strong>Regional</strong> <strong>Transportation</strong> <strong>Plan</strong> | August 2011Chapter 7: AlternativesPage 501
time vehicle locations will be used to allow “smart transfers” when congestion makesschedules difficult to maintain (see link below):http://www.geolabvirtualmaps.com/<strong>Cape</strong><strong>Cod</strong><strong>Regional</strong>TransitAuthority_Legacy.aspx7.5.4 RENEWABLE FUEL PARTNERSHIPThis initiative provided forums for biodiesel and ethanol education. Barnstable Countymade biodiesel available through their procurement process that many towns takeadvantage of. The next step for this group is development of a Renewable Fuels StrategicImplementation <strong>Plan</strong> which is currently unfunded.7.5.5 CULTURAL COAST FERRY PLAN<strong>Plan</strong>ning for a “Cultural Coast” ferry system was initiated by the MassachusettsChambers of Commerce and Congressman Delahunt. The planning looked at a servicenetwork primarily to serve National Parks from the Boston Harbor Islands to the <strong>Cape</strong><strong>Cod</strong> National Seashore with a hub located in Quincy at the Squantum Pier. Finalrecommendations for this system have not been made.7.5.6 COORDINATED HUMAN SERVICE TRANSPORTATION PLANThe Coordinated Human Service <strong>Transportation</strong> <strong>Plan</strong> development included asignificant out reach to transportation providers within the Barnstable Urbanized Area(UZA) defined by the 2000 U.S. Census. The plan developed the following goals andobjectives:1. <strong>Plan</strong> Goals and Objectives1.1. Service Improvements1.1.1. Goal 1 – provide service to address barriers and unmet needs for; journeyto work, weekends and available span of service.Objectives• Provide weekend and evening service• Improve journey to work optionso Improve service opportunities for day care accesso Improve outreach to employers1.1.2. Goal 2 – Encourage service opportunities in underserved areas.Objectives• Provide opportunities for:o Fixed route service in the Bourne/Falmouth areao Service between Barnstable and Sandwich especially tosupport elder day care programso Service to the <strong>Cape</strong> <strong>Cod</strong> Career CentersChapter 7: Alternatives <strong>Cape</strong> <strong>Cod</strong> <strong>Regional</strong> <strong>Transportation</strong> <strong>Plan</strong> | August 2011Page 502
o Increased use of taxi services1.1.3. Goal 3 – Improve accessible servicesObjectives• Provide additional accessible vehicles in:o Warehamo Carvero Mariono Rochestero Bourneo Plymoutho Sandwicho Other underserved areas• Improve demand response scheduling• Encourage medical escort services• Expand the number of handicap accessible taxis1.2. Service Coordination1.2.1. Goal 4 - Reduce duplication of services.Objectives• Form a coordination body• Development of a regional reservation and dispatch process• Consolidation of trips for different funding agencies, wherepossibleo Encourage inter agency cooperation where cost and ridesharing is possible.1.2.2. Goal 5 – Improve service planningObjectives• Update the <strong>Cape</strong> <strong>Cod</strong> 5-Year Public <strong>Transportation</strong> <strong>Plan</strong>• Support more inter regional RTA planning for services• Develop more outreach programs to schools, employers, andhuman service organizations to determine barriers totransportation, unmet needs and opportunities.7.5.7 OUTER CAPE MAINTENANCE FACILITY STUDYThe primary goal of this study is to assess the suitability of a satellite vehiclemaintenance facility on the Outer <strong>Cape</strong> as a means of addressing some of the operationalchallenges and maintenance needs of <strong>Cape</strong> <strong>Cod</strong> National Seashore and its partners. Thecentral finding of the study is that while such a satellite facility would indeed reducedeadheading time for transit vehicles serving the Outer <strong>Cape</strong>, and potentially yield othermaintenance efficiencies, these savings would be greatly outweighed by the substantialupfront capital costs need for construction of the facility. Moreover, certain changes thathave taken place since the project was originally proposed, such as reductions in thefrequency of transit service on the Outer <strong>Cape</strong>, have reduced the prospects for costeffectiveness.<strong>Cape</strong> <strong>Cod</strong> <strong>Regional</strong> <strong>Transportation</strong> <strong>Plan</strong> | August 2011Chapter 7: AlternativesPage 503
The study report has presented an overview of three alternative approaches that wouldyield at least some of the advantages of a satellite facility at much lower cost: a simpleovernight storage space for transit vehicles, a scaled-down satellite maintenance facility,and a mobile maintenance unit. Each of these approaches has its own set of tradeoffsand partnership considerations. Based on the information collected in the study andstakeholder feedback received, the mobile maintenance unit appears to warrant furtherexamination as means of addressing many of the Outer <strong>Cape</strong>’s maintenance needs in acost-effective way. Key implementation issues such as forging an effective partnershipfor sharing the mobile resource and its costs, developing an acceptable serviceagreement, and addressing the potential impacts on existing in-house maintenance andstaffing, are beyond the scope of the study but would need to be addressed by projectpartners before proceeding. Finally, it is also important to consider the virtues of a “noaction” alternative. Current vehicle maintenance arrangements on the Outer <strong>Cape</strong>involve certain inefficiencies such as towing vehicles long distances for service, yet mayrepresent the most cost-effective approach for a region with relatively low populationdensity and modest maintenance needs.A recommended next step would be to form a task force (perhaps under the auspices ofthe Outer <strong>Cape</strong> Inter-Municipal Coordination Committee) that would evaluate theviability of a shared mobile maintenance unit by gauging interest and studyinginstitutional and financial options. The primary issues that the task force would need toexamine are:• Partners’ preferences for in-house vs. contracted maintenance• Inventory of partners’ maintenance activities for which a mobile unit would bepreferred over current practices and associated costs• Operational changes from use of the mobile unit• Ability to have a mobile unit dedicated to the Outer <strong>Cape</strong>, given projectedmaintenance needs• Staffing and labor issues and (for Towns) any limitations due to the Pacheco Law• Legal mechanisms (e.g. MOU) to govern cost-sharing among partners and the use ofthe mobile unit.7.5.8 MONOMOY ACCESS STUDYThis study developed alternative transportation options to improve access between theMonomoy Wildlife Refuge and Chatham area, with potential connections to otherFederal Lands. Alternatives included: satellite parking with a shuttle, relocation of theMonomoy Visitor Center, roadway improvements, and bicycling improvements.Currently the Refuge manager is exploring shuttle bus options.Chapter 7: Alternatives <strong>Cape</strong> <strong>Cod</strong> <strong>Regional</strong> <strong>Transportation</strong> <strong>Plan</strong> | August 2011Page 504
7.5.9 PARKING AND TRANSIT STUDYThis study developed parking projections for Outer <strong>Cape</strong> beaches and projected erosionfor a 20 year horizon. The study also developed information on beach capacity andconstraints due to other issues such as area at high tide, lifeguards, and bathhouse septiccapacity.The study developed alternative parking sites and shuttles to meet expected parkingneeds and to centrally locate this parking rather than rebuild it in a fragile shorelineenvironment. A number of options were identified for contingencies in the event of amajor loss in beach parking. The most likely catastrophic loss would be in the area nearNauset High School which was identified as a primary alternative for consideration.7.5.10 ITS IMPLEMENTATION PLANROADMAP STEP 1: COMPLETE SYSTEM EXPLORATION AND ASSESSFEASIBILITYThe first step of the roadmap comprises two elements that together produce an optimalconcept for the system (or systems) to be formally designed and implemented.Stakeholders should be involved again as appropriate as problem definition andfeasibility assessment proceed.<strong>Complete</strong> System ExplorationThe goal of this element is to achieve a confirmation that the conditions in need of ITSsolutions have been correctly defined so that the solutions are on target. It will have theNational Seashore, its planning partners, and stakeholders systematically arrive at acommon definition of the condition to be remedied, define the evaluation criteria forassessment and comparison of alternative solution ideas, expand the array of systemconcepts, and align those concepts with real-world ITS solutions.Assess Project FeasibilityThe revised system concepts are assessed against the evaluation criteria to see if they aretechnically, economically, and operationally viable.ROADMAP STEP 2: REVISE THE CONCEPTS OF OPERATIONS ANDREQUIREMENTSWith the completion of this first reality check against market packages and actual ITSsystems, the National Seashore and its collaborators will be in a position to re-cast their<strong>Cape</strong> <strong>Cod</strong> <strong>Regional</strong> <strong>Transportation</strong> <strong>Plan</strong> | August 2011Chapter 7: AlternativesPage 505
description of the systems of interest. Any revision to the functional requirements forthe new systems should also be worked through.The Roadmap shows these revisions to be successive. While the ConOps drives therequirements, ITS planning is a heavily iterative exercise, and so these two steps willessentially happen in tandem.ROADMAP STEP 3: OBTAIN A DETAILED ENGINEERING PLANIn this step, the National Seashore will secure the services of an engineering consultant.The consultant will offer expert advice on technical matters and perform the necessaryfield work and measurements to translate the system’s requirements into detailedtechnical specifications and a preliminary design.ROADMAP STEP 4: CONSIDER DEPLOYMENT STRATEGIESSome systems can be implemented all at once. Others for reasons of feasibility and/orexternal conditions are rolled out in stepwise fashion. A very important factor in thischoice should be the National Seashore’s level of experience with ITS deployment todate, and its comfort level with taking on the management and operations of newsystems.ROADMAP STEP 5: CHOOSE A PROCUREMENT MODEL AND PROCUREThe procurement process includes four dimensions: work distribution, method of award,contract form, and contract type. Once these key procurement decisions have been madethen appropriate terms and conditions can be identified.ITS system procurement decisions should be driven as much by how, and by whom, theproject will be executed as by the intended system’s purpose and functional and technicalspecifics. Any ITS project has a much greater chance of coming in on time and on budgetif it performs thorough planning in advance of the project’s administrative and technicalmanagement.This aspect of project planning involves:• assignment of project management responsibility and authority to individualsexperienced in ITS deployment, and• development of a detailed project plan and a systems engineering managementplan.Chapter 7: Alternatives <strong>Cape</strong> <strong>Cod</strong> <strong>Regional</strong> <strong>Transportation</strong> <strong>Plan</strong> | August 2011Page 506
The sponsoring agency has to factor into its planning how experienced it is with ITSdeployment, and whether it has the appropriate personnel (that is, both experienced andsufficiently available) needed to manage the project so that it is executed on time andwithin budget. When necessary, the project management function can be procured; inthat event the contractor develops the project and systems engineering plans as earlydeliverables. The sponsoring agency must still dedicate resources to assure activeoversight of the project at all times.The project plan documents how the project will be managed and controlled from aprogrammatic standpoint. It identifies the detailed work plans for both administrativeand technical tasks. For each project task, the PP documents what is to be done, bywhom, with what funds, when, how (processes to be used), and dependencies. Thesystems engineering management plan defines how the engineering portion of theproject will be executed and controlled. It describes how the efforts of system designers,test engineers, and other engineering and technical disciplines will be integrated,monitored, and controlled during the complete life cycle.ROADMAP STEP 6: EXECUTE AND OVERSEE PROJECTEven when the administrative and technical planning and management of an ITS projectare procured, the sponsoring agency has a significant role to play throughout projectimplementation. Each step in the systems engineering process has a gate at itstermination that formally precludes going on to the next step until a series ofdocumentation review and acceptance procedures are executed with the participation ofagency personnel with assigned authority and responsibilities. At the completion of theproject, after it has been installed and tested, the agency is responsible for the finalacceptance testing. The system should not be accepted unless it passes this test.Additionally, the agency must validate the system once it is operating to confirm that thesystem has been built, is functioning as intended, and is having the desired impact inrelation to the stakeholder needs it was originally conceptualized to address. In that waythe benefits of the system are documented relative to its costs.7.6 TRANSPORTATION ALTERNATIVESThe following pages contain a listing of alternatives considered for the <strong>2012</strong> RTP. It isexpected that alternatives meeting MPO approval would undergo further analysis per theprocedures outlined in the previous section. For this document, transportationalternatives were identified through an extensive public participation process and inconsultation with local, state, and federal transportation officials. Commissiontransportation staff compiled a ranking of alternatives for each of the following fourcategories of alternatives:<strong>Cape</strong> <strong>Cod</strong> <strong>Regional</strong> <strong>Transportation</strong> <strong>Plan</strong> | August 2011Chapter 7: AlternativesPage 507
<strong>Transportation</strong> Programs;<strong>Transportation</strong> Projects;Smart Solutions; and<strong>Transportation</strong> Studies.7.6.1 TRANSPORTATION PROGRAMS<strong>Transportation</strong> Programs are intended to allow funding over the life of the plan (to 2035)for projects that are program-compatible but may not yet be specified. For example, themost important program, Roadway Maintenance, is expected to have numerousindividual projects associated with it but these cannot be specifically identified at thistime. The following table presents a priority listing of <strong>Transportation</strong> Programs.Priorities were developed through public input and consultation with <strong>Cape</strong> <strong>Cod</strong>Commission, <strong>Cape</strong> <strong>Cod</strong> Joint <strong>Transportation</strong> Committee members, and refinementsrequested by the <strong>Cape</strong> <strong>Cod</strong> Metropolitan <strong>Plan</strong>ning Organization. Some of the followingheadings are used in the table:RTP# Index number used for reference. Numbers followed by an “S” are fundedthrough a program sponsored by the <strong>Cape</strong> <strong>Cod</strong> National Seashore.Type Rank For “Type,” each alternative is listed as one of the following: Program,Project, Smart Solution, or Study. Ranking based on importance (#1being most important). Unranked alternatives are also supported. Nonsupportedprojects have been eliminated from the listing.Town Geographic area.Title Short listing.Description Longer descriptionCategory Some alternatives may also benefit other categories (e.g., many“Highway” alternatives also have benefits to “Safety” alternatives.“Highway” may also have congestion and mobility benefits as well).Ann. Cost estimated recurring operating cost or average funding allocation (mayvary from year to year)Start Cost One time cost (e.g., construction cost or capital purchase)Total Cost Calculation of Start Cost + Ann. Cost x 23 YearsChapter 7: Alternatives <strong>Cape</strong> <strong>Cod</strong> <strong>Regional</strong> <strong>Transportation</strong> <strong>Plan</strong> | August 2011Page 508
Printed: 6/13/2011 Programs <strong>Cape</strong> <strong>Cod</strong> <strong>Regional</strong> <strong>Transportation</strong> <strong>Plan</strong>RTP# Type Rank TOWN Title Description Category Ann.Cost/yr($K)StartCost($K)TotalCost($K)3000 Program 1 <strong>Cape</strong>wide Roadway Rehabilitation & Reconstruction Roadway resurfacing, rehabilitation, and reconstruction Highway 360,000 8,280,0003020 Program 2 <strong>Cape</strong>wide Bridge Bridge Replacement/Reconstruction Bridge 9,000 207,0003001 Program 3 <strong>Cape</strong>wide Intersection Improvements3009 Program 3 <strong>Cape</strong>wide<strong>Cape</strong>-wide Intelligent <strong>Transportation</strong>Systems (ITS)Intersection Improvements, including roundabouts, to address safety andcongestion relief. Includes left-turn lanes & phases at signalizedintersectionsDesign and implement real-time transportation monitoring and notificationtechnologies at facilities throughout <strong>Cape</strong> <strong>Cod</strong>. Includes highway and transitusers traveling to and within Barnstable County.Highway 800 18,400ITS/Management2,500 57,5003022 Program 5 <strong>Cape</strong>wide Bicycle/Pedestrian ProjectsBicycle and/or pedestrian facilities and programs. Includes development of aregional bike network, bike lane construction, bicycling accessibilityimprovements and amenities, pedestrian accessibility improvements andsidewalk network expansion.Bicycle/Pedestrian2,000 3,125 49,1253021 Program 6 <strong>Cape</strong>wide Transit Operating Transit Operating Assistance Transit 3,050 70,1503023 Program 7 <strong>Cape</strong>wide Transit Capital Transit Capital Needs Transit 2,150 49,4503018 Program 8 <strong>Cape</strong>wide Railway Infrastructure Maintain & provide rail infrastructure Rail 2,000 46,0003015 Program 9 <strong>Cape</strong>wide Additional CCRTA Service3024 Program 10 <strong>Cape</strong>wideTravel DemandManagement/<strong>Transportation</strong> SystemsManagement (TDM/TSM)Public transit shuttles connecting villages along Route 6A from Sandwich toOrleans, Provincetown-Orleans Shuttle, etc.Travel Demand Management/<strong>Transportation</strong> Systems Management projects(TDM/TSM). Includes support of <strong>Transportation</strong> Management Associations(TMAs). Provide assistance to employers and institutions for thedevelopment and coordination of alternative transportation options foremployees and patrons.Transit 750 17,250ITS/Management50 1,1503320 Program 10 <strong>Cape</strong>wide Local <strong>Transportation</strong> Centers Construct intermodal transportation centers in Buzzards Bay, Orleans, etc. Transit 166 3,8183034 Program 12 <strong>Cape</strong>wide Underground Utilities/Pole RelocationRemove above ground utilities adjacent to roadways and install themunderground or away from roadsides to improve safety where appropriateSafety 3,000 69,0003007 Program 14 <strong>Cape</strong>wide Traffic Calming Promote the installation of Traffic Calming features at appropriate locations Safety 100 2,3004020 Program 16 <strong>Cape</strong>wide3014 Program 17Harwich toTruroMBTA-Compatible Electronic FareSystems on Transit and Inter-City BusesElectronic fare system (EFS) on all CCRTA vehicles, interoperable withMassachusetts Bay Transit Authority.Transit 200 4,600Flex Parking Construct or designate parking areas for The Flex transit service Multi-Modal 75 1,7253028 Program 17 <strong>Cape</strong>wide Park-and-Ride Lot ManagementMonitor parking usage of parking facilities at Barnstable (Exit 6), Sagamore,Harwich (Exit 10); identify & acquire new facilities, expansions as necessaryMulti-Modal 10 2304021 Program 17 <strong>Cape</strong>wide Construction of Enhanced Bus SheltersBuild intelligent, accessible, and energy efficient <strong>Cape</strong> <strong>Cod</strong> style bus sheltersthat provide real-time customer information and amenities.Transit 36 9003011 Program 20 <strong>Cape</strong>wide Access ManagementEligible for all state and local numbered routes. Curb cut consolidation,medians, other access improvementsITS/Management300 6,900<strong>Cape</strong> <strong>Cod</strong> Metropolitan <strong>Plan</strong>ning Organization Programs page 1 of 2
Printed: 6/13/2011 Programs <strong>Cape</strong> <strong>Cod</strong> <strong>Regional</strong> <strong>Transportation</strong> <strong>Plan</strong>RTP# Type Rank TOWN Title Description Category Ann.Cost/yr($K)StartCost($K)TotalCost($K)3035 Program 21 <strong>Cape</strong>wide Congestion ManagementConsider peak period pricing at strategic locations to provide funding fortransportation needsITS/Management-47,000 5,000 -1,076,0003012 Program 22 <strong>Cape</strong>wide <strong>Cape</strong>-wide Flex Service Expand Flex bus service throughout <strong>Cape</strong> <strong>Cod</strong> Transit 100 2,3003027 Program 23Sandwich,Barnstable,Yarmouth,Dennis,Brewster,OrleansRoute 6A/Scenic BywaysCorridor Management <strong>Plan</strong> update and implement recommendedimprovements. Includes connection of sidewalks (on both sides in villages),"Sharrow" pavement markings for bike accommodation. For report, seewww.gocapecod.org/6AwayHighway 10 125 3553002 Program <strong>Cape</strong>wide Land Conservation3004 Program <strong>Cape</strong>wide Transit Marketing & EducationStrategic purchase of land to reduce sprawl and inefficient allocation oftransportation resources. Also used to acquire land for improvement ofintersections and protection of operations at new interchangesImplement education programs and marketing activities to support publictransitITS/Management1,000 23,000Transit 50 1,1503005 Program <strong>Cape</strong>wide Safe Routes to SchoolsInstallation of sidewalks and provide other improvements and programs topromote safe routes to schoolsBicycle/Pedestrian30 6903019 Program <strong>Cape</strong>wide Red Light Running CamerasSupport legislation to allow installation of red-light running cameras at highcrashsignalized intersectionsSafety 200 4,6003025 Program <strong>Cape</strong>wide New Ferry Service Passenger ferries connecting <strong>Cape</strong> <strong>Cod</strong> harbors Ferry 250 5,7503033 Program <strong>Cape</strong>wide Vegetation ManagementImplement a comprehensive program to trim/remove vegetation fromencroaching areasSafety 450 10,3503036 Program <strong>Cape</strong>wide Street Lighting Install street lighting in woody areas where appropriate Safety 10,000 230,0003037 Program <strong>Cape</strong>wide Bus Service Amenities Provide bus schedule signage & related amenities Transit 150 3,4503040 Program <strong>Cape</strong>wide Low-Floor Loading Buses Purchase/acquire low-floor loading buses for <strong>Cape</strong> <strong>Cod</strong> services Transit 1,125 25,8754008 Program <strong>Cape</strong>wide Signal Preemption4076 Program <strong>Cape</strong>wideMashpee Wampanoag Roadway &Transit ProjectsInstall and maintain signal preemption hardware at traffic signals to improvepublic safety vehicle accessImplement roadway& transit improvements to improve accessibility & mobilityto and within tribal lands in MashpeeSafety 225 5,175Multi-Modal 200 4,600<strong>Cape</strong> <strong>Cod</strong> Metropolitan <strong>Plan</strong>ning Organization Programs page 2 of 2
7.6.2 TRANSPORTATION PROJECTS<strong>Transportation</strong> Projects are alternatives specific to location and effect. The followingtable presents a priority listing of <strong>Transportation</strong> Programs. Priorities were developedthrough public input and consultation with <strong>Cape</strong> <strong>Cod</strong> Commission, <strong>Cape</strong> <strong>Cod</strong> Joint<strong>Transportation</strong> Committee members, and refinements requested by the <strong>Cape</strong> <strong>Cod</strong>Metropolitan <strong>Plan</strong>ning Organization. Some of the following headings are used in thetable:RTP# Index number used for reference. Numbers followed by an “S” are fundedthrough a program sponsored by the <strong>Cape</strong> <strong>Cod</strong> National Seashore.Type Rank For “Type,” each alternative is listed as one of the following: Program,Project, Smart Solution, or Study. Ranking based on importance (#1being most important). Unranked alternatives are also supported. Nonsupportedprojects have been eliminated from the listing.Town Geographic area.Title Short listing.Description Longer descriptionCategory Some alternatives may also benefit other categories (e.g., many“Highway” alternatives also have benefits to “Safety” alternatives.“Highway” may also have congestion and mobility benefits as well).Ann. Cost estimated recurring operating cost or average funding allocation (mayvary from year to year)Start Cost One time cost (e.g., construction cost or capital purchase)Total Cost Calculation of Start Cost + Ann. Cost x 23 Years<strong>Cape</strong> <strong>Cod</strong> <strong>Regional</strong> <strong>Transportation</strong> <strong>Plan</strong> | August 2011Chapter 7: AlternativesPage 511
Printed: 6/14/2011 Projects <strong>Cape</strong> <strong>Cod</strong> <strong>Regional</strong> <strong>Transportation</strong> <strong>Plan</strong>RTP# Type Rank TOWN Title Description Category Ann.Cost/yr($K)StartCost($K)TotalCost($K)3802 Project 1 Barnstable Hyannis Access ImprovementsImprove access to downtown Hyannis per Hyannis Access Study. Construct2 additional travel lanes w/landscaped median on Yarmouth Road to connectfrom existing 4-lanes in Yarmouth to Route 28 in Hyannis. Includes multiusepath and sidewalk.Highway 50,000 50,0003305 Project 2 Bourne Rte 6 Reconfigure Interchange OneImprove westbound on-ramp near Sagamore Bridge during peak times foroff-cape traffic flow: Route 6, Exit 1: Reconfigure WB on-rampHighway 11,500 11,5003302 Project 3 <strong>Cape</strong>wide <strong>Cape</strong> <strong>Cod</strong> Rail Trail ExtensionsExtend <strong>Cape</strong> <strong>Cod</strong> Rail Trail from Bourne to Provincetown via new bike path,including direct connection to Hyannis <strong>Transportation</strong> CenterBicycle/Pedestrian74,000 74,0004085 Project 4 BourneRoute 25 Access RampWidening/Belmont Circle ModificationWiden Route 25 Ramps to 2 lanes in each direction. Modify Belmont Circleto 2-way travel. Construct pedestrian underpass at Route 25 Ramps. Per2007 "Buzzards Bay Village Comprehensive <strong>Transportation</strong> <strong>Plan</strong>."Highway 5110 5,1104011 Project 5SandwichBarnstableYarmouthRoute 6 HydroplaningRoute 6 stormwater improvements to remove runoff from traveled way,including construction of shoulders as neededSafety 10,000 10,0003306 Project 6 <strong>Cape</strong>wide Year-Round Daily Rail ServiceImplement year-round daily rail service from Hyannis to Buzzards Bay,Middleborough (connect to Boston), Providence, RI, (connect to T.F. GreenAirport and N.Y. City)Rail 1,000 3,000 26,0003319 Project 6 <strong>Cape</strong>wide <strong>Transportation</strong> Management CenterDesign & construct Operations Center to monitor traffic operations, issuereal-time reports to traveling public, control variable message signs andcoordinated traffic signalsITS/Management6,450 6,4503332 Project 8Orleans,Eastham,Wellfleet,Truro,ProvincetownRte 6 Improvements Orleans toProvincetownImplement improvements in the corridor between Orleans and Provincetownper the Rte 6 Safety and Traffic Flow StudyHighway 5,000 5,0003315 Project 9 Bourne Otis Rotary Area ImprovementsConstruct safety improvements on Route 28/Connery Avenue/Route 28A atthe Otis RotarySafety 5,000 5,0003314 Project 10 <strong>Cape</strong>wide Permanent Traffic Counting StationsInstall permanent traffic counting stations at strategic locations <strong>Cape</strong>-wide,including remote-accessible detection at signalized intersectionsITS/Management5 175 2904081 Project 10 Truro Bus Stop Livability Enhancements Livability enhancements / Improvements for bus stop area Enhancements 1,000<strong>Cape</strong> <strong>Cod</strong> Metropolitan <strong>Plan</strong>ning Organization Projects page 1 of 9
Printed: 6/14/2011 Projects <strong>Cape</strong> <strong>Cod</strong> <strong>Regional</strong> <strong>Transportation</strong> <strong>Plan</strong>RTP# Type Rank TOWN Title Description Category Ann.Cost/yr($K)StartCost($K)TotalCost($K)3300 Project 12 Bourne Scenic Highway Median Barrier<strong>Complete</strong> construction of median barrier along Route 6 Scenic Highway fromEdge Hill Road to Belmont Circle in BourneSafety 12,000 12,0003338 Project 12 Barnstable Osterville-Cotuit Bike ConnectionConstruct off-road connection south of Route 28 for bicycle-pedestrianaccess between Osterville and CotuitBicycle/Pedestrian2,000 2,0003362 Project 12 Mashpee Mashpee Rotary Ring RoadsConstruct connector roads outside of the Mashpee Rotary: from Great NeckRoad South to Route 28 East Leg; from Great Neck Road North to Route151Highway 20,000 20,0004023 Project 12 Provincetown Shank Painter Rd Corridor ImprovementsCorridor improvements including new sidewalks, curb cut consolidation,landscaping, bicycle lanes, etc.Bicycle/Pedestrian2000 2,0003312 Project 16 Bourne Sandwich Road Parkway Develop Sandwich Road into a 4 lane parkway with a landscaped median. Highway 35,000 35,0003359 Project 16 EasthamRoute 6/Gov. Prence Road IntersectionImprovementsInstall improvements at Route 6/Governor Prence Road intersection inEasthamSafety 1,000 1,0004086 Project 18 BourneMemorial Circle Reconfiguration (Routes6/28, Main Street Buzzards Bay)Convert Memorial Circle to 4-way Intersection; includes slip lane connectionfor eastbound Routes 6/28 to Main Street. Per 2007 "Buzzards Bay VillageComprehensive <strong>Transportation</strong> <strong>Plan</strong>."Highway 1802 1,8023304 Project 19 Bourne Bourne Rotary ImprovementsReconfigure Bourne rotary to allow direct connection between Bourne Bridgeto Route 28 (MacArthur Blvd). Interim improvements to improve flows atrotary entrances and exits by widening and pavement markings/signage.Highway 50,000 50,0003317 Project 19 Barnstable Independence Park BikepathConnect western extension of <strong>Cape</strong> <strong>Cod</strong> Rail Trail through IndependencePark (Barnstable) to Service Rd at Exit 6Bicycle/Pedestrian7,000 7,0003322 Project 19 BourneRte 28 MacArthur BoulevardImprovementsBourne - Construction of 2 new northbound lanes on Rte 28, reverse existingnorthbound, existing southbound becomes frontage roadHighway 20,000 20,0003325 Project 19 <strong>Cape</strong>wide Variable Message SignsRemote operated variable message signs installed along all major routes -Rte 6, Rte 28 in Bourne & Falmouth, Rte 25 Extension, Rte 3ITS/Management10 1,000 1,2303367 Project 19BarnstableBostonBarnstable-Boston Ferry Service Ferry service: Barnstable to Boston Ferry 15,000 15,0003337 Project 24 Falmouth Cross-Falmouth BikepathBike path connection from E. Falmouth to Gifford St. to Shining Sea BikePathBicycle/Pedestrian3,000 3,000<strong>Cape</strong> <strong>Cod</strong> Metropolitan <strong>Plan</strong>ning Organization Projects page 2 of 9
Printed: 6/14/2011 Projects <strong>Cape</strong> <strong>Cod</strong> <strong>Regional</strong> <strong>Transportation</strong> <strong>Plan</strong>RTP# Type Rank TOWN Title Description Category Ann.Cost/yr($K)StartCost($K)TotalCost($K)3356 Project 24 Chatham Bridge St Bridge Replacement Replace Bridge Street/Mitchell River Bridge (Chatham) Bridge 12,000 12,0003390 s Project 26 ProvincetownProvincetown Intermodal Gateway Project- ConstructionConstruct the Gateway Enhancements 8,000 8,0003389 s Project 27 Provincetown Provincetown Bicycle Path Ext Develop ped/bicycle facility using a portion of the Rte. 6 ROWBicycle/Pedestrian1,000 1,0003301 Project 28 Sandwich Interchange Improvements Rte 6 Mid-<strong>Cape</strong> Hwy - Implement improvements to Route 6 Interchanges Highway 38,200 38,2003324 Project 29YarmouthDennisHarwichChathamRte 28 Multimodal Improvements:Hyannis-DennisConstruction, marking, and signage of Bicycle facility along Route 28 fromHyannis - Dennis using existing pavement with minor widening.Connect/construct Route 28 sidewalks from Yarmouth to Chatham in Dennis& Harwich. Implement improvements per the Rte 28 Safety and Traffic FlowStudy; Includes turning lanes, signal optimization. See report:www.gocapecod.org/outreachMulti-Modal 10,000 10,0003331 Project 29 Bourne Scenic Highway/Rte 25 Connector RampDevelop a direct connection from Scenic Highway to Rte. 25 to divert trafficfrom the Belmont Circle.Highway 10,000 10,0003330 Project 31Sandwich,BourneBus-Only Lanes for Rte 3 & Rte 6Provide bus-only lanes between both Exits "2" and the Sagamore Bridge forboth Rte. 3 and Rte. 6. This is expected to be achieved by widening andstrengthening the shoulder sectionTransit 5,000 5,0004087 Project 32 BourneReconfigure Route 6/28 Bypass(Buzzards Bay)Reduce road width to 1 travel lane in each direction; provide local access tocross-streets; construct multi-use path from Memorial Circle to BelmontCircle. Per 2007 "Buzzards Bay Village Comprehensive <strong>Transportation</strong><strong>Plan</strong>."Highway 4455 4,4553303 Project 33 Barnstable Route 132 Access ManagementConstruct traffic channelization, land acquisition, combine/eliminatedriveways to improve traffic flow and safety from CC Mall to Phinneys LaneSafety 5,000 5,0003308 Project 34 Barnstable Airport Rotary Traffic ImprovementsReconfigure Airport Rotary to improve traffic flow and safety. May includerealignment of approaches and reduction of diameter to conform to modernroundabout designSafety 900 9003310 Project 35 <strong>Cape</strong>wideCanal Area Intelligent <strong>Transportation</strong>SystemExpand transportation monitoring system to improve congestion & safetywhile providing real-time information <strong>Cape</strong>wide & beyondITS/Management3,000 3,000<strong>Cape</strong> <strong>Cod</strong> Metropolitan <strong>Plan</strong>ning Organization Projects page 3 of 9
Printed: 6/14/2011 Projects <strong>Cape</strong> <strong>Cod</strong> <strong>Regional</strong> <strong>Transportation</strong> <strong>Plan</strong>RTP# Type Rank TOWN Title Description Category Ann.Cost/yr($K)StartCost($K)TotalCost($K)3316 Project 36 Orleans Rt 6A/Rt 28 Intersection ImprovementsPer recommendations of 2006 Safety Study, install traffic signal orroundabout at intersection of Route 6A/Route 28/Canal Street in OrleansHighway 1,000 1,0003318 Project 37 Barnstable Barnstable RoundaboutImprove traffic flow and safety of the Route 6A/Route132 intersectionthrough channelization of traffic movements (roundabout)Safety 1,000 1,0003006 ProjectBourne,Sandwich<strong>Cape</strong> <strong>Cod</strong> Canal Park-and-Ride Lot(s)ImprovementsConstruct new and/or expand existing Park-and-Ride facilities on both sidesof the <strong>Cape</strong> <strong>Cod</strong> Canal near highway bridgesMulti-Modal 1,150 1,1503326 Project <strong>Cape</strong>wide <strong>Cape</strong>-wide Highway Advisory Radio Provide travel information cape-wide via AM radioITS/Management250 2503336 Project Bourne Bourne Central BikepathRelocate rail line to the east of MacArthur Blvd (Bourne,) convert existingrail to bikepathBicycle/Pedestrian10,000 10,0003340 Project Barnstable Truck Staging at Route 6 InterchangeConstruct truck transfer staging area near a Route 6 (e.g., Exit 6 or Exit 7)interchange for transfer of freight from large trucks to smaller trucks fordestinations in the Hyannis Area. Consider rail freight transfer.ITS/Management3,000 3,0003342 Project <strong>Cape</strong>wide Emergency Routes & Shelters Signage Install signage indicating emergency routes and shelter locations Security 150 1503343 Project Barnstable Villager Bus (Red Line) Phinneys LaneReroute CCRTA Villager service (Red Line) to include direct service to orfrom Barnstable Village directly to Route 132 via Phinneys LaneTransit 40 9203345 Project Barnstable Villager Bus Service (Red Line) Split Add CCRTA Villager service into two separate, coordinated lines Transit 5 1153349 Project Dennis Rte 28 Main St Bridge Rehabilitation Rehabilitate Route 28 Main Street/Swan Pond River Bridge (Dennis) Bridge 6,000 6,0003350 Project BourneBourne Rotary - Falmouth /Sandwich BusServicesIntroduce public transit bus service between the Bourne Bridge area andSandwich/ Falmouth (CMAQ funding)Transit 276 6,3513352 Project Dennis Upper County Rd Bridge Rehabilitation Rehabilitate Upper County Road/Swan Pond River Bridge (Dennis) Bridge 3,000 3,0003353 Project Wellfleet3354 Project Wellfleet3355 Project Bourne3357 Project Falmouth3358 Project YarmouthMarconi Beach Road/Route 6 IntersectionSignageCemetery Road & Old Wharf Road/Route6 ImprovementsCohasset Narrows Bridge Improvements& Traffic Management. Includes multi-usepathDillingham Av/Davis StraightsSignalizationRoute 6A/Union Street IntersectionImprovementsAdd correct signage indicating "disappearing lane" at Marconi BeachRoad/Route 6 intersection in WellfleetReconstruct intersections to consolidate Cemetery & Old Wharf Rd at Route6 in WellfleetRepair bridge abutments, prepare and implement traffic management plansas part of repairs to the Cohasset Narrows Bridge in Bourne [***reviewschedule]Install traffic signal at Dillingham Avenue/Davis Straights intersection inFalmouthHighway 5 5Highway 500 500Bridge 300 300Highway 1,000 1,000Route 6A/Union Street intersection improvements in Yarmouth Highway 1,000 1,000<strong>Cape</strong> <strong>Cod</strong> Metropolitan <strong>Plan</strong>ning Organization Projects page 4 of 9
Printed: 6/14/2011 Projects <strong>Cape</strong> <strong>Cod</strong> <strong>Regional</strong> <strong>Transportation</strong> <strong>Plan</strong>RTP# Type Rank TOWN Title Description Category3361 ProjectMashpeeBarnstable Left-Turn Lanes - Route 28 Construct turning lanes on Rte 28 from Route 130 to Orchard Road inMashpee (esp. at Bowdoin Road)Ann.Cost/yr($K)StartCost($K)TotalCost($K)Highway 500 5003363 Project YarmouthWest Yarmouth Rt 28 IntersectionImprovementsConstruct intersection improvements at Route 28 & East Main Street inWest YarmouthSafety 1,000 1,0003364 Project <strong>Cape</strong>wide HOV LanesConstruct High-Occupancy Lanes at key segments of freeways such asRoute 6, 3, 25, and 28.Highway 10,000 10,0003365 Project Eastham Align Roadways: Aspinet /Nauset Align Aspinet Rd with Nauset Rd at Route 6(Eastham) Safety 1,000 1,0003366 Project Falmouth Left Turn Phase - Gifford/Jones Add left-turn phase Gifford St/Jones Rd (Falmouth) Highway 50 503368 ProjectFalmouthand Hyannisto NewBedford2 New Ferry Services Provide new ferry services: New Bedford-Woods hole, New Bedford-Hyannis Ferry 2,000 100,000 146,0003370 s Project <strong>Cape</strong>wideCoast Guard Beach Shuttle Replacement -Phase 2Replace existing vehicles - National Park Service Transit 500 5003371 s Project <strong>Cape</strong>wideOuter <strong>Cape</strong> ITS Operations ControlCenterDesign and build an initial control center to accommodate ITS deploymentfor the Outer <strong>Cape</strong>ITS/Management250 2503372 s Project <strong>Cape</strong>wide Information Kiosks Procure, install, and enable public transportation information kiosksITS/Management200 2003373 s Project <strong>Cape</strong>wide Variable Message Signs - Phase 1 Permit, and install variable message signs for the Outer <strong>Cape</strong>.ITS/Management500 5003374 s Project <strong>Cape</strong>wide Surveillance CamerasPermit, and install surveillance cameras for the Outer <strong>Cape</strong> to observe trafficconditions and monitor Nat'l Seashore parking facilities.ITS/Management50 503375 s Project <strong>Cape</strong>wide Highway Advisory Radio System Permit and install a highway advisory system for the lower/outer <strong>Cape</strong> area.ITS/Management200 2003379 s Project <strong>Cape</strong>wideUpgrade Radio System for CCRTAServiceImprove communications systems and provide capacity to accommodate ITScomponents /Narrowband Radio.ITS/Management150 1503381 s Project <strong>Cape</strong>wideParking Improvement Implementation -Phase 1Develop inland parking for the National Seashore Park & Ride 150 1503384 s Project <strong>Cape</strong>wide Variable Message Signs - Phase 2 Permit, and install variable message signs for the Outer <strong>Cape</strong>.ITS/Management500 500<strong>Cape</strong> <strong>Cod</strong> Metropolitan <strong>Plan</strong>ning Organization Projects page 5 of 9
Printed: 6/14/2011 Projects <strong>Cape</strong> <strong>Cod</strong> <strong>Regional</strong> <strong>Transportation</strong> <strong>Plan</strong>RTP# Type Rank TOWN Title Description Category3385 s Project <strong>Cape</strong>wide Beach Shuttle ExpansionAcquire additional buses to accommodate inland National Seashore parkingneeds - National Park Service.Ann.Cost/yr($K)StartCost($K)TotalCost($K)Transit 400 4003388 s Project Provincetown Provincetown Bicycle Path Ext - Phase I Develop an extension from Race Point to McMillan Pier.Bicycle/Pedestrian1,000 1,0003391 s Project <strong>Cape</strong>wide Renewable Fuels Pilot StationsDevelop pilot stations for renewable fuels such as biodiesel and ethanol.Proposal includes one station in the Mid-<strong>Cape</strong> area and one in the Outer<strong>Cape</strong> areaEnhancements 999 9994000 Project Barnstable CCRTA Bike Rental Provide bike rental service at Hyannis <strong>Transportation</strong> CenterBicycle/Pedestrian04001 ProjectEasthamOrleansEastham Rotary Bike/PedAccommodationAdd bike/ped accommodation to connect Orleans to Rock Harbor Rd & Rt 6in Eastham via periphery of rotaryBicycle/Pedestrian04003 Project Sandwich Bike Information Kiosk Construct informational kiosk by Canal bikeway near Sandwich MarinaBicycle/Pedestrian04006 Project Eastham Route 6 <strong>Complete</strong> Street4010 Project Bourne Rail Connection at "Y"4012 Project Barnstable West Main St TransitRoute 6 in Eastham: add bike accommodation, improve sidewalks, busturnouts & stops to create "<strong>Complete</strong> Street"Construct direct connection from Canal-side rail to Falmouth rail (eliminatingneed to lower Canal rail bridge)Provide transit service along West Main Street from SeaLine connection atRt 28 to downtown HyannisHighway 5,000Rail 0Transit 04013 Project Falmouth Falmouth Transit Improvements Add service/stops to Surf Drive, Maravista Ave, Brick Kiln Rd, Jones Rd. Transit 04015 Project <strong>Cape</strong>wide Mobility Management Call Center4017 Project <strong>Cape</strong>wideExpansion of Next-Gen Mobile DataTerminals to ParatransitOne-stop traveler call center to coordinate all travel modes and to manageeligibility and special requirements for human services.State-of-the-art displays, global positioning systems (GPS), automaticvehicle location (AVL) systems, in-vehicle navigation systems, digital drivermanifests and mobile data collection.Transit 0Transit 04018 Project <strong>Cape</strong>wideNext Bus Stop Announcements andAutomatic Passenger CountingAdd technology to Mobile Data Terminals (MDTs) to provide next bus stopannouncements/displays onboard. Includes automatic passenger counters.Transit 04019 Project <strong>Cape</strong>wideWeb 2.0 Integrated Intermodal TravelerInformation over the WebInternet-based intermodal trip planning, displays at malls and terminals toprovide real-time mapping of transit vehicles, estimated time of arrival (ETA).Includes real-time displays for major destinations and terminals, ETAdisplays at bus shelters, and smartphone applicationsTransit 04024 Project Brewster Rt 124/Tubman Safety Improvements Context-sensitive improvements to improve intersection safety Highway 04027 Project Barnstable Rt 6A W. Barnstable Sidewalk Construct sidewalk along Route 6A in W. BarnstableBicycle/Pedestrian0<strong>Cape</strong> <strong>Cod</strong> Metropolitan <strong>Plan</strong>ning Organization Projects page 6 of 9
Printed: 6/14/2011 Projects <strong>Cape</strong> <strong>Cod</strong> <strong>Regional</strong> <strong>Transportation</strong> <strong>Plan</strong>RTP# Type Rank TOWN Title Description Category4028 Project Barnstable4029 Project Barnstable4030 Project Bourne4032 ProjectBourneSandwichRoute 28/Bearses Way AccessImprovementsRt 28/Yarmouth Rd IntersectionImprovementsMain Street (Buzzards Bay) StreetscapingPhase 3Rt 6 ResurfacingIntersection improvements including accommodation of bike/ped & publictransportation amenitiesAnn.Cost/yr($K)StartCost($K)TotalCost($K)Highway 2500 2,500Construction of turning lanes and signal upgrades per Hyannis Access Study Highway 2000 2,000Continue streetscaping improvements along Route 6/28 Main Street inBuzzards BayResurfacing and related work on Rt 6 from Sagamore Bridge toSandwich/Barnstable TLEnhancements 0Highway 8000 8,0004033 Project Brewster Rt 6A Resurfacing Coldplaning/resurfacing of Rt 6A from Dennis T.L to Orleans T.L. in Brewster Highway 6500 6,5004034 ProjectDennisHarwichBrewsterOrleansEasthamWellfleetTruroProvincetownRoute 6 Stormwater ImprovementsRoute 6 stormwater improvements to remove runoff from traveled way,including construction of shoulders as needed from Dennis to ProvincetownSafety 04035 Project ChathamRt 28/Crowell Rd/Depot Rd/Queen AnneRd Intersection Improvements4036 Project Chatham Rt 28 Corridor improvements4037 Project Falmouth4038 Project FalmouthRt 28/Old Meetinghouse Rd IntersectionImprovementsRt 28/Jones Rd/Worcester Ct IntersectionImprovementsIntersection improvements at Rt 28/Crowell Rd/Depot Rd/Queen Anne Rd inChathamAccess management improvements along Rt 28 from George Ryder Rd toBarnhill RdHighway 0Highway 0Intersection improvements at Rt 28/Old Meetinghouse Rd in Falmouth Highway 0 0Intersection improvements at Rt 28/Jones Rd/Worcester Ct in Falmouth Highway 1500 1,5004039 Project Harwich Rt 124 (Harwich) Reconstruction Reconstruction of Rt 124 from Headwaters Dr to Brewster T.L. in Harwich Highway 4000 4,0004040 Project Harwich Rt 39 (Harwich) Reconstruction Reconstruction of Rt 39 from Oak St to Brewster T.L. in Harwich Highway 04041 Project Orleans Rt 6A/Main St Intersection Improvements Intersection improvements at Rt 6A/Main St in Orleans Highway 04042 Project Orleans Rt 28/Main St Intersection Improvements Intersection improvements at Rt 28/Main St in Orleans Highway 04044 Project Sandwich Rt 6A over Scorton River Bridge Replace bridge: Rt 6A over Scorton River in Sandwich Bridge 3000 3,0004045 Project Yarmouth4046 ProjectBarnstableBourneOld Townhouse Rd/Forest Rd IntersectionImprovementsUpper/Mid <strong>Cape</strong> Real Time TrafficInformation SystemIntersection improvements at Old Townhouse Rd/Forest Rd in Yarmouth Highway 0Real Time Traffic Information System -- Design Build of year-round 24/7Web based traffic information system based on cameras, sensors, with 511to reduce road rage, congestion, and improve mobility and incidentmanagement through improved informationITS/Management3000 3,000<strong>Cape</strong> <strong>Cod</strong> Metropolitan <strong>Plan</strong>ning Organization Projects page 7 of 9
Printed: 6/14/2011 Projects <strong>Cape</strong> <strong>Cod</strong> <strong>Regional</strong> <strong>Transportation</strong> <strong>Plan</strong>RTP# Type Rank TOWN Title Description Category4047 ProjectBarnstableYarmouthHyannis Access Bicycle/PedestrianImprovements<strong>Regional</strong> bicycle/pedestrian access in the Route 28/Yarmouth Road andWillow Street area between Hyannis <strong>Transportation</strong> Center and plannedextension of the existing <strong>Cape</strong> <strong>Cod</strong> Rail Trail in Dennis-Yarmouth; Designbuild grade crossings of Willow Street and RailroadBicycle/PedestrianAnn.Cost/yr($K)StartCost($K)TotalCost($K)13000 13,0004048 Project Brewster Rt 124(Brewster) Reconstruction Full depth reclamation Harwich Road / Rte 124 Highway 1500 1,5004049 Project Brewster Rt 137(Brewster) Reconstruction Full depth reclamation Long Pond Road / Rte 137 Highway 1900 1,9004050 Project BrewsterStony Brook Rd, Rt 6A, Satucket Rd(Brewster) ReconstructionFull depth reclamation Stony Brook Road, Rte 6A - Satucket Rd Highway 600 6004051 Project <strong>Cape</strong>wide Rail Upgrade (Bourne +) Buzzards Bay to Middleborough capital improvements for rail upgrade Rail 6000 6,0004052 Project <strong>Cape</strong>wideIntercity Seasonal ConnectordemonstrationIntercity Seasonal Rail Connector-demonstration Transit 4000 4,0004053 Project Dennis Rt 134/Airline Rd Roundabout Route 134 at Airline Road, Intersection Improvements (roundabout) Highway 600 6004054 Project Dennis Old Wharf Rd (Dennis) reconstruction Old Wharf Road, reconstruction, sidewalks, and drainage improvements Highway 450 4504056 ProjectDennisHarwichBrewsterOrleansRt 6 Reconstruction Route 6 National Highway System NHS, section with failing pavement Highway 15000 15,0004060 Project Orleans Rock Harbor Rd (Orleans) Reconstruction Rock Harbor Road drainage improvements and roadway reconstruction Highway 600 6004061 Project Orleans Main Street (Orleans) Improvements4062 Project Provincetown4063 Project SandwichCommercial St (Provincetown)ReconstructionRt 130 Exit 2 Rt 6 IntersectionImprovements phase 2Main Street Sidewalk extension and reconstruction of Meeting House RoadintersectionBicycle/Pedestrian300 300Commercial Street Reconstruction Highway 3500 3,500Route 130 Exit 2 Phase 2, WB exit ramp and Service Road intersectionimprovements4064 Project Sandwich Quaker Meetinghouse Rd Sidewalk Quaker Meetinghouse Road Pedestrian Accessibility 3 miles of sidewalkSafety 3000 3,000Bicycle/Pedestrian800 8004065 Project Sandwich Quaker Meetinghouse Rd Resurfacing Sandwich, Quaker Meetinghouse Road - 2 miles long, mill and pave Highway 925 9254066 Project <strong>Cape</strong>wide MV Eagle Refurbishment4067 Project <strong>Cape</strong>wide Ferry Sewage Pump-out Systems4068 Project <strong>Cape</strong>wide Passenger Loading RampsWoods Hole, Martha's Vineyard, and Nantucket Steamship Authority (SSA)MV Eagle Mid-Life RefurbishmentVessel Sewage Pump-out Systems -- Installation of 3 land-side pump-outsystems and vessel modifications in Woods Hole, Vineyard Haven, andNantucketPassenger loading ramp modifications in Woods Hole, Vineyard Haven, OakBluffs, and NantucketFerry 5900 5,900Ferry 2700 2,700Ferry 1600 1,6004069 Project Wellfleet Chequessett Bridge Chequessett Bridge Rehabilitation Bridge 12000 12,0004074 Project Yarmouth South Shore Dr (Yarmouth) Sidewalks4075 Project Yarmouth Winslow Gray Rd (Yarmouth) SidewalksYarmouth, Sidewalk improvements: South Shore Drive sidewalk- from SeaView Ave. to South Middle BeachYarmouth, Sidewalk improvements: Winslow Gray Rd. sidewalk 0.75 mileslong from Buck Island Rd. to Long Pond Dr.Bicycle/PedestrianBicycle/Pedestrian650 650400 400<strong>Cape</strong> <strong>Cod</strong> Metropolitan <strong>Plan</strong>ning Organization Projects page 8 of 9
Printed: 6/14/2011 Projects <strong>Cape</strong> <strong>Cod</strong> <strong>Regional</strong> <strong>Transportation</strong> <strong>Plan</strong>RTP# Type Rank TOWN Title Description Category4078 Project EasthamGovernor Prence Road reconstructionand improvementsReconstruction to improve sub-surface, pavement, and multimodalaccommodation4079 Project Dennis Rt 6A (Dennis) Sidewalks Route 6A sidewalks Yarmouth TL to Sesuit Neck Road4080 Project Dennis Rt 134 (Dennis) Bike/Ped Accommodation4082 Project Harwich Bike Path ConnectorRoute 134 state section sidewalks / pedestrian bicycle accommodation,existing gapBike Path Connection from Old Colony Rail Trail to Rt 28 & Beaches(Harwich)4083 Project Sandwich Canal Connector Bike Path Bike Path Connection from <strong>Cape</strong> <strong>Cod</strong> Canal to Sandwich CenterAnn.Cost/yr($K)StartCost($K)TotalCost($K)Safety 0Bicycle/PedestrianBicycle/PedestrianBicycle/PedestrianBicycle/Pedestrian2,000 2,000300 300500 500500 500<strong>Cape</strong> <strong>Cod</strong> Metropolitan <strong>Plan</strong>ning Organization Projects page 9 of 9
7.6.3 SMART SOLUTIONS CONSIDERED“Smart Solutions” are alternatives that do not require major investments in capital oroperations. These are called “Smart” Solutions because they do require thoughtfulpromotion and coordination of transportation services that for the most part alreadyexist. The following table presents a priority listing of Smart Solutions. Priorities weredeveloped through public input and consultation with <strong>Cape</strong> <strong>Cod</strong> Commission, <strong>Cape</strong> <strong>Cod</strong>Joint <strong>Transportation</strong> Committee members, and refinements requested by the <strong>Cape</strong> <strong>Cod</strong>Metropolitan <strong>Plan</strong>ning Organization. Some of the following headings are used in thetable:RTP# Index number used for reference. Numbers followed by an “S” are fundedthrough a program sponsored by the <strong>Cape</strong> <strong>Cod</strong> National Seashore.Type Rank For “Type,” each alternative is listed as one of the following: Program,Project, Smart Solution, or Study. Ranking based on importance (#1being most important). Unranked alternatives are also supported. Nonsupportedprojects have been eliminated from the listing.Town Geographic area.Title Short listing.Description Longer descriptionCategory Some alternatives may also benefit other categories (e.g., many“Highway” alternatives also have benefits to “Safety” alternatives.“Highway” may also have congestion and mobility benefits as well).Ann. Cost estimated recurring operating cost or average funding allocation (mayvary from year to year)Start Cost One time cost (e.g., construction cost or capital purchase)Total Cost Calculation of Start Cost + Ann. Cost x 23 YearsNote that for Smart Solutions, costs have not been estimated for the draft RTP.<strong>Cape</strong> <strong>Cod</strong> <strong>Regional</strong> <strong>Transportation</strong> <strong>Plan</strong> | August 2011Chapter 7: AlternativesPage 521
Printed: 6/13/2011 Smart Solutions <strong>Cape</strong> <strong>Cod</strong> <strong>Regional</strong> <strong>Transportation</strong> <strong>Plan</strong>RTP# Type Rank TOWN Title Description Category Ann.Cost/yr($K)StartCost($K)TotalCost($K)3718SmartSolution 1 <strong>Cape</strong>wide Zoning/<strong>Plan</strong>ning Support for Sidewalks Improve zoning regulations & planning efforts to invest in sidewalks Bicycle/Pedestrian03706371140143708Encourage installation of equipment at signalized intersections and otherSmartSolution 2 <strong>Cape</strong>wide Remote Continuous Traffic Counting locations to conduct traffic counts throughout <strong>Cape</strong> <strong>Cod</strong> throughout the yearusing remotely-accessible detection equipmentSmartSolutionCoordinate schedules among the CCRTA SeaLine (Blue Line) and3 <strong>Cape</strong>wide CCRTA/Steamship Authority CoordinationSteamship Authority FerriesITS/ManagementTransit 0SmartSolution 4 BourneCCRTA-GATRA Coordination Coordinate schedules and service between GATRA and CCRTA Transit 0WarehamSmartBicycling & Motorist Traffic Law5 <strong>Cape</strong>wide Enforce traffic laws on bicyclists and motorists Safety 0Solution Enforcement04009SmartSolution 6 Boston Logan Intercity Bus Information Provide real-time bus location information, schedules, fares etc. for servicefrom Logan to <strong>Cape</strong> <strong>Cod</strong>ITS/Management03705SmartSolution 7 <strong>Cape</strong>wide Redesignate 195 & 495 Redesignate Route 25 Extension as Route 195 or Route 495 or Route195/495ITS/Management03704SmartSolution 8 <strong>Cape</strong>wide Employer TDM <strong>Plan</strong>s Create incentives for employers to prepare and implement Travel DemandManagement (TDM) plans (>25 Employees)ITS/Management0400537003715SmartSolution 9 Falmouth New Bedford-Martha's Vineyard Freight To reduce traffic on Woods Hole Rd, operate barges between New Bedfordand Martha's Vineyard to carry fuel trucks and garbage trucks.SmartSolution 10 <strong>Cape</strong>wide Speed Management Implement education, signage and enforcement to lower traffic speeds onSmartSolutionTransit Education & Marketing on Local11 <strong>Cape</strong>wideTVroadways with speed-related safety problemsImplement education programs and marketing activities on communityaccesstelevision to support public transitFerry 0Safety 0Transit 03702SmartSolution 12 <strong>Cape</strong>wide Right-of-Way Preservation Maintain rights-of-way for future transportation uses and to avoid futuretraffic generationITS/Management03713SmartSolutionBus Users Incentives: Shopping13 <strong>Cape</strong>wideDiscountsProvide shopping discounts to bus users Transit 03717SmartSolution 13 <strong>Cape</strong>wide Wi-Fi Hotspots Install wireless internet services at strategic locations throughout <strong>Cape</strong> <strong>Cod</strong> ITS/Management03701SmartSolutionNew Bedford Promote Ferry Service from New Bedford Ferry 0<strong>Cape</strong> <strong>Cod</strong> Metropolitan <strong>Plan</strong>ning Organization Smart Solutions page 1 of 2
Printed: 6/13/2011 Smart Solutions <strong>Cape</strong> <strong>Cod</strong> <strong>Regional</strong> <strong>Transportation</strong> <strong>Plan</strong>RTP# Type Rank TOWN Title Description Category Ann.Cost/yr($K)StartCost($K)TotalCost($K)3703SmartSolution<strong>Cape</strong>wide Vanpooling & Carpooling Incentives Provide incentives to increase vanpooling and carpoolingITS/Management03707SmartSolution<strong>Cape</strong>wide Carpooling "Stands/Stops"Install signage and implement education & marketing program for the use ofcarpooling stands/stops" to promote higher occupancy vehicle useITS/Management037093716SmartSolutionSmartSolution<strong>Cape</strong>wide Rail Line Buffer ZoneImplement zoning protections to reduce future development for a distance of100' along rail linesRail 0<strong>Cape</strong>wide Vanpooling at Steamship Authority Lots Permit use of Steamship Authority parking facilities for vanpooling Multi-Modal 0<strong>Cape</strong> <strong>Cod</strong> Metropolitan <strong>Plan</strong>ning Organization Smart Solutions page 2 of 2
7.6.4 TRANSPORTATION STUDIES CONSIDERED<strong>Transportation</strong> Studies are alternatives that have not been fully realized. From thepublic participation process, there have been many occasions on which a clear course ofaction is not revealed. In these cases, there may be many conflicting (and potentiallyinfeasible) “solutions” proposed. Perhaps the only consensus is that there is in fact aproblem worthy of further review. Therefore, this final category forms the basis forfuture planning efforts. These <strong>Transportation</strong> Studies provide the vehicle for generatingPrograms, Projects, and Smart Solutions.The following table presents a priority listing of <strong>Transportation</strong> Studies. Priorities weredeveloped through public input and consultation with <strong>Cape</strong> <strong>Cod</strong> Commission, <strong>Cape</strong> <strong>Cod</strong>Joint <strong>Transportation</strong> Committee members, and refinements requested by the <strong>Cape</strong> <strong>Cod</strong>Metropolitan <strong>Plan</strong>ning Organization. Some of the following headings are used in thetable:RTP# Index number used for reference. Numbers followed by an “S” are fundedthrough a program sponsored by the <strong>Cape</strong> <strong>Cod</strong> National Seashore.Type Rank For “Type,” each alternative is listed as one of the following: Program,Project, Smart Solution, or Study. Ranking based on importance (#1being most important). Unranked alternatives are also supported. Nonsupportedprojects have been eliminated from the listing.Town Geographic area.Title Short listing.Description Longer descriptionCategory Some alternatives may also benefit other categories (e.g., many“Highway” alternatives also have benefits to “Safety” alternatives.“Highway” may also have congestion and mobility benefits as well).Ann. Cost estimated recurring operating cost or average funding allocation (mayvary from year to year)Start Cost One time cost (e.g., construction cost or capital purchase)Total Cost Calculation of Start Cost + Ann. Cost x 23 YearsNote that costs for Studies are generally considered as one-time expenditures despitesome studies which may be performed over two or more years.Chapter 7: Alternatives <strong>Cape</strong> <strong>Cod</strong> <strong>Regional</strong> <strong>Transportation</strong> <strong>Plan</strong> | August 2011Page 524
Printed: 6/13/2011 Studies <strong>Cape</strong> <strong>Cod</strong> <strong>Regional</strong> <strong>Transportation</strong> <strong>Plan</strong>RTP# Type Rank TOWN Title Description Category Ann.Cost/yr($K)StartCost($K)TotalCost($K)3807 Study 1Bourne,Army Corps<strong>Cape</strong> <strong>Cod</strong> Canal BridgesReplacement/Expansion/Addition.Includes evaluation of Belmont Circle andBuzzards Bay Bypass and other roads.Evaluation of future needs for highway crossings of <strong>Cape</strong> <strong>Cod</strong> Canal.Includes consideration of replacement or expansion of existing bridges;additional crossingsHighway 1,000 1,0003803 Study 2Falmouth,Mashpee,Barnstable,Yarmouth,Dennis,Harwich,ChathamSouthside Bike RouteIdentify network (on- and off-road) for bike route from Woods Hole toChathamBicycle/Pedestrian500 5003809 Study 3 <strong>Cape</strong>wide Freight Study Conduct a study of freight (quantities, origins, destinations, etc.)ITS/Management250 2503804 Study 4 Barnstable Exit 6 Park-and-Ride Lot ExpansionExamine options at Exit 6 Park-and-Ride Lot such as parking structure orsurface lot expansion to expand parking supplyPark & Ride 250 2503811 Study 5 <strong>Cape</strong>wide Disaster/Emergencies/Security <strong>Plan</strong> Develop plans to address disasters, emergencies, and security issues Security 500 5003816 Study 6Barnstable,Mashpee,Falmouth3832 s Study 7 <strong>Cape</strong>wide3829 s Study 8 <strong>Cape</strong>wide4026 Study 94007 Study 10SandwichMashpeeEasthamOrleansHyannis-Falmouth <strong>Transportation</strong> StudyRenewable Fuels Partnership StrategicImplementation <strong>Plan</strong>Develop Origin/Destination Transit ModeSplit ModelRt 130 Road DietEastham Rotary Bypass3805 Study 12 Bourne Sagamore Bridge Speed ManagementIdentify needed roadway, public transit, and other modes' neededimprovements for future travel demands between Hyannis and FalmouthIdentify potential renewable fuel options, technologies, markets, andinfrastructure needs to make use of biofuels both viable and sustainableHighway 500 500Enhancements 200 200Create a transit model for <strong>Cape</strong> <strong>Cod</strong> Transit 250 250Narrow travel lane width to reduce speeds and accommodate bicycles/pedestriansRelocate Rock Harbor Road access from Rotary to new Bridge Rd/Rt 6signalized intersection. Convert rotary to roundaboutIdentify measures to encourage safe speeds on Route 3 and Route 6approaches to the Sagamore BridgeSafety 0Highway 0Safety 350 3504025 Study 12 Wellfleet Rt 6 at Wellfleet/Eastham TL Congestion mitigation where two NB lanes merge to one Highway 04077 Study 14 <strong>Cape</strong>wideMashpee Wampanoag Roadway &Transit StudyIdentify roadway& transit improvements to improve accessibility & mobility toand within tribal lands in MashpeeMulti-Modal 03822 s Study 15 <strong>Cape</strong>wide Smart Card StudyInvestigate current technologies, compatibilities with local planning, definepotential partners, and make recommendations.ITS/Management75 754004 Study 15BourneFalmouthFalmouth-Wareham Bike ConnectionConnect Falmouth bike paths to Bourne/Wareham town line at WilliamDalton Bridge including connection to <strong>Cod</strong> Canal bike pathsBicycle/Pedestrian0<strong>Cape</strong> <strong>Cod</strong> Metropolitan <strong>Plan</strong>ning Organization Studies page 1 of 2
Printed: 6/13/2011 Studies <strong>Cape</strong> <strong>Cod</strong> <strong>Regional</strong> <strong>Transportation</strong> <strong>Plan</strong>RTP# Type Rank TOWN Title Description Category4084 Study 16 Barnstable Rt 28 Corridor Study3806 Study Orleans Rt 28/Rt 39 Intersection ImprovementsIdentify multimodal corridor improvements from Mashpee T.L. to YarmouthT.L. along Route 28Identify safety improvements at Route 28/Route 39/Quanset Roadintersection in OrleansAnn.Cost/yr($K)StartCost($K)TotalCost($K)Multi-Modal 750 750Safety 100 1003808 s Study <strong>Cape</strong>wide Flex Phase II Evaluation Study Evaluate improvements and expansion of the Flex transit service. Transit 30 303813 Study <strong>Cape</strong>wideRailways for Transporting EmergencySuppliesDevelop contingency plan to use railways for transporting supplies duringemergenciesSecurity 75 753819 s Study <strong>Cape</strong>wideEvaluation of Existing Transit InfoSoftware/ProcurementEvaluate customer information software to be used for a web-based systemto support CCRTA operationsITS/Management250 2503820 s Study <strong>Cape</strong>wideEvaluation and refinement of PartnerProgramDevelop recommendations based on the public/private transportationprovider coordination efforts.ITS/Management100 1003826 s Study <strong>Cape</strong>wideITS Evaluation and Phase IIRecommendation studyEvaluate ITS deployment and make recommendations.ITS/Management150 1503827 s Study <strong>Cape</strong>wideEvaluation of Customer InformationSystemsEvaluate Customer Information Systems and make recommendations.ITS/Management25 253828 s Study <strong>Cape</strong>wideUpdate 5-Year and Long Range <strong>Cape</strong><strong>Cod</strong> Public <strong>Transportation</strong> <strong>Plan</strong>sUpdate the 2002 5-Year <strong>Plan</strong> and the 2003 Long Range Public<strong>Transportation</strong> <strong>Plan</strong>.ITS/Management175 1753830 s Study <strong>Cape</strong>wide Evaluation of Partner Program II Continue the evaluation of the public/private carrier coordination program.ITS/Management15 15<strong>Cape</strong> <strong>Cod</strong> Metropolitan <strong>Plan</strong>ning Organization Studies page 2 of 2
7.7 CONCLUSIONMore than 200 <strong>Transportation</strong> Programs, Projects, Smart Solutions, and Studies wereidentified through a comprehensive public participation process. Many of thesealternatives where refined, combined, and eliminated in the process of developing anMPO-supported priority ranking. Final MPO recommendations are based on fiscalconstraint.Funding issues are critical to the implementation of any of the above transportationalternatives. The following chapter includes a financial plan and listing of recommendedalternatives constrained within estimated available funds.<strong>Cape</strong> <strong>Cod</strong> <strong>Regional</strong> <strong>Transportation</strong> <strong>Plan</strong> | August 2011Chapter 7: AlternativesPage 527
Chapter 7: Alternatives <strong>Cape</strong> <strong>Cod</strong> <strong>Regional</strong> <strong>Transportation</strong> <strong>Plan</strong> | August 2011Page 528
<strong>2012</strong> REGIONAL TRANSPORTATION PLANChapter 8: Recommendations andFinancial <strong>Plan</strong>EndorsedAugust 22, 2011Revised May 20,2013
Chapter 8: Table of Contents8. Recommendations and Financial <strong>Plan</strong> ..................................................................... 5338.1 Introduction ...................................................................................................... 5338.2 Background / Source of the Financial Resources ............................................ 5338.3 Federal <strong>Transportation</strong> Funds: Categories and Eligible Activities .................. 5358.4 Summary of Previous Expenditures ................................................................. 5388.4.1 Federal Highway Administration Previous Expenditures ....................... 5398.4.2 Federal Lands Highway Program Administration ................................... 5398.4.3 Federal Transit Administration Previous Expenditures .......................... 5398.5 Estimated Available Funds ...............................................................................5408.5.1 Federal Highway Administration Source Funds ......................................5408.5.2 Federal Transit Administration Source Funds ........................................ 5418.6 Recommendations within available resources ................................................. 5438.7 Conclusion ......................................................................................................... 547Chapter 8: List of TablesTable 1 – FFY <strong>2012</strong>-2035 Estimated <strong>Regional</strong> <strong>Transportation</strong> <strong>Plan</strong> Highwayfunding........................................................................................................... 541Table 2 – Estimated <strong>Regional</strong> <strong>Transportation</strong> <strong>Plan</strong> Transit Funding ................ 542Table 3 – Allocation of Available Highway Funding ........................................... 544Table 4 – Estimated <strong>Regional</strong> Discretionary Expenditures ................................ 545Table 5 – Projects Funded by the Accelerated Bridge Program/GANS ............. 546<strong>Cape</strong> <strong>Cod</strong> <strong>Regional</strong> <strong>Transportation</strong> <strong>Plan</strong> | August 2011Chapter 8: Recommendations & Financial <strong>Plan</strong>
Chapter 8: Recommendations & Financial <strong>Plan</strong> <strong>Cape</strong> <strong>Cod</strong> <strong>Regional</strong> <strong>Transportation</strong> <strong>Plan</strong> | August 2011
8. Recommendations and Financial <strong>Plan</strong>8.1 INTRODUCTIONThe <strong>Regional</strong> <strong>Transportation</strong> <strong>Plan</strong> (RTP) contains data collection and analysis,discussion about and outreach for the existing <strong>Cape</strong> <strong>Cod</strong> transportation system, relatedissues, and potential solutions. The overarching objective of the RTP is for improvedmobility of both residents and visitors to, from, and within the <strong>Cape</strong> <strong>Cod</strong> region, andconnections beyond the region. While smaller improvements are not specificallyidentified, the RTP goals assist is directing design and implementation.Many sources and outreach efforts over the last several years, along with ongoing datacollection, analysis, and communications have resulted in a list of recommendations forimprovement to <strong>Cape</strong> <strong>Cod</strong>’s regional transportation system.However, planning for improvements is meaningless without considering how potentialsolutions can be financed. The implementation of the proposed projects and programsrecommended from this RTP effort—whether large or small, transit, or roadwayrelated—will need financing to proceed.Under Title 23, federal transportation law, currently an extension of the Safe,Accountable, Flexible, Efficient <strong>Transportation</strong> Equity Act: A Legacy for Users(SAFETEA-LU), a regional transportation plan may only recommend implementation ofprograms and projects where funding "can reasonably be expected to be available" per23 CFR 450.322(b)(11). In other words, just as in a local budget, the plan is notapproved unless the fiscal analysis shows that there is expected to be enough funding toimplement the recommendations. Other proposed projects, programs, and/or studiesmay be included for informational purposes only.Therefore, this chapter presents the RTP recommendations within the financialresources expected to be available for the region.8.2 BACKGROUND / SOURCE OF THE FINANCIAL RESOURCESThe primary source of funding for implementation of the RTP projects and programs isfrom the federal Highway Trust Fund (HTF). Distribution of Highway Trust Fundrevenues are appropriated by Congress for surface transportation purposes through theUnited States Department of <strong>Transportation</strong> (USDOT) Federal Highway Administration(FHWA) and the USDOT Federal Transit Administration (FTA) from federal legislation,with the most recent six-year act entitled the Safe, Accountable, Flexible, Efficient<strong>Transportation</strong> Equity Act: A Legacy for Users (SAFETEA-LU). SAFETEA-LU was<strong>Cape</strong> <strong>Cod</strong> <strong>Regional</strong> <strong>Transportation</strong> <strong>Plan</strong> | August 2011Chapter 8: Recommendations & Financial <strong>Plan</strong>Page 533
signed into law on August 10, 2005, by President George Bush, and has now expired.Continuing resolutions and extensions of SAFETEA-LU have provided funds that willcontinue through the end September 2011. Efforts are underway in Congress on a draftnew bill.The federal legislation provides authorization; it sets policy, programs, and amounts. Ittypically authorizes specific dollar amounts for each program. Each year Congressprovides an annual appropriation which funds the programs authorized, however, theCongressional amount that is appropriated, or budgeted, is generally less than theamount authorized.Obligation of the federal dollars occurs for Federal Highway and state funded projects aseach project is advertised for construction. For a transit project, the obligation of thefederal dollars is as the funds are approved through the online <strong>Transportation</strong> ElectronicAward and Management (TEAM) system.The federal Highway Trust Fund (HTF) receipts are collected primarily based on usertaxes on fuel. Examples of the current tax per gallon by fuel type are as follows:FEDERAL HIGHWAY TRUST FUND TAX AMOUNTSFUEL TYPE CENTS PER UNIT UNITGasoline 18.4 gallonGasahol 18.4 gallonDiesel fuel 24.4 gallonLiquefied petroleum gas 18.3 gallonLiquefied natural gas 24.3 gallonCompressed natural gas 48.54 1,000 cubic ftSTATE GAS TAX AMOUNTGasoline .............. 21.0 cents/gallonFor this RTP financial plan, the federal funding provided by SAFETEA-LU extensionsthrough, and in cooperation with, the Commonwealth of Massachusetts is what formsthe basis for the estimated available funds for the federal aid eligible components of thetransportation system. State funds provide a matching project implementation amount.For a highway construction project the state amount is typically 20% of the constructioncost, and the federal highway amount is 80%. Exceptions include the Highway SafetyImprovement Program (HSIP) funds, which are 90% federal and 10% state funds. For atransit project the state amount may average at a higher percentage due to the statefunding a large percent of operating cost.Local funds play a large part in the process through project design. Most of the projectdesigns on <strong>Cape</strong> <strong>Cod</strong> are funded by the local town where the project is located. This maybe the practice even for certain state facilities, because local towns are interested inmoving a project forward. Transit services also have a local share in funding, with aChapter 8: Recommendations & Financial <strong>Plan</strong> <strong>Cape</strong> <strong>Cod</strong> <strong>Regional</strong> <strong>Transportation</strong> <strong>Plan</strong> | August 2011Page 534
portion of service operating costs assessed to the towns through the <strong>Cape</strong> <strong>Cod</strong> <strong>Regional</strong>Transit Authority.8.3 FEDERAL TRANSPORTATION FUNDS: CATEGORIES ANDELIGIBLE ACTIVITIESThe <strong>Regional</strong> <strong>Transportation</strong> <strong>Plan</strong> process considers all transportation modes. However,the financial estimates are only for the Federal Highway Administration (FHWA) andFederal Transit Administration (FTA) eligible facilities. At this time, there is a separatefederal source for airport related projects, through the Federal Aviation Administration(FAA). The following table provides examples of the FHWA and FTA federal fundingcategories and general uses.Federal Highway Administration ProgramsFund and Primary PurposeEligible ActivitiesMetropolitan <strong>Plan</strong>ning (PL)Multimodal transportation planning. PrimaryTo carry out the metropolitan transportation planning documents required are the UPWP, RTP, and theprocessTIP.Statewide <strong>Plan</strong>ning and Research (SPR)Highway and transit planningStatewide transportation planningNational Highway System (NHS)NHS is the system of significant rural and urbanroads serving major population centers, internationalborder crossings, intermodal transportation facilities,and major travel destinations. NHS funds are forImprovements to rural and urban roads that are partof the NHS or that are NHS Intermodal connectorsMetropolitan transportation planning and Statewidetransportation planning process and publictransportation management systems; 25% of SPRto be used for Research, Development, andTrainingNHS corridor improvements that are highway,transit, or system demand management (such ascarpool programs). Includes funding forenvironmental restoration and pollution abatementto minimize the impact of transportation projects.NHS related transportation planning.Surface <strong>Transportation</strong> Program (STP)Construction, reconstruction, rehabilitation, andoperational improvements for highways, bridges, andother modes10% set aside for <strong>Transportation</strong> Enhancements<strong>Transportation</strong> EnhancementsTo provide for linked but non-typical highway relateditems—12 specific activities are included in thefederal definitionHighway Bridge Replacement / RehabilitationReplace and rehabilitate deficient highway bridgesand to seismically retrofit bridges located on anypublic road.Construction of Ferry Boats & Ferry TerminalFacilities—Ferry Boat DiscretionaryFerry projectsCapital costs of construction for highway,bicycle/pedestrian accommodation, and/or transitprojects (with transfer to FTA for transit)Surface transportation planning programsExamples of the 12 specific activities includelandscaping, bicycle/pedestrian components,stormwater mitigation projects.Funds provided for Off-System bridges may not betransferred to other 23 U.S.C. programs without aneeds determination.Construction of ferry boats and ferry terminalfacilities. Priority ferry systems that provide criticalaccess to areas that are not well-served by othermodes of surface transportation; carry the greatestnumber of passengers and vehicles; or carry themost passengers in passenger only service.<strong>Cape</strong> <strong>Cod</strong> <strong>Regional</strong> <strong>Transportation</strong> <strong>Plan</strong> | August 2011Chapter 8: Recommendations & Financial <strong>Plan</strong>Page 535
Federal Highway Administration Programs (continued)Fund and Primary PurposeEligible ActivitiesHighway Safety Improvement Program (HSIP)Safety projectsFunds projects that are designed to produce areduction in traffic fatalities and serious injuries onpublic roads. Rail-highway crossing improvementsCongestion Mitigation and Air QualityImprovement Program (CMAQ)Air quality benefitsRecreational Trails Program (RTP)TrailsFederal Lands Highways Program (FLHP)Coordinated program of public roads and transitfacilities serving Federal and Indian lands. Funding isbroken into 4 discrete sources: IndianReservation Roads (IRR); Public Lands Highway -Discretionary & Forest Highways; Parkways & ParkRoads; Refuge RoadsProjects in nonattainment and maintenance areasthat reduce transportation related emissions. Anytransit capital projects and operating expenses fornew services. Operating assistance is limited tonew or expanded transportation services, andlimited to three (3) years.Develop and maintain recreational trails and trailrelatedfacilities for both non-motorized andmotorized recreational trail uses.May be used for facilities within, adjacent, orproviding access to public lands, national parks,national forests, refuge roads, and Indianreservations. SAFETEA-LU added Alternative<strong>Transportation</strong> in Parks and Public Lands (ATPPL).May be administered by FHWA or may betransferred to FTA for transit projects eligible forFLH funds under 23 U.S.C. 204(h).<strong>Transportation</strong>, Community, and SystemPreservation Program (TCSP)Provides funding for a comprehensive program tofacilitate the planning, development, andimplementation of strategies to integratetransportation, community, and system preservationplans or practices.Safe Routes To SchoolsProvides funding to encourage and make saferwalking and bicycling routes to schools.Improve the efficiency of the transportation systemReduce the impacts of transportation on theenvironment. Reduce the need for costly futureinvestments in public infrastructureProvide efficient access to jobs and servicesExamine community development patterns andidentify strategies to encourage private sectordevelopmentFunds are for planning, design, and construction ofprojects that will substantially improve the ability ofstudents to walk and bicycle to school.Chapter 8: Recommendations & Financial <strong>Plan</strong> <strong>Cape</strong> <strong>Cod</strong> <strong>Regional</strong> <strong>Transportation</strong> <strong>Plan</strong> | August 2011Page 536
Federal Transit Administration ProgramsFund and Primary PurposeEligible ActivitiesMetropolitan <strong>Plan</strong>ning Program Section 5303To carry out the metropolitan transportation planningprocess under 49 U.S.C. 5303Metropolitan transportation planning process (23U.S.C. 134)Urbanized Area Formula Grants Section 5307Transit capital and planning assistance to urbanizedareasSection 5309Earmark or discretionary funds for bus/railSpecial Needs of Elderly Individuals andIndividuals With Disabilities Program (49U.S.C. 5310) Section 5310Intended primarily for private non-profitorganizations, public bodies approved by the State tocoordinate services for the elderly and individualswith disabilitiesNon Urbanized Area Formula Program Section5311 Eligible subrecipients include State and localpublic agencies, Indian Tribes, private non-profitorganizations, and private operators of publictransportation services.Transit in the Parks ProgramSection 5320?A new program in SAFETEA-LU for alternativetransportation serving Federal and Indian lands.Capital and planning projects are selected fromapplications based on criteria as in the solicitationnotice.Eligible subrecipients include the National ParkService and Tribal Governments. Local governmentsacting with the consent of a Federal landmanagement agency are also eligible to apply.Job Access and Reverse Commute Program (49U.S.C. 5316)The Job Access and Reverse Commute (JARC)programThe federal requirement is that projects selected forfunding be included in a locally developedcoordinated public transit/human servicetransportation plan for Sections 5310, 5316 (JARC)and 5317 (New Freedom).In a <strong>Transportation</strong> Management Area, the MPOmay elect to transfer portions of its FTA Section5307 funds that cannot be used for operatingassistance to FHWA for highway projects subject tothe requirements of 49 U.S.C. 5307(b)(2).Priority for capital bus needs unmet by formulafunds, fleet expansion, clean fuels. Eligible NewStarts construction program funds for new orextensions to light rail, rapid rail (heavy rail),commuter rail, monorail, busway, and automatedfixed guideway system (such as a ‘‘people mover’’).Capital funding to assist in providing transit servicesfor the elderly and/or disabled populationThe Mobility Assistance Program (MAP)administered by the state provides assistance withcapital needs for services related to elderly and/ordisabled individuals.For the purpose of supporting public transportationin areas with a population of less than 50,000. Maybe used for capital, operating, state and/or projectadministration.Projects must conserve natural, historical, andcultural resources, reduce congestion and pollution,and improve visitor mobility and accessibility. Nomore than 25 percent may be allocated for any oneproject.May be used for transit facilities within, adjacent, orproviding access to public lands, national parks,national forests, refuge roads, and Indianreservations..The Job Access and Reverse Commute (JARC)program provides formula funding to States andDesignated Recipients to support the developmentand maintenance of job access projects designed totransport welfare recipients and eligible low-incomeindividuals to and from jobs and activities related totheir employment, and for reverse commuteprojects designed to transport residents of UZAsand other than urbanized to suburban employmentopportunities.<strong>Cape</strong> <strong>Cod</strong> <strong>Regional</strong> <strong>Transportation</strong> <strong>Plan</strong> | August 2011Chapter 8: Recommendations & Financial <strong>Plan</strong>Page 537
Federal Transit Administration Programs (continued)Fund and Primary PurposeNew Freedom Program (49 U.S.C.5317)To provide new transportation services beyondrequirements of the Americans with Disabilities Actof 1990 (ADA).The federal requirement is that projects selected forfunding be included in a locally developedcoordinated public transit/human servicetransportation plan for Sections 5310, 5316 (JARC)and 5317 (New Freedom).Eligible ActivitiesFunding is available for transportation servicesprovided by public, non-profit, or private-for-profitoperators that are both new and go beyond ADA.The Federal share is 80 percent of capital expensesand 50 percent of operating expenses. Fundsprovided under other Federal programs (other thanthose of the DOT) may be used for local/state matchfor funds provided under Section 5317, and revenuefrom service contracts may be used as local match.These tables are provided as an overview to inform the reader of the potential for the useof the FHWA and FTA funds for transportation improvements. However, it is not acomprehensive list of all the funding categories or descriptions. For more information,please see the United States Department of <strong>Transportation</strong> (U.S. DOT), and the FHWAand FTA websites:U.S. DOT: http://www.dot.gov/FHWA: http://www.fhwa.dot.gov/FTA: http://www.fta.dot.gov/8.4 SUMMARY OF PREVIOUS EXPENDITURESThe summary of previous expenditures is based on projects that were implementedthrough the local short-range planning document, the <strong>Transportation</strong> ImprovementProgram (TIP). From the RTP effort, further project specific analysis and feasibilityreview leads to project design development, and subsequently to inclusion on the TIPfor implementation. Typically, the four-year TIP is updated annually in Massachusetts.The TIP includes projects that are proposed to be ready for implementation within theTIP four-year time frame. For a "highway" funded project, this generally means that aproject on the TIP is under design, or has a design completed and approved byMassDOT. For a transit project in the TIP, the <strong>Cape</strong> <strong>Cod</strong> <strong>Regional</strong> Transit Authority(CCRTA) is a direct grant recipient from FTA, and is generally the project proponent.The CCRTA Board approves an annual budget based on available resources from FTA,state, and local sources, and the transit projects move forward with TIP and FTAapproval.Chapter 8: Recommendations & Financial <strong>Plan</strong> <strong>Cape</strong> <strong>Cod</strong> <strong>Regional</strong> <strong>Transportation</strong> <strong>Plan</strong> | August 2011Page 538
This section is to provide an overview of the previous federal aid resources invested inthe <strong>Cape</strong> <strong>Cod</strong> transportation system through the MPO processes. This does not includeadditional local resources that may be used in the area, such as the local state aid forroadways or “Chapter 90” funds.8.4.1 FEDERAL HIGHWAY ADMINISTRATION PREVIOUS EXPENDITURES(Includes state matching amount)The summary of previous expenditures on the highway side includes a variety of projectsand funding categories, and is provided for basic information here. Recently fundedspecific transportation projects within these amounts include: Route 132 section to fourlanes in Barnstable, Sagamore area improvements in Bourne, the Shining Sea Bikewayextension in Falmouth, and the Harwich intersection of Route 124 at Queen Anne RoadTime FrameAmount1993-1998 ........................................................................................... $ 34,856,2171999-2004 ........................................................................................... $ 75,522,1842005-2010 ........................................................................................... $ 55,464,533Total Amount ............................................................................. $ 165,842,934Average Annual Amount ............................................................................ $ 9,213,4168.4.2 FEDERAL LANDS HIGHWAY PROGRAM ADMINISTRATION<strong>Cape</strong> <strong>Cod</strong> has benefited historically from funding programs under the Federal LandsHighway Program (FLHP). The FLHP funds have been used for roadway and transitfacilities related by the National Park Service for access to the <strong>Cape</strong> <strong>Cod</strong> NationalSeashore, and for planning and studies in the area. The average amount of FLHP fundsto the CCNS since the previous RTP is about $2.3 million annually. With the officialfederal recognition of the Mashpee Wampanoag Tribe, FLHP funds are also available forimprovements related to the designated Indian Reservation Roads in the vicinity.However, these funds have not been included as revenues that are known for fiscalconstraint in this RTP due to the fact that there is not an estimate for future fundingamounts.8.4.3 FEDERAL TRANSIT ADMINISTRATION PREVIOUS EXPENDITURES(Includes state amount)The summary of previous expenditures on the transit side includes a variety of projectsand funding categories, and is also provided for basic information here. Recently fundedspecific transportation projects within these amounts include: replacement vehicles for<strong>Cape</strong> <strong>Cod</strong> <strong>Regional</strong> <strong>Transportation</strong> <strong>Plan</strong> | August 2011Chapter 8: Recommendations & Financial <strong>Plan</strong>Page 539
the CCRTA services, new fare boxes, bus stops, and a portion of the maintenance andoperating expenses.Time FrameAmount1993-1998 ............................................................................................. $ 36,303,7101999-2004 ............................................................................................. $ 45,089,3332005-2010 ............................................................................................. $ 68,270,818Total Amount .................................................................................. $149,672,861Average Annual Amount ............................................................................ $ 8,804,2868.5 ESTIMATED AVAILABLE FUNDSPrevious sections have outlined that the primary source for transportation planning andimplementation funds are from federal sources, along with the sub-categories of fundingpurpose and general use. In section 8.3, specific Federal Highway Administration(FHWA) and Federal Transit Administration (FTA) funding categories that may be usedon <strong>Cape</strong> <strong>Cod</strong> and the general uses are described.This section provides the estimated funding expected to be available for the next 24years—<strong>2012</strong> to 2035—for the <strong>Cape</strong> <strong>Cod</strong> Region.8.5.1 FEDERAL HIGHWAY ADMINISTRATION SOURCE FUNDSIn April 2011, the <strong>Cape</strong> <strong>Cod</strong> Region received estimated available funding on the highwayside from the Massachusetts Department of <strong>Transportation</strong> (MassDOT). A summary isincluded in the table below of the estimated available funds for the <strong>Cape</strong> <strong>Cod</strong> region fromFederal Highway Administration (FHWA) including the state matching funds.Chapter 8: Recommendations & Financial <strong>Plan</strong> <strong>Cape</strong> <strong>Cod</strong> <strong>Regional</strong> <strong>Transportation</strong> <strong>Plan</strong> | August 2011Page 540
TABLE 1 – FFY <strong>2012</strong>-2035 ESTIMATED REGIONAL TRANSPORTATION PLAN HIGHWAY FUNDING-<strong>2012</strong>-2015 2016-2020 2021-2025 2026-2030 2031-2035 TOTALTotal HighwayRevenueAvailable for<strong>Cape</strong> <strong>Cod</strong> RTPProgrammingMajor InfrastructureProjectsFederal AidBridge ProjectsNational HighwaySystem (NHS)ProjectsStatewideMaintenance<strong>Regional</strong>DiscretionaryFunding$117,572,000 $141,653,000 $194,018,000 $236,559,000 $274,237,000 $964,039,000$ 7,462,000 $10,029,000 $15,152,000 $18,514,000 $21,462,000 $72,619,000$12,642,000 $13,928,000 $20,841,000 $25,423,000 $29,472,000 $102,305,000$15,361,000 $16,462,000 $24,710,000 $30,159,000 $34,962,000 Ŕ121,654,000$49,488,000 $50,482,000 $61,433,000 $72,298,000 $83,813,000 $317,512,000$32,619,000 $50,752,000 $71,883,000 $90,167,000 $104,528,000 $349,949,000The <strong>Cape</strong> <strong>Cod</strong> <strong>Regional</strong> <strong>Transportation</strong> <strong>Plan</strong> (RTP) estimates for federal and statehighway funding are based on the existing short-term TIP estimates for <strong>2012</strong>-2014. Year2015 is level-funded with 2014, and from 2016 through 2035 an annual inflation rate of3% is calculated. The statewide items and other programs, such as the bridge program,are estimated using the current TIP/STIP shares and the same 3% annual inflation rate.Additional state financial plan factors have been considered, such as in 2022, where thenumbers increase to higher levels reflecting the repayment of the Grant AnticipationNotes (GANS) for the Accelerated Bridge Program.8.5.2 FEDERAL TRANSIT ADMINISTRATION SOURCE FUNDSIn August 2011, the <strong>Cape</strong> <strong>Cod</strong> Region received estimated available funding for transit intables from the Massachusetts Department of <strong>Transportation</strong> (MassDOT).This Federal Transit Administration (FTA) and state matching funding are allocatedthrough the <strong>Cape</strong> <strong>Cod</strong> <strong>Regional</strong> <strong>Transportation</strong> <strong>Plan</strong> (RTP) recommendations accordingto regional priorities and the funding time frame. The <strong>Cape</strong> <strong>Cod</strong> <strong>Regional</strong> TransitAuthority (CCRTA), whose Chairman also serves as MPO Member, is a direct recipient ofFederal Transit Administration funds. The CCRTA Administrator and its Board work tomaintain and operate services through use of these funds in their annual budgeting andthe TIP.In section 8.3, the various transit funding categories through the Federal TransitAdministration (FTA) are described. A summary of the estimated available funds for the<strong>Cape</strong> <strong>Cod</strong> region from Federal Transit Administration (FTA) are in Table 2; theseamounts include estimated state contract funds.<strong>Cape</strong> <strong>Cod</strong> <strong>Regional</strong> <strong>Transportation</strong> <strong>Plan</strong> | August 2011Chapter 8: Recommendations & Financial <strong>Plan</strong>Page 541
TABLE 2 – ESTIMATED REGIONAL TRANSPORTATION PLAN TRANSIT FUNDINGChapter 8: Recommendations & Financial <strong>Plan</strong> <strong>Cape</strong> <strong>Cod</strong> <strong>Regional</strong> <strong>Transportation</strong> <strong>Plan</strong> | August 2011Page 542
8.6 RECOMMENDATIONS WITHIN AVAILABLE RESOURCESThe <strong>Regional</strong> <strong>Transportation</strong> <strong>Plan</strong> (RTP) programs and projects were derived from theanalysis, outreach, and evaluation process, and resulted in the RTP alternatives list.With receipt of the estimated financial resources for the RTP, staff began the process ofaligning the expected available revenues, as shown in Table 1, to the RTP highestpriorities. The result of this process, proposed Major Infrastructure and <strong>Regional</strong>Discretionary category funds allocations, are shown in Table 3 on the following page.Each RTP project has an cost estimate for implementation in the current (FY <strong>2012</strong>) year .Of course, resources are only expected to be available over the life of the RTP on anannual basis. Therefore, costs for each project in the Year of Expenditure have beenincreased by four percent per year. The Year of Expenditure is assumed to be themiddle-year in each 5-year time band in the following table.<strong>Cape</strong> <strong>Cod</strong> <strong>Regional</strong> <strong>Transportation</strong> <strong>Plan</strong> | August 2011Chapter 8: Recommendations & Financial <strong>Plan</strong>Page 543
TABLE 3 – ALLOCATION OF AVAILABLE HIGHWAY FUNDINGProject / Program<strong>2012</strong> TotalEstimatedCostYear ofExpenditure(YOE)EstimatedCost<strong>Regional</strong>DiscretionarySourceAmountMajorInfrastructureSourceAmountTotal YOEEstimatedCostYears ofFundingSourceBarnstable: HyannisAccess Improvements $ 6,378,549 $7,462,000 $ 0 $7,462,000 $7,462,000 <strong>2012</strong>-2015Phase I #3802TIP Projects $32,619,000 $32,619,000 $32,619,000 <strong>2012</strong>-2015Subtotal Funding $6,378,549 $40,081,000 $32,619,000 $7,462,000 $40,081,000 <strong>2012</strong>-2015Barnstable: HyannisAccess ImprovementsPhase II #3802$43,621,451 $55,195,052 $45,166,052 $10,029,000 $55,195,052 2016-2020TIP Projects $5,585,948 $5,585,948 $5,585,948 2016-2020Subtotal Funding $43,621,451 $60,781,000 $50,752,000 $10,029,000 $60,781,000 2016-2020Bourne: Route 6Reconfigure Interchange $11,500,000 $18,411,871 $8,259,871 $10,152,000 $18,411,871 2021-2025One #3305<strong>Cape</strong>wide: <strong>Cape</strong> <strong>Cod</strong> RailTrail Extensions #3302 $22,422,816 $35,899,651 $30,899,651 $5,000,000 $35,899,651 2021-2025Phase ITIP Projects $32,723,478 $32,723,478 $32,723,478 2021-2025Subtotal Funding $33,922,816 $87,035,000 $71,833,000 $15,152,000 $87,035,000 2021-2025<strong>Cape</strong>wide: <strong>Cape</strong> <strong>Cod</strong> RailTrail Extensions Phase II#3302$6,265,854 $12,205,261 $12,205,261 $0 $12,205,261 2026-2030Bourne: Route 25 AccessRamp Widening/Belmont $5,110,000 $9,953,772 $0 $9,953,772 $9,953,772 2026-2030Circle Modification #4085Sandwich BarnstableYarmouth : Route 6 $10,000,000 $19,479,005 $10,918,777 $8,560,228 $19,479,005 2026-2030Hydroplaning #4011<strong>Cape</strong>wide: <strong>Transportation</strong>Management Center $6,450,000 $12,563,958 $12,563,958 $0 $12,563,958 2026-2030#3319Orleans, Eastham,Wellfleet, Truro,Provincetown: Route 6$5,000,000 $9,739,502 $9,739,502 $0 $9,739,502 2026-2030Improvements #3332Bourne: Otis Rotary Area$5,000,000Improvements #3315$9,739,502 $9,739,502 $0 $9,739,502 2026-2030TIP Projects $35,000,000 $35,000,000 $35,000,000 2026-2030Subtotal Funding $37,825,854 $108,681,000 $90,167,000 $18,514,000 $108,681,000 2026-2030<strong>Cape</strong>wide: Year-Round$16,000,000 $37,918,701Daily Rail Service #3306$30,456,701 $7,462,000 $37,918,701 2031-2035Mashpee: Mashpee$20,000,000 $47,398,376Rotary Ring Roads #3362$33,398,376 $14,000,000 $47,398,376 2031-2035TIP Projects $40,672,923 $40,672,923 $40,672,923 2031-2035Subtotal Funding $36,000,000 $125,990,000 $104,528,000 $21,462,000 $125,990,000 2031-2035Chapter 8: Recommendations & Financial <strong>Plan</strong> <strong>Cape</strong> <strong>Cod</strong> <strong>Regional</strong> <strong>Transportation</strong> <strong>Plan</strong> | August 2011Page 544
The <strong>Cape</strong> <strong>Cod</strong> Region has worked cooperatively with partners and stakeholders in anongoing effort to assess, maintain, and improve the region’s transportation system.Within the previous expenditures, there are many different types of projects that havebeen supported through the process. These include contributions to: propertyacquisition adjacent to Route 6 in Provincetown, movement and landscaping of NausetLight in Eastham, Route 132 Boulevard in Barnstable, Sagamore area improvements inBourne, along with CCRTA transit services.Balancing the expenditures to the region’s needs is increasingly difficult within theavailable federal, state, and local resources. The condition of the roadway system isalways a top concern for the region, and that includes an ongoing look at safety issues. Itis also an ongoing process with the stakeholders and partners as individual projectsand/or programs move forward. Annual expenditures for a particular category can varyfrom 10% - 100% in a given year. One example is the extensions of the bikeways on <strong>Cape</strong><strong>Cod</strong> that are increasingly used for all trip types, and also provide a healthful benefit forthe rider and the climate while reducing roadway congestion. This type of project isconsidered “Mobility” and can, in an individual year, use much of that year’s funding.The Shining Sea Bikeway extension was programmed at $4.8 million in the TIP, and wasrecently completed in Falmouth. Other projects combine multiple modes to improvevehicular, bicycle, and pedestrian operations, and therefore are difficult to categorize aspurely “roadway” improvements. Therefore, the task of projecting future funds by typewithin the limited resources is difficult, and is included for planning purposes here.TABLE 4 – ESTIMATED REGIONAL DISCRETIONARY EXPENDITURES(In Million Dollars)Anticipated<strong>2012</strong>-2015Costs(Based onthe TIP)2016 -20202021 -20252026 -20302031 -2035Total2016-2035Percentages2016-2035RoadwayReconstruction/Resurfacing$ 10.3 $ 1.8 $ 10.8 $ 11.6 $ 13.4 $ 37.6 33%Safety $ 7.1 $ 1.4 $ 8.2 $ 8.8 $ 10.1 $ 28.5 25%Mobility $ 15.2 $ 2.4 $ 13.7 $ 14.7 $ 17.1 $ 47.9 42%Total $ 32.6 $ 5.6 $ 32.7 $ 35 $ 40.6 $ 114 100%<strong>Cape</strong> <strong>Cod</strong> <strong>Regional</strong> <strong>Transportation</strong> <strong>Plan</strong> | August 2011Chapter 8: Recommendations & Financial <strong>Plan</strong>Page 545
The following table provides a list of bridge projects within the <strong>Cape</strong> <strong>Cod</strong> region withestimated costs of over $10 million that are currently scheduled for advertisement.TABLE 5 – PROJECTS FUNDED BY THE ACCELERATED BRIDGE PROGRAM/GANSCity/TownProjectEstimatedCost<strong>2012</strong>–20152016–20202021–20252026–2030ChathamBridge Streetbridge overthe MitchellRiver$14,400,000 $14,400,000TOTALACCELERATEDBRIDGEPROGRAM/GANS$14,400,000 $14,400,000Design financing and oversight is typically performed by the project proponent, who mayalso be the facility owner. Many of the <strong>Cape</strong> <strong>Cod</strong> Towns have contributed design fundsfor projects to be implemented or constructed through the MPO process funds. Allprojects seeking Federal Highway Administration (FHWA)/state funds are required tohave the project designs reviewed by the MassDOT Highway Division. A public hearingis held at the 25% design stage. Many project proponents have early local public inputmeetings during the project development process in addition to the official 25% designstage public hearing.Projects that are recommended in this <strong>Regional</strong> <strong>Transportation</strong> <strong>Plan</strong> for <strong>Cape</strong> <strong>Cod</strong> willmove forward in the short range budget for implementation—the <strong>Cape</strong> <strong>Cod</strong><strong>Transportation</strong> Improvement Program (TIP), as the project designs are developed. TheTIP aligns the projects within the next four specific years for advertising and/orimplementation. The TIP is required under federal legislation to be updated at leastevery four years. In the Commonwealth of Massachusetts the TIP is typically updatedeach year by the <strong>Cape</strong> <strong>Cod</strong> Metropolitan <strong>Plan</strong>ning Organization (MPO), in cooperationwith state and federal partners. The MPO meetings are all public and input is welcome.Chapter 8: Recommendations & Financial <strong>Plan</strong> <strong>Cape</strong> <strong>Cod</strong> <strong>Regional</strong> <strong>Transportation</strong> <strong>Plan</strong> | August 2011Page 546
8.7 CONCLUSIONThe recommended priorities to move forward in this <strong>Regional</strong> <strong>Transportation</strong> <strong>Plan</strong>(RTP) are contained within the financial resources estimated to be available for theregion over the RTP time frame. Therefore, the RTP is financially constrained.The <strong>Cape</strong> <strong>Cod</strong> region continues to collect transportation system condition, usage, andsafety data and analyze it as part of the ongoing planning process. Development andimplementation of the RTP guides future transportation improvements. However, itshould be noted that although this plan extends to 2035, the RTP is currently updatedevery four years. Therefore, the shorter-range recommended projects are beginning thedesign process now in order to move forward toward implementation.<strong>Cape</strong> <strong>Cod</strong> <strong>Regional</strong> <strong>Transportation</strong> <strong>Plan</strong> | August 2011Chapter 8: Recommendations & Financial <strong>Plan</strong>Page 547
<strong>Cape</strong> <strong>Cod</strong> <strong>2012</strong><strong>Regional</strong> <strong>Transportation</strong> <strong>Plan</strong><strong>2012</strong>-2035AIR QUALITY CONFORMITYJuly 18, 2011
Air Quality ConformityINTRODUCTIONThe 1990 Clean Air Act Amendments (CAAA) require Metropolitan <strong>Plan</strong>ningOrganizations within ozone nonattainment areas to perform air quality conformitydeterminations prior to the approval of <strong>Regional</strong> <strong>Transportation</strong> <strong>Plan</strong>s (RTPs) and<strong>Transportation</strong> Improvement Programs (TIPs). Conformity is a way to ensure thatfederal funding and approval goes to those transportation activities that are consistentwith air quality goals. This section presents information and analyses for the air qualityconformity determination for the <strong>2012</strong> <strong>Regional</strong> <strong>Transportation</strong> <strong>Plan</strong> of the <strong>Cape</strong> <strong>Cod</strong>MPO, as required by Federal Regulations 40 CFR Parts 51 and 93, and the MassachusettsConformity Regulations (310 CMR 60.03). This information and analyses include:regulatory framework, conformity requirements, planning assumptions, emissionsbudgets, and conformity consultation procedures.BACKGROUNDThe Commonwealth of Massachusetts is classified as serious nonattainment for ozone,and is divided into two nonattainment areas. The Eastern Massachusetts ozonenonattainment area includes Barnstable, Bristol, Dukes, Essex, Middlesex, Nantucket,Norfolk, Suffolk, and Worcester counties. Berkshire, Franklin, Hampden, andHampshire counties comprise the Western Massachusetts ozone nonattainment area.With these classifications, the 1990 Clean Air Act Amendments (CAAA) required theCommonwealth to reduce its emissions of volatile organic compounds (VOCs) andnitrogen oxides (NOx), the two major precursors to ozone formation to achieveattainment of the ozone standard.In April 2002, the cities of Lowell, Waltham, Worcester and Springfield were redesignatedto attainment for carbon monoxide with EPA-approved limited maintenanceplans. In April 1996, the communities of Boston, Cambridge, Chelsea, Everett, Malden,<strong>Cape</strong> <strong>Cod</strong> <strong>Regional</strong> <strong>Transportation</strong> <strong>Plan</strong> | August 2011Appendix: Air Quality ConformityPage 1
Medford, Quincy, Revere, and Somerville were classified as attainment for carbonmonoxide (CO). Air quality conformity analysis must still be completed in thesecommunities, as they have a carbon monoxide maintenance plan approved into the stateimplementation plan (SIP). The year 2010 carbon monoxide motor vehicle emissionbudget established for the Boston CO attainment area with a maintenance plan is 228.33tons of carbon monoxide per winter day.A prior conformity determination for all RTPs occurred in 2007, when theFederal Highway Administration (FHWA) – in consultation with the EnvironmentalProtection Agency (EPA New England) and the Massachusetts Department ofEnvironmental Protection (DEP) – confirmed that all 13 of the RTPs for the year 2007 inMassachusetts were in conformity with the Massachusetts State Implementation <strong>Plan</strong>(SIP). A summary of major conformity milestones in recent years is as follows:Between 2003 and 2006, several new conformity determinations were made thatwere triggered by various events, including: The 2003 regional transportation plans, achange in designation from the one-hour ozone standard to an eight-hour ozonestandard, and various changes to regional TIPs that involved reprogrammingtransportation projects across analysis years.In 2007, air quality analyses were conducted on behalf of all the 2007 <strong>Regional</strong><strong>Transportation</strong> <strong>Plan</strong>s (RTPs), the purposes of which were to evaluate the RTPs’ airquality impacts on the SIP. Conformity determinations were performed to ensure thatall regionally significant projects were included in the RTPs. The MassachusettsDepartment of <strong>Transportation</strong> found the emission levels from the 2007 <strong>Regional</strong><strong>Transportation</strong> <strong>Plan</strong>s to be in conformance with the SIP.On April 2, 2008, EPA found that the 2008 and 2009 motor vehicle emissionsbudgets (MVEBs) in the January 31, 2008 Massachusetts 8-hour ozone StateImplementation <strong>Plan</strong> revision were adequate for transportation conformity purposes.The submittal included 2008 and 2009 MVEBs for the Boston-Lawrence-Worcester(Eastern Massachusetts) and Springfield (Western Massachusetts) 8-hour ozonenonattainment areas. Massachusetts submitted these budgets as part of the 8-hourozone attainment demonstration and reasonable further progress plan for bothnonattainment areas, and as a result of EPA’s adequacy finding, these budgets wererequired to be used for conformity determinations. EPA later determined (in 2010) thatonly the most recent MVEBs - 2009 - be used for future conformity determinations.In 2010, air quality analyses were conducted on behalf of all the 2011-2014<strong>Regional</strong> <strong>Transportation</strong> Improvement Programs (TIPs), the purposes of which were toAppendix: Air Quality Conformity <strong>Cape</strong> <strong>Cod</strong> <strong>Regional</strong> <strong>Transportation</strong> <strong>Plan</strong> | August 2011Page 2
evaluate the TIPs’ air quality impacts on the SIP. Conformity determinations wereperformed to ensure that all regionally significant projects were included in the TIPs.The Massachusetts Department of <strong>Transportation</strong> found the emission levels from the2011-2014 TIPs to be in conformance with the SIP. On November 15, 2010, EPAconfirmed that both the Eastern and Western Massachusetts Non-Attainment areascollectively demonstrated transportation conformity, with concurrence fromMassachusetts DEP on 11/23/10. On December 22, 2010, FHWA and FTA determinedthat the TIPs were in conformity with the Clean Air Act and the EPA conformityregulations (40 CFR Part 51).CONFORMITY REGULATIONSThe CAAA revised the requirements for designated MPOs to perform conformitydeterminations by ozone non-attainment area for their RTPs and TIPs. Section 176 ofthe CAAA defines conformity to a State Implementation <strong>Plan</strong> to mean conformity to theplan's purpose of eliminating or reducing the severity and number of violations of theNational Ambient Air Quality Standards (NAAQS) and achieving expeditious attainmentof the standards. The <strong>Cape</strong> <strong>Cod</strong> MPO must certify that all activities outlined in the <strong>2012</strong><strong>Cape</strong> <strong>Cod</strong> <strong>Regional</strong> <strong>Transportation</strong> <strong>Plan</strong>:• will not cause or contribute to any new violation of any standard in any area• will not increase the frequency or severity of any existing violation of any standard in anyarea• will not delay the timely attainment of any standard or any required interim emissionreductions or other milestones in any areaThe federal conformity regulations from EPA set forth requirements for determiningconformity of <strong>Transportation</strong> <strong>Plan</strong>s, <strong>Transportation</strong> Improvement Programs, andindividual projects. The requirements of the conformity analysis are summarized belowand will be explained in detail in this conformity determination:• Conformity Criteria• Horizon Years• Latest planning assumptions• Latest emission model used• Timely implementation of transportation control measures (TCMs)• Conformity in accordance with the consultation procedures and SIP revisions• Public Participation Procedures• Financially Constrained Document• Procedures for Determining <strong>Regional</strong> <strong>Transportation</strong> Emissions• The Conformity Test• Consistent with emission budgets set forth in SIP• Contribute to reductions in CO nonattainment areas<strong>Cape</strong> <strong>Cod</strong> <strong>Regional</strong> <strong>Transportation</strong> <strong>Plan</strong> | August 2011Appendix: Air Quality ConformityPage 3
In addition, the regulations set specific requirements for different time periodsdepending on the timeframe of the Commonwealth’s SIP submittals to EPA. Theseperiods are defined as follows:Control Strategy Period: Once a control strategy SIP has been submitted to EPA, EPAhas to make a positive adequacy determination of the mobile source emission budgetbefore such budget can be used for conformity purposes. The conformity test in thisperiod is consistency with the mobile source emission budget.Maintenance Period is the period of time beginning when the Commonwealth submitsand EPA approves a request for redesignation to an attainment area, and lasting for 20years. The conformity test in this period is consistency with the mobile source emissionbudget.HORIZON YEAR REQUIREMENTSHorizon years for regional and state model analyses have been established following 40CFR 93.106(a) of the Federal Conformity Regulations. The years for which the regionaland state transportation models were run for ozone precursor emission estimates areshown below:• 2010: Milestone Year – This year is now being used by the statewide traveldemand model as the new base year for calculation of emission reductions of VOCs andNOx.• 2016: Milestone Year and Analysis Year: This year is used to show conformitywith the existing emission budgets for ozone precursors in Western Massachusetts.• 2020: Analysis Year• 2025: Analysis Year• 2035: Horizon Year – last forecast year of the regional transportation planLATEST PLANNING ASSUMPTIONSSection 93.110 of the Federal Conformity Regulations outlines the requirementsfor the most recent planning assumptions that must be in place at the time of theconformity determination. Assumptions must be derived from the estimates of currentAppendix: Air Quality Conformity <strong>Cape</strong> <strong>Cod</strong> <strong>Regional</strong> <strong>Transportation</strong> <strong>Plan</strong> | August 2011Page 4
and future population, households, employment, travel, and congestion most recentlydeveloped by the MPO. For the <strong>2012</strong> <strong>Cape</strong> <strong>Cod</strong> <strong>Regional</strong> <strong>Transportation</strong> <strong>Plan</strong> and otherregional plans, the MassDOT developed a series of forecasts – in cooperation with all theMPOs – that represent the most recent planning assumptions for all of Massachusetts.TRANSIT OPERATING POLICY ASSUMPTIONSFor the <strong>Cape</strong> <strong>Cod</strong> MPO, the operating policies and assumed transit ridership have notchanged since the conformity determination prepared for the 2007 <strong>Transportation</strong> <strong>Plan</strong>.LATEST EMISSIONS MODELEmission factors used for calculating emission changes were determined usingMOBILE 6, the model used by DEP in determining motor vehicle emission budgets.Emission factors for motor vehicles are specific to each model year, pollutant type,temperature, and travel speed. MOBILE 6 requires a wide range of input parametersincluding inspection and maintenance program information and other data such as antitamperingrates, hot/cold start mix, emission failure rates, vehicle fleet mix, fleet agedistribution, etc. The input variables used in this conformity determination werereceived from DEP and approved by EPA.TIMELY IMPLEMENTATION OF TRANSPORTATION CONTROLMEASURES<strong>Transportation</strong> Control Measures (TCMs) have been required in the SIP in revisionssubmitted to EPA in 1979 and 1982. All SIP TCMs have been accomplished throughconstruction or through implementation of ongoing programs. All of the projects havebeen included in the Region's <strong>Transportation</strong> <strong>Plan</strong> (present of past) as recommendedprojects or projects requiring further study. A list of those projects include:DEP submitted to EPA its strategy of programs to show Reasonable Further Progress of a15% reduction of VOCs in 1996 and the further 9% reduction of NOx toward attainmentof the National Ambient Air Quality Standards (NAAQS) for ozone in 1999. Within thatstrategy there are no specific TCM projects. The strategy does call for traffic flowimprovements to reduce congestion and, therefore, improve air quality. Othertransportation-related projects that have been included in the SIP control strategy arelisted below:<strong>Cape</strong> <strong>Cod</strong> <strong>Regional</strong> <strong>Transportation</strong> <strong>Plan</strong> | August 2011Appendix: Air Quality ConformityPage 5
• Enhanced Inspection and Maintenance Program• California Low Emission Vehicle Program• Reformulated Gasoline for On- and Off-Road Vehicles• Stage II Vapor Recovery at Gasoline Refueling Stations• Tier I Federal Vehicle StandardsCONSULTATION PROCEDURESThe final conformity regulations require that the MPO make a conformity determinationaccording to consultation procedures set out in the federal and state regulations, and theMPO must also follow public involvement procedures established under federalmetropolitan transportation planning regulations. The consultation requirements ofboth the state and federal regulations require that the <strong>Cape</strong> <strong>Cod</strong> MPO (and all otherMPOs), MassDOT, Mass. DEP, US EPA - Region 1 and FHWA – Massachusetts Division,consult on the following issues:• Selection of regional emissions analysis models including model development andassessment of project design factors for modeling• Selection of inputs to the most recent EPA-approved emissions factor model• Selection of CO hotspot modeling procedures, as necessary• Identification of regionally significant projects to be included in the regionalemissions analysis• Identification of projects which have changed in design and scope• Identification of exempt projects• Identification of exempt projects that should be treated as non-exempt because ofadverse air quality impacts• Identification of the latest planning assumptions and determination of consistencywith SIP assumptionsThese issues have all been addressed through consultation among the agencies listedabove.PUBLIC PARTICIPATION PROCEDURESTitle 23 CFR Section 450.322 and 310 CMR 60.03(6)(h) require that thedevelopment of the <strong>Regional</strong> <strong>Transportation</strong> <strong>Plan</strong>, TIP, and related certificationdocuments provide an adequate opportunity for public review and comment. Section450.316(b) also establishes the outline for MPO public participation programs.Provide a brief description of your region’s public participation program, and includehow and when this plan will be noticed in newspaper(s), by website, other locationsavailable, etc.Appendix: Air Quality Conformity <strong>Cape</strong> <strong>Cod</strong> <strong>Regional</strong> <strong>Transportation</strong> <strong>Plan</strong> | August 2011Page 6
The Draft RTP will be made available as per the 2007 Public Participation <strong>Plan</strong>. TheDraft RTP will be presented at local public meetings during the public comment periodwith broad notice to the community through mail and posting. The Draft RTP will alsobe posted online at the <strong>Cape</strong> <strong>Cod</strong> Commission transportation / MPO web site:www.gocapecod.org/rtp.Meetings expected to have the Draft RTP for discussion include, tentatively:Date Meeting LocationJuly 18, 2011 MPO Meeting BarnstableAugust 3, 2011 Public Meeting BarnstableAugust 12, 2011 CCJTC Meeting BarnstableAugust 22, 2011 MPO Meeting BarnstableAll meetings are tentative, pending the release of the Draft RTP by the MPO on July 18,2011.FINANCIAL CONSISTENCYTitle 23 CFR Section 450.322 and 40 CFR 93.108 require the <strong>2012</strong> <strong>Cape</strong> <strong>Cod</strong> <strong>Regional</strong><strong>Transportation</strong> <strong>Plan</strong> to “be financially constrained by year and include a financial planthat demonstrates which projects can be implemented using current revenue sources andwhich projects are to be implemented using proposed revenue sources.”The <strong>2012</strong> <strong>Plan</strong> is financially constrained to projections of federal and state resourcesreasonably expected to be available during the appropriate time frame. Projections offederal resources are based upon the estimated apportionment of the most recent federalauthorizations, as allocated to the region by the state or as allocated among the variousMPOs according to federal formulae or MPO agreement. Projections of state resourcesare based upon the allocations contained in the current <strong>Transportation</strong> Bond Bill andhistoric trends. Therefore, the <strong>2012</strong> <strong>Plan</strong> substantially complies with the federalrequirements relating to financial planning.MODEL SPECIFIC INFORMATION40 CFR Part 93.111 of the federal regulations outlines requirements to be used in thenetwork-based transportation demand models. These requirements include modelingmethods and functional relationships to be used in accordance with acceptableprofessional practice and reasonable for purposes of emission estimation. MassDOT, on<strong>Cape</strong> <strong>Cod</strong> <strong>Regional</strong> <strong>Transportation</strong> <strong>Plan</strong> | August 2011Appendix: Air Quality ConformityPage 7
ehalf of the <strong>Cape</strong> <strong>Cod</strong> MPO, has used the methods described in the conformityregulations in the analysis of this <strong>2012</strong> <strong>Regional</strong> <strong>Transportation</strong> <strong>Plan</strong>.HIGHWAY PERFORMANCE MONITORING SYSTEM ADJUSTMENTSAs stated in EPA guidance, all areas of serious ozone and carbon monoxidenonattainment must use FHWA’s Performance Monitoring System (HPMS) to trackdaily vehicle-miles of travel (VMT) prior to attainment to ensure that the state is in linewith commitments made in reaching attainment of the ambient air quality standards bythe required attainment dates. MassDOT provided HPMS information to DEP. DEP usedthis information in setting mobile-source budgets for VOC, NOx, and CO in all SIPrevisions prior to 1997. DEP has since revised its VOC and NOx budgets usingtransportation-demand model runs. However, the models must still be compared toHPMS data since HPMS remains the accepted tracking procedure as outlined in theregulations.The conformity regulations require that all model-based VMT be compared with theHPMS VMT to ensure that the region is in line with VMT and emission projections madeby DEP. An adjustment factor that compares the 2010 HPMS VMT to the 2010transportation model VMT has been developed. This adjustment factor is then applied toall modeled VOC and NOx emissions for the years 2016 through 2035 to ensureconsistency with EPA-accepted procedures.2010 HPMS 6,869,000 VMT = Adjustment factor = 1.541 for <strong>Cape</strong> <strong>Cod</strong>2010 Modeled 4,456,118 VMT for VOC and NOxHPMS adjustment factors, calculated on a regional basis, are applied to the model outputof future scenarios, and they change as base-year models are updated or improved, or asHPMS data is revised or updated. The latest factors for Eastern Massachusetts are asfollows:2010 HPMS Travel Demand HPMS/ModelREGION VMT (miles) Model VMT (miles) Conversion Factor<strong>Cape</strong> <strong>Cod</strong> 6,869,000 4,456,118 1.541Central Massachusetts 14,564,000 11,924,422 1.221Martha’s Vineyard 266,000 224,944 1.183Appendix: Air Quality Conformity <strong>Cape</strong> <strong>Cod</strong> <strong>Regional</strong> <strong>Transportation</strong> <strong>Plan</strong> | August 2011Page 8
2010 HPMS Travel Demand HPMS/ModelMerrimack Valley 9,353,000 9,143,834 1.023Boston 60,751,000 71,225,035 0.853Montachusett 5,015,000 4,392,193 1.142Nantucket 153,000 71,899 2.128Northern Middlesex 6,523,000 6,735,326 0.968Old Colony 6,883,000 6,549,927 1.051Southeastern Massachusetts 14,710,000 13,745,040 1.070Eastern MA 125,087,000 128,468,738 0.974State Total 148,937,000 142,159,733 1.048CHANGES IN PROJECT DESIGN SINCE THE LAST CONFORMITYDETERMINATION ANALYSISThe Commonwealth requires that any change in project design from the previousconformity determination for the region is identified. Changes that have occurred sincethe last conformity determination in 2010 are as follows:• The modeled base year has changed from 2007 to 2010.• A new analysis year has been included in the conformity determination. An airquality analysis has been completed for 2016. This complies with EPA’s <strong>Transportation</strong>Conformity Rule Restructuring Amendments (40 CFR Part 93.118, expected to becomeeffective August 2011) which states that “if the attainment date has not yet beenestablished, the first analysis year must be no more than five years beyond the year inwhich the conformity determination is being made.” (2011 base to 2016 analysis year).• Emission factors have been developed for 2010, 2016, 2020, 2025, and 2035using Mobile 6.2 with inputs approved by Mass DEP and US EPA.• New HPMS adjustment factors have been developed for the new 2010 base year.PROCEDURES FOR DETERMINING REGIONAL TRANSPORTATIONEMISSIONSThe federal conformity regulations set specific requirements for determiningtransportation emissions, which are estimated from a combination of emission rates,HPMS volume data, and travel demand model projections. Travel demand models use<strong>Cape</strong> <strong>Cod</strong> <strong>Regional</strong> <strong>Transportation</strong> <strong>Plan</strong> | August 2011Appendix: Air Quality ConformityPage 9
estimates of population, households, and employment to project future travel volumesand patterns. Chapter X of the <strong>Plan</strong> presents these estimates as part of the existing andfuture regional transportation system.Only “regionally significant” projects are required to be included in the travel demandmodeling efforts. The final federal conformity regulations define regionally significant asfollows:<strong>Regional</strong>ly significant: a transportation project (other than an exempt project) that is ona facility which serves regional transportation needs (such as access to and from the areaoutside of the region, major activity centers in the region, major planned developmentssuch as new retail malls, sport complexes, etc., or transportation terminals as well asmost terminals themselves) and would be included in the modeling of a metropolitanarea's transportation network, including at a minimum all principal arterial highwaysand all fixed guideway transit facilities that offer an alternative to regional highwaytravel.In addition, specific classes of projects have been exempted from regional modelingemissions analysis. The categories of exempt projects include:• Intersection channelization projects• Intersection signalization projects at individual intersections• Interchange reconfiguration projects• Changes in vertical and horizontal alignment• Truck size and weight inspection stations• Bus terminals and transfer pointsPrevious conformity amendments now allow traffic signal synchronization projects to beexempt from conformity determinations prior to their funding, approval orimplementation. However, once they are implemented, they must be included inconformity determinations for future plans and TIPsThe milestone and analysis year transportation model networks are composed ofprojects proposed in this RTP. Projects in these networks consist of all in-placeregionally significant projects that can reasonably be expected to be completed by a givenanalysis/horizon year with consideration of available funding commitments. Thisproject group would include, but not be limited to, regionally significant projects whereat least one of the following steps has occurred within the past three years:• Comes from the first year of a previously conforming TIP,• <strong>Complete</strong>d the NEPA process, or• Currently under construction or are undergoing right-of-way acquisitionAppendix: Air Quality Conformity <strong>Cape</strong> <strong>Cod</strong> <strong>Regional</strong> <strong>Transportation</strong> <strong>Plan</strong> | August 2011Page 10
A complete listing of future regionally significant projects for the entire EasternMassachusetts Ozone Non-Attainment Area is provided below:REGIONALLY SIGNIFICANT PROJECTS INCLUDED IN THE REGIONALTRANSPORTATION MODELS FOR THE EASTERN MASSACHUSETTSOZONE NON-ATTAINMENT AREAAnalysisYear Community Project Description – Boston Region2016 Bedford, Burlington Middlesex Turnpike Improvements Phases 1and 22016 Bellingham Pulaski Boulevard2016 Boston Fairmount Line Improvements, including new stations2016 Boston East Boston Haul Road/Chelsea Truck Route (new gradeseparated roadway)2016 Concord, Lincoln Route 2/Crosby's Corner (grade separation)2016 Danvers Route 128/Route 35 and Route 622016 Hudson Route 85 (capacity improvements from Marlborough TL to Rte 62)2016 Marshfield Route 139 Widening (to 4 lanes between School St. and FurnaceSt.)2016 Quincy Quincy Center Concourse, Phase 2 (new roadway: Parking Wayto Hancock St.)2016 Randolph to Route 128 Additional LanesWellesley2016 Somerville Assembly Square Orange Line Station2016 Somerville Assembly Square Roadways (new and reconfigured)2016 Weymouth,South Weymouth Naval Air Station Access ImprovementsHingham, Rockland2016 Region-wide 1000 Additional Park and Ride SpacesAnalysisYear Community Description of Recommended <strong>Plan</strong> Projects– Boston Region2016 Beverly Beverly Station Commuter Rail Parking Garage2016 Boston Conley Haul Road2016 Salem Salem Station Commuter Rail Parking Garage Expansion2016 Somerville,Green Line Extension to Medford Hillside/Union SquareCambridge, Medford2016 Weymouth Route 18 Capacity Improvements2020 Bedford, Burlington,BillericaMiddlesex Turnpike Improvements Phase 3 – widening <strong>Plan</strong>k St.to Manning Rd.2020 Boston Sullivan Square/Rutherford Avenue Improvements2020 Hanover Route 53 Final Phase (widening to 4 lanes between Rte 3 and Rte123)2020 Salem Bridge Street (widening to 4 lanes between Flint and WashingtonSt.)2020 Somerville, Medford Green Line Extension to Mystic Valley Parkway (Route 16)2025 CantonI-95 (NB)/Dedham Street Ramp/Dedham Street Corridor (newramp with widening on Dedham St. from I-95 to University Ave.)2025 Canton I-95/I-93 Interchange (new direct connect ramps)2025 Newton, Needham Needham Street/Highland Avenue (includes widening CharlesRiver Bridge)2025 Woburn Montvale Avenue (widening between Central St. to east ofWashington St.)<strong>Cape</strong> <strong>Cod</strong> <strong>Regional</strong> <strong>Transportation</strong> <strong>Plan</strong> | August 2011Appendix: Air Quality ConformityPage 11
2025 Woburn New Boston Street Bridge (reestablish connection over MBTALowell line)AnalysisYear CommunityDescription of Recommended <strong>Plan</strong> Projects– Boston Region(continued)2035 Braintree Braintree Split - I-93/Route 3 Interchange2035 Framingham Route 126/135 Grade Separation2035 Reading, Woburn, I-93/I-95 Interchange (new direct connect ramps)Stoneham2035 Revere, Malden,SaugusRoute 1 (widening from 4 to 6 lanes between Copeland Circle andRt. 99)2035 WilmingtonTri-Town Interchange (new “Lowell Junction” interchange on I-93between Route 125 and Dascomb Rd.)AnalysisYear Community Project Description – <strong>Cape</strong> <strong>Cod</strong> Region2020 Barnstable Yarmouth Road / Rte. 28 (widening to 4 lanes median & bike /ped) with Hyannis Access Improvements2025 Bourne Rte. 6 Exit 1 WB on-ramp changes and interchange improvements2035 Bourne Route 25 Access Ramp widening / Belmont Circle two-way travel2035 <strong>Cape</strong>wide Daily Passenger Rail Service: between Hyannis – Middleboroughfor connections to Boston and Providence, RI2035 Mashpee Mashpee Rotary Ring Roads (connectors, Great Neck Rd., Rtes.28 and 151.)AnalysisYear Community Project Description - Central Massachusetts Region2016 Northborough Rte 20 Church to South, signal coordination in corridor2016 Shrewsbury/WorcesterRte 9 Bridge over Lake Quinsigamond: widening, additional laneeach direction2016 Auburn Rte 12/20 to Auburn TL capacity improvements and raised median2016 Worcester Lincoln/Highland/Pleasant Streets intersection corridorimprovements, minor widening, select signal coordination2016 Worcester Route 20 Widening to a consistent 4 lanes2020 Charlton, Oxford Route 20 Widening to a consistent 4 lanes2025 Westborough,HopkintonI-90/I-495 and I-495/Rt 9 Interchange Improvements (CD orfrontage roads)2035 Worcester Route 122/122A Madison St/Chandler St. Kelley Square toPleasant St: various improvements and signal coordination2035 Worcester I-290 Hope Ave. (to full interchange and roundabout at Websterand Hope)2035 Millbury, Sutton Route 146 Improvements: Route 122A to Central TurnpikeAnalysisYear Community Project Description – Martha’s Vineyard Regionn/a n/a noneAnalysisYear Community Project Description – Merrimack Valley Region2016 Amesbury Route 110 from I-495 to I-95 (widen from 2 lanes to 4)2020 Newburyport,AmesburyI-95 over Merrimack River (Whittier Bridge widening from 6 to 8lanes)2020 Methuen Route 110/113 (Methuen Rotary – new interchange ramps at I-93)2025 Lawrence, North Route 114 (widening from I-495 to Waverly Road)Andover2035 AndoverTri-Town Interchange (new “Lowell Junction” interchange on I-93between Route 125 and Dascomb Rd.) and I-93 widening to 4lanes in each direction from new interchange/current “lane drop”area to I-495.AnalysisYear Community Project Description – Montachusett RegionAppendix: Air Quality Conformity <strong>Cape</strong> <strong>Cod</strong> <strong>Regional</strong> <strong>Transportation</strong> <strong>Plan</strong> | August 2011Page 12
2016 Fitchburg/Westminst New Wachusett Commuter Rail Stationer2016 Ayer to South Acton Fitchburg Line Commuter Rail Improvements (double track)2020 Leominster Route 13 Hawes St. to Prospect St. (some widening, new signals,etc)2025 Athol New Interchange on Route 2 at South Athol RoadAnalysisYear Community Project Description – Nantucket Regionn/a n/a noneAnalysis Community Project Description – Northern Middlesex RegionYear2016 Westford Route 110 Minot’s Corner to Nixon widen to 4 lanes2020 Billerica Middlesex Turnpike Improvements Phase 3 – widening <strong>Plan</strong>k St.to Manning Rd.2035 TewksburyTri-Town Interchange (new “Lowell Junction” interchange on I-93between Route 125 and Dascomb Rd.) and I-93 widening to 4lanes in each direction from new interchange/current “lane drop”area to I-495.2035 Westford I-495 at Boston Road (Exit 32) widening of on and off ramps2035 Lowell, Tewksbury,Chelmsford, andWestfordI-495 Additional travel lane each direction between Exits 32 and 35and between Exits 37 and 402035 Lowell Wood Street, Rourke Bridge: new bridge, widening and corridorimprovementsAnalysisYear Community Project Description – Old Colony Region2016 Abington Route 18 - Widening to 4 Lanes from Route 139 to Highland Rd.2020 Brockton Route 123 - Widen from Route 24 to Angus Beaton Drive2020 Bridgewatern/aRoute 24 - Add Northbound Slip Ramp from Route 104 WB toRoute 24 NB Northbound2020 Plymouth Route 3 - Add Northbound on-Ramp at Long Pond Road (Exit 5)2020 Plymouth Long Pond Road Bridge widening (Exit 5)2025 BrocktonMain Street, Warren Avenue, Spring Street, West Elm Street,Belmont Street - Reestablish Two-Way Circulation2025West BridgewaterRoute 106 - Widening from 2 to 4 Lanes between Route 24 andRoute 282035 Plymouth Route 3 – Add NB Off-ramp to Plimouth <strong>Plan</strong>tation Hwy (Exit 4)2035PlymouthRoute 25 - Add New Interchange Before Exit 1 and connect toBourne Road2035West BridgewaterRoute 28, Route 106, Central Square Signal and intersectioncoordinationAnalysisYear Community Project Description – Southeastern Massachusetts Region2016 Fall River, Somerset2016 Fall RiverNew Brightman Street Bridge - capacity improvements to 4 lanedivided facilityRoute 79/Davol Street (interchange improvements and new trafficcirculation)2016 Freetown Route 24 - New Interchange (Exit 8 ½)2016 Mansfield Route 140 / I-495 New Southbound On-RampAnalysisYearCommunity2020 DartmouthProject Description – Southeastern Massachusetts Region(continued)Route 6 (Faunce Corner Rd) / I-195 Interchange - Bridge Wideningto 5 Lanes2035 Taunton Route 24 / 140 - Interchange Reconstruction<strong>Cape</strong> <strong>Cod</strong> <strong>Regional</strong> <strong>Transportation</strong> <strong>Plan</strong> | August 2011Appendix: Air Quality ConformityPage 13
AIR QUALITY CONFORMITY ANALYSISThe emissions from the following MPOs have been combined to show conformitywith the SIP for the Eastern Massachusetts Ozone Nonattainment Area:• <strong>Cape</strong> <strong>Cod</strong> MPO• Central Massachusetts MPO• Merrimack Valley MPO• Boston MPO• Montachusett Region MPO• Northern Middlesex MPO• Old Colony MPO• Southeastern Region MPO• Martha's Vineyard Commission*• Nantucket <strong>Plan</strong>ning and Economic Development Commission** These regions do not contain any official urbanized areas, but are considered to beMPOs for planning purposes.Using the latest planning assumptions, the Massachusetts Department of<strong>Transportation</strong>, Office of <strong>Transportation</strong> <strong>Plan</strong>ning, in coordination with MPO staff,estimated the emissions for VOC and NOx for all MPOs in Eastern Massachusettsthrough a combination of the statewide and Boston Region travel demand models. TheVOC mobile source emission budget for 2009 and beyond for the Eastern MassachusettsNonattainment Area has been set at 63.50 tons per summer day and the 2009 (andbeyond) mobile source budget for NOx is 174.96 tons per summer day. As shown inTables 1 and 2, the results of the air quality analysis demonstrate that the VOC and NOxemissions from all Action scenarios are less than the VOC and NOx emissions budgetsfor the Eastern Massachusetts Nonattainment Area:Appendix: Air Quality Conformity <strong>Cape</strong> <strong>Cod</strong> <strong>Regional</strong> <strong>Transportation</strong> <strong>Plan</strong> | August 2011Page 14
TABLE 1: VOC EMISSIONS ESTIMATES FOR THE EASTERN MASSACHUSETTS OZONENONATTAINMENT AREA (ALL EMISSIONS IN TONS PER SUMMER DAY)Year<strong>Cape</strong> <strong>Cod</strong>ActionEmissionsEastern MAActionEmissionsBudgetDifference(Action - Budget)2010 n/a 64.974 n/a n/a2016 1.9519 36.232 63.50 -27.2682020 1.7496 32.386 63.50 -31.1142025 1.6404 30.988 63.50 -32.5122035 1.6981 31.063 63.50 -32.437TABLE 2: NOX EMISSIONS ESTIMATES FOR THE EASTERN MASSACHUSETTS OZONENONATTAINMENT AREA (ALL EMISSIONS IN TONS PER SUMMER DAY)Year<strong>Cape</strong> <strong>Cod</strong>ActionEmissionsEastern MAActionEmissionsBudgetDifference(Action - Budget)2010 n/a 178.925 n/a n/a2016 3.3645 66.219 174.96 -108.7412020 2.2223 45.188 174.96 -129.7722025 1.6799 36.521 174.96 -138.4392035 1.4689 29.038 174.96 -145.922The <strong>Cape</strong> <strong>Cod</strong> MPO has conducted an air quality analysis of the <strong>2012</strong> <strong>Cape</strong> <strong>Cod</strong><strong>Regional</strong> <strong>Transportation</strong> <strong>Plan</strong> and its latest conformity determination. The purpose ofthe analysis is to evaluate the air quality impacts of the <strong>Plan</strong> on the SIP. The analysisevaluates the change in ozone precursor emissions (VOCs, and NOx) due to theimplementation of the <strong>2012</strong> <strong>Cape</strong> <strong>Cod</strong> <strong>Regional</strong> <strong>Transportation</strong> <strong>Plan</strong>. The modelingprocedures and assumptions used in this air quality analysis follow guidance from EPAand the Commonwealth and are consistent with all present and past procedures used bythe Massachusetts DEP to develop and amend the SIP.MassDOT has found the emission levels from all MPOs in Eastern Massachusetts –including from the <strong>2012</strong> <strong>Cape</strong> <strong>Cod</strong> <strong>Regional</strong> <strong>Transportation</strong> <strong>Plan</strong> – to be in conformancewith the SIP according to conformity criteria. Specifically, the following conditions aremet:• The VOC emissions for the Action (build) scenarios are less than the 2009 VOCmotor vehicle emission budget for analysis years 2016 through 2035.<strong>Cape</strong> <strong>Cod</strong> <strong>Regional</strong> <strong>Transportation</strong> <strong>Plan</strong> | August 2011Appendix: Air Quality ConformityPage 15
• The NOx emissions for the Action (build) scenario are less than the 2009 NOxmotor vehicle emission budget for analysis years 2016 through 2035.In accordance with Section 176(c)(4) of the Clean Air Act as amended in 1990, the MPOfor the <strong>Cape</strong> <strong>Cod</strong> Region has completed its review and hereby certifies that the <strong>2012</strong> <strong>Cape</strong><strong>Cod</strong> <strong>Regional</strong> <strong>Transportation</strong> <strong>Plan</strong> and its latest conformity determination satisfies theconformity criteria where applicable, and therefore conditionally conforms with 40 CFRParts 51 and 93, and 310 CMR 60.03, and is consistent with the air quality goals in theMassachusetts State Implementation <strong>Plan</strong>.Appendix: Air Quality Conformity <strong>Cape</strong> <strong>Cod</strong> <strong>Regional</strong> <strong>Transportation</strong> <strong>Plan</strong> | August 2011Page 16
<strong>2012</strong> REGIONAL TRANSPORTATION PLANAppendix: Summary of Changes to PublicDraft and Comments ReceivedEndorsedAugust 22, 2011
Table of ContentsSummary of Changes to Public DraftComments Received on Public Draft<strong>Cape</strong> <strong>Cod</strong> <strong>Regional</strong> <strong>Transportation</strong> <strong>Plan</strong> | August 2011Appendix: Changes to Draft & Comments
GeneralDocument referred to as “<strong>2012</strong>” RTPReformatting (typeface, footers, etc. to conform to CCC style guide)Chapter 1 – Goals & ObjectivesSection 1.1 <strong>Transportation</strong> <strong>Plan</strong>ning ProcessAdd discussion of role of Unified <strong>Plan</strong>ning Work Program (UPWP) in the transportationplanning process.Section 1.2.1 MeetingsInsert date of Public Meeting (August 16, 2011)Section 1.3 LivabilityInclude text emphasizing US DOT support for Livability. Add indicators of MPOendorsedLivability projects to the list in Table 3 (Section 1.5.1)Section 1.4 Goals of the <strong>2012</strong> <strong>Plan</strong> – Section 1.4.1 Safety and SecurityIncluded text at end of section to strengthen connection to Massachusetts’ StrategicHighway Safety <strong>Plan</strong>Section 1.4.5 Environmental ProtectionIncluded language describing GreenDOT policySection 1.5.1 <strong>Transportation</strong> Projects since the 2007 <strong>Plan</strong> Corrected text to match total costs in Table 3 Add indicators of MPO-endorsed Livability projects to the list in Table 3.<strong>Cape</strong> <strong>Cod</strong> <strong>Regional</strong> <strong>Transportation</strong> <strong>Plan</strong> | August 2011Appendix: Changes to Draft & CommentsPage 1
Chapter 2 – Existing ConditionsSection 2.1 - Land Use & EnvironmentModify section 2.1.7 Greenhouse Gas (GHG) impacts (due to unavailable data)Section 2.2 - RoadwaysSection 2.2.6 Pavement Management – modify text to identify pavementcondition improvement given investment limited by financial constraintSection 2.2.12 U.S. Route 6 – Replace “MHD” with MassDOTTable 4 – formatting of parenthesesSection 2.7 – <strong>Cape</strong> <strong>Cod</strong> Canal AreaEmphasize fact that current year-round traffic levels exceed that of peak summerconditions of a couple of decades ago.Chapter 3 - SafetySection 3.3.3 – Coordination with Massachusetts’ Strategic Highway Safety<strong>Plan</strong> (SHSP)Included SHSP list of “Emphasis Areas” to strengthen connection between RTP &SHSP.Reference in Figure 5 to MassDOT Highway DivisionSection 3.3.4 Policies & StrategiesIdentified with asterisk items that support SHSP Emphasis Areas.Appendix: Changes to Draft & Comments <strong>Cape</strong> <strong>Cod</strong> <strong>Regional</strong> <strong>Transportation</strong> <strong>Plan</strong> | August 2011Page 2
Section 3.4 Roadway Safety Audits (RSAs)Included note that the RSAs were borne directly from the U.S. DOT & MassDOT’sHighway Safety Improvement Program (HSIP). This program was formally created bythe federal transportation legislation (SAFETEA-LU) and these efforts are intended toalign the use of data to identify the most serious safety deficiencies responsible for fatalaccidents and serious injuries.Chapter 4 – SecuritySection 4.2 – Public <strong>Transportation</strong> SecurityIncluded <strong>Cape</strong> <strong>Cod</strong> RTA implementation of items on list of “Top 20 Security ProgramAction Items for Transit Agencies.”Chapter 5 – Bike & Pedestrian IssuesIntroduction: Sentence fragment corrected regarding “<strong>Cape</strong> <strong>Cod</strong> Bikeways”Section 5.4.2 – Improvements to Existing FacilitiesAdded text summarizing public process for project selectionChapter 7 – Analysis of AlternativesUpdates to Tables 2, 3, and 4 listing state totals of population, employment, and housingforecasts & supporting discussion<strong>Cape</strong> <strong>Cod</strong> <strong>Regional</strong> <strong>Transportation</strong> <strong>Plan</strong> | August 2011Appendix: Changes to Draft & CommentsPage 3
Chapter 8 – Recommendations and Financial <strong>Plan</strong><strong>Complete</strong>d & corrected financial information in Tables 1-5, including percentagetotals of categories.Corrected table headings from “2011” to “<strong>2012</strong>,” inserted rows to create 5-yeartime bandsSection 8.5.1 Federal Highway Administration Source FundsNotes regarding inflation (3% per year for revenues)Section 8.6 Recommendations Within Available resourcesNotes regarding inflation (4% per year for costs of projects)Appendix: Changes to Draft & Comments <strong>Cape</strong> <strong>Cod</strong> <strong>Regional</strong> <strong>Transportation</strong> <strong>Plan</strong> | August 2011Page 4