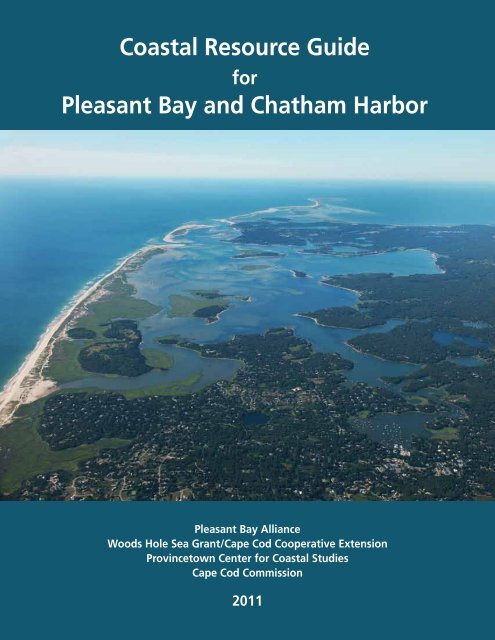
Coastal Resource Guide Pleasant Bay and ... - Town to Chatham
Coastal Resource Guide Pleasant Bay and ... - Town to Chatham
Coastal Resource Guide Pleasant Bay and ... - Town to Chatham

You also want an ePaper? Increase the reach of your titles
YUMPU automatically turns print PDFs into web optimized ePapers that Google loves.
<strong>Coastal</strong> <strong>Resource</strong> <strong>Guide</strong> for <strong>Pleasant</strong> <strong>Bay</strong> <strong>and</strong> <strong>Chatham</strong> Harbor<strong>Coastal</strong> <strong>Resource</strong> <strong>Guide</strong>for<strong>Pleasant</strong> <strong>Bay</strong> <strong>and</strong> <strong>Chatham</strong> Harbor<strong>Pleasant</strong> <strong>Bay</strong> Alliance 2011<strong>Pleasant</strong> <strong>Bay</strong> AllianceWoods Hole Sea Grant/Cape Cod Cooperative ExtensionProvince<strong>to</strong>wn Center for <strong>Coastal</strong> StudiesCape Cod Commission2011
<strong>Coastal</strong> <strong>Resource</strong> <strong>Guide</strong> for <strong>Pleasant</strong> <strong>Bay</strong> <strong>and</strong> <strong>Chatham</strong> HarborAcknowledgementsThe <strong>Coastal</strong> <strong>Resource</strong> <strong>Guide</strong> for <strong>Pleasant</strong> <strong>Bay</strong> <strong>and</strong> <strong>Chatham</strong> Harbor is a production of the <strong>Pleasant</strong> <strong>Bay</strong> Alliance in partnership with theCape Cod Commission, Woods Hole Sea Grant Program/Cape Cod Cooperative Extension, Province<strong>to</strong>wn Center for <strong>Coastal</strong> Studies <strong>and</strong>Massachusetts <strong>Coastal</strong> Zone Management. Each organization contributed funding, technical support, <strong>and</strong>/or in-kind support.Appreciation <strong>and</strong> special recognition are owed <strong>to</strong> many individuals who contributed substantially <strong>to</strong> the development of the guide. A briefdescription of these important contributions is provided below.The following contribu<strong>to</strong>rs developed maps <strong>and</strong> figures that appear throughout the guide:Greg Berman, Cape Cod Cooperative Extension/Woods Hole Sea Grant ProgramMark Borrelli, Province<strong>to</strong>wn Center for <strong>Coastal</strong> StudiesGraham Giese, Province<strong>to</strong>wn Center for <strong>Coastal</strong> StudiesPaul Lagg, <strong>Town</strong> of <strong>Chatham</strong>Anne Reynolds, Cape Cod Commission.The following individuals participated in drafting sections of the guide:Greg Berman; Mark Borrelli; Graham Giese; Ted Keon, <strong>Town</strong> of <strong>Chatham</strong>; Steve McKenna, MA <strong>Coastal</strong> Zone Management; Carole Ridley;Andy Walsh, Cape Cod Commission.Many drafts of the sections, along with figures <strong>and</strong> maps, were painstakingly reviewed by the contribu<strong>to</strong>rs noted above, <strong>and</strong> by othermembers of the <strong>Pleasant</strong> <strong>Bay</strong> Alliance <strong>Coastal</strong> <strong>Resource</strong> Work Group: Judith Bruce, George Cooper, Jane Harris, Fran McClennen, ChrisMiller <strong>and</strong> Allin Thompson.The guide was edited by Carole Ridley, Alliance Coordina<strong>to</strong>r. Production assistance was generously provided by Jeffrey Brodeur, WoodsHole Sea Grant Program. Design <strong>and</strong> layout by Lianne Dunn. Cover pho<strong>to</strong>: Kelsey-Kennard Airview © www.capecodpho<strong>to</strong>s.comTables, Figures, MapsPage List of Tables6 Table 1. Breakdown of Digitized Aerial Pho<strong>to</strong>graphs19 Table 2. Erosion Control Structures on <strong>Pleasant</strong> <strong>Bay</strong>25 Table 3. <strong>Coastal</strong> Wetl<strong>and</strong> <strong>Resource</strong> Areas <strong>and</strong> FreshwaterWetl<strong>and</strong>s in the <strong>Pleasant</strong> <strong>Bay</strong> Study Area31 Table 4. Statistically Significant Trends in Water Quality34 Table 5. Controlling Depths in <strong>Pleasant</strong> <strong>Bay</strong>34 Table 6. Estimated Dredge VolumesList of Figures3 Figure 1. Projected Changes in Nauset Beach <strong>and</strong> Inlet System4 Figure 2. Successive Morphological Changes in Nauset Beach5 Figure 3. Meetinghouse Pond Mean Monthly Tides7 Figure 4. Coverage Map of LIDAR collected in 1998,2000, 20078 Figure 5. Change over time between LIDAR collection events9 Figure 6. <strong>Chatham</strong> Inlet Development 2006-201011 Figure 7. Wind Wave Rose for WIS Station 6712 Figure 8. Interior Wind Rose, 2004 Orleans Data13 Figure 9. Tide Records, <strong>Chatham</strong> Harbor <strong>and</strong> MeetinghousePond15 Figure 10. Shoreline ProcessesList of Maps1. <strong>Pleasant</strong> <strong>Bay</strong> Regional Context2. Shoreline Change (series of four maps: North, West, Mid,South)3. Sediment Movement (series of five maps: <strong>Bay</strong>wide, North,West, Mid, South)4. Docks <strong>and</strong> Piers5. Shoreline Structures (series of four maps: North, West, Mid,South)6. His<strong>to</strong>ric Hurricane Paths7. FEMA Flood Zones8. Public Access Points9. Surficial Geology10. <strong>Coastal</strong> Wetl<strong>and</strong> <strong>Resource</strong>s (series of four maps: North, West,Mid, South)11. Areas of Critical Marine Habitat12. Eelgrass Coverage13. Fish <strong>and</strong> Wildlife14. Rare Species Habitat15. Shellfish Suitability Areas16. HESP Priority <strong>and</strong> Estimated Habitat17. Bathymetry Data for Navigational Channels (series of ninemaps: <strong>Bay</strong> wide data coverage, Meetinghouse Pond, Arey’sPond, Paw Wah Pond, Quanset Pond, Round Cove, CrowsPond, Bassing Harbor, Ministers Point)18. His<strong>to</strong>ric Navigation Channels, Areas of Maintenance Dredging<strong>and</strong> Possible Area of Shoalingi<strong>Pleasant</strong> <strong>Bay</strong> Alliance 2011
<strong>Coastal</strong> <strong>Resource</strong> <strong>Guide</strong> for <strong>Pleasant</strong> <strong>Bay</strong> <strong>and</strong> <strong>Chatham</strong> HarborGlossary of TermsAccretion: The process by which material is added <strong>to</strong> al<strong>and</strong>mass, such as a beach.Aeolian transport: Material moved by the wind.Anadromous: Migrating from salt water <strong>to</strong> spawn in freshwater.Area of Critical Environmental Concern (ACEC): A place inMassachusetts that receives special recognition because of thequality, uniqueness, <strong>and</strong> significance of its natural <strong>and</strong> culturalresources.Bathymetry: The measurement of water depths, the underwater<strong>to</strong>pography.Beach: A gently sloping zone of unconsolidated material,typically with a slightly concave profile, extending l<strong>and</strong>ward fromthe low-water line <strong>to</strong> the place where there is a definite changein material or physiographic form (such as a cliff) or <strong>to</strong> the line ofpermanent vegetation (usually the effective limit of the highests<strong>to</strong>rm waves).Beach nourishment (Beach replenishment): The addition ofmaterial <strong>to</strong> a beach or similar area <strong>to</strong> offsets erosion.Benthic: Pertaining <strong>to</strong> the seafloor.Benthos: Animals that live on the seafloor.Biogeography: The study of the geographic distribution oforganisms.Bulkhead: A retaining wall that has earth on one side, <strong>and</strong> ispartially protected against waves or tidal action along the other.Cross shore sediment transport: The movement of sedimentperpendicular <strong>to</strong> the shoreline in either direction through acombination of winds, waves <strong>and</strong> tides.CZM: <strong>Coastal</strong> Zone Management is a state agency whosemission is <strong>to</strong> balance the impacts of human activity with theprotection of coastal <strong>and</strong> marine resources.(http://www.mass.gov/czm/)ESI: Environmental Sensitivity Index provides a summary ofcoastal resources that may be at risk.Estuary: A partly enclosed coastal body of water with a freeconnection <strong>to</strong> the open sea where fresh water <strong>and</strong> salt watermix.Estuarine: Having <strong>to</strong> do with an estuary.Fetch: The distance that a given wind blows over a body ofwater without interuption.Flood <strong>and</strong> ebb shoal: A shoal formed <strong>and</strong> or maintained byflood- or ebb-tidal currents.Gabions: Wire cages filled with s<strong>to</strong>nes or other materials <strong>and</strong>stacked vertically or at an angle <strong>to</strong> protect objects or structuresbehind them.Geomorphic: Of or resembling the earth or its shape or surfaceconfiguration.Geomorphology: The scientific study of l<strong>and</strong>forms <strong>and</strong> theprocesses that shape them.Geospatial: Of or relating <strong>to</strong> the relative position of things onthe earth’s surface.Glaciation: The formation, movement, <strong>and</strong> recession of glaciers(moving ice sheets).Groundwater: Water that is located beneath the surface in soilpore spaces <strong>and</strong> in the fractures of rocks.Hindcast: The process of using data <strong>and</strong> information (e.g. wind)from the past <strong>to</strong> estimate non-measured, past conditions (e.g.waves) using numerical models.Hydrodynamics: The movement of fluids; the branch of sciencethat deals with the dynamics of fluids in motion.Intertidal: The intertidal zone is the area of the coast that liesbetween the highest normal high tide <strong>and</strong> the lowest normal lowtide.LIDAR (Light Detection And Ranging): A remote sensingtechnology that uses laser scanning <strong>to</strong> collect height or elevationdata.Lit<strong>to</strong>ral: 1) Of or relating <strong>to</strong> the coastal area of a lake, sea, orocean; 2) Of or relating <strong>to</strong> the coastal area (zone) between thelimits of high <strong>and</strong> low tides.Lit<strong>to</strong>ral cell: A section of shoreline where longshore sedimenttransport occurs without interruption during non-s<strong>to</strong>rmconditions.Lit<strong>to</strong>ral drift: See lit<strong>to</strong>ral transport.Lit<strong>to</strong>ral transport: The movement of sediment in the lit<strong>to</strong>ralzone due <strong>to</strong> the action of wave derived currents.Lit<strong>to</strong>ral processes: The interaction of winds, waves, currents,tides, sediments, <strong>and</strong> other phenomena in the lit<strong>to</strong>ral zone.Longshore current: The flow of water roughly parallel <strong>to</strong> theshoreline due <strong>to</strong> the action of wind, waves <strong>and</strong> currents.ii<strong>Pleasant</strong> <strong>Bay</strong> Alliance 2011
<strong>Coastal</strong> <strong>Resource</strong> <strong>Guide</strong> for <strong>Pleasant</strong> <strong>Bay</strong> <strong>and</strong> <strong>Chatham</strong> HarborLongshore sediment transport: The movement of sedimentroughly parallel <strong>to</strong> the shoreline due <strong>to</strong> the action of winds,waves <strong>and</strong> currents.Marcoalgae: Large aquatic pho<strong>to</strong>synthetic plants that can beseen without the aid of a microscope.MEP (The Massachusetts Estuaries Project): A project <strong>to</strong>provide water quality, nutrient loading, hydrodynamic <strong>and</strong> otherinformation for 89 estuaries in Southeastern Massachusetts.MHW (Mean High Water): A tidal datum. The average of allthe high water heights observed over the National Tidal DatumEpoch.MLW (Mean Low Water): A tidal datum. The average of allthe low water heights observed over the National Tidal DatumEpoch.MORIS (Massachusetts Ocean <strong>Resource</strong> InformationSystem): an online mapping <strong>to</strong>ol created by CZM <strong>and</strong> theMassachusetts Office of Geographic <strong>and</strong> EnvironmentalInformation (MassGIS).National Tidal Datum Epoch: The specific l9-year periodadopted by the National Ocean Service as the official timesegment over which tide observations are taken <strong>and</strong> reduced<strong>to</strong> obtain mean values (e.g., mean low water, etc.) for tidaldatums. It is necessary for st<strong>and</strong>ardization because of periodic<strong>and</strong> apparent secular trends in sea level. The present NationalTidal Datum Epoch is 1960 through 1978. It is reviewedannually for possible revision <strong>and</strong> must be actively consideredfor revision every 25 years.NHESP (The Natural Heritage & Endangered SpeciesProgram): Agency charged with the protection of the state’swide range of native biological diversity. It is part of theMassachusetts Division of Fisheries <strong>and</strong> Wildlife <strong>and</strong> is one ofthe programs forming the Natural Heritage network.Nitrogen overloading: The introduction of more nitrogen in<strong>to</strong>a system than can be naturally assimilated.NOAA (National Oceanic <strong>and</strong> Atmospheric Administration):A federal agency in the Department of Commercethat attempts <strong>to</strong> underst<strong>and</strong> <strong>and</strong> predict changes in Earth’senvironment <strong>and</strong> conserve <strong>and</strong> manage coastal <strong>and</strong> marineresources <strong>to</strong> meet economic, social, <strong>and</strong> environmental needs.Outwash: Sediment deposited by streams flowing away from amelting glacier.Overwash: The process of ocean water carrying sedimen<strong>to</strong>ver low-lying coastal areas typically during high energy events(s<strong>to</strong>rms).Rollover: Barrier beaches <strong>and</strong> dunes migrate inl<strong>and</strong> as sea levelrises <strong>and</strong> s<strong>to</strong>rms erode the beach <strong>and</strong> wash the s<strong>and</strong> over thedune, depositing it on the middle <strong>and</strong> backside of the beach asoverwash deposits. The wind-blown dunes then rebuild l<strong>and</strong>wardof their former position.Salt Pannes: Shallow depressions in coastal marshes that containvery high concentrations of salt. Pannes retain seawater for veryshort periods of time. When the seawater evaporates, the saltsremain <strong>and</strong> accumulate over many tidal cycles.Shoal: Typically a long, narrow (linear) bar of s<strong>and</strong> or gravel, also‘s<strong>and</strong> bar’, ‘gravel bar’, ‘bedform’.Sub-embayment: A smaller embayment within a larger embayedbody of water.Subtidal: The area of the seafloor below the low tide line that isalways covered by water.Subtidal shoals: A shoal that is always covered by water.Surficial geology: The characteristics of surficial deposits <strong>and</strong>including soils.Tidal amplitude: The difference in elevation between low <strong>and</strong>high tides at a particular point in a body of water.Tidal prism: The <strong>to</strong>tal volume of water that flows in<strong>to</strong> anembayment, or inlet <strong>and</strong> out again with movement of the tide,excluding any fresh water flow.Tide range: The difference in height between consecutive high<strong>and</strong> low waters. The Mean tidal range is the difference in heightbetween mean high water (MHW) <strong>and</strong> mean low water (MLW).TMDL: (Total Maximum Daily Load): A calculation of themaximum amount of a pollutant that a water body can receive<strong>and</strong> still safely meet water quality st<strong>and</strong>ards.USGS (United States Geological Survey http://www.usgs.gov/): A federal agency in the Department of Interior thatprovides impartial information on: the health of ecosystems <strong>and</strong>environments; natural hazards; natural resources; the impacts ofclimate <strong>and</strong> l<strong>and</strong>-use change; <strong>and</strong> core science systems in order <strong>to</strong>provide timely, relevant, <strong>and</strong> useable information.Washover fans: A thin, fan-shaped deposit of sedimentemplaced during an overwash event, typically a high-energy eventsuch as a s<strong>to</strong>rm.WIS (Wave Information Studies): the U.S. Army Corps ofEngineers produces wave climate information for U.S. coastalwaters. WIS information is generated by numerical simulation ofpast wind <strong>and</strong> wave conditions, a process called hindcasting.iiiRevetments: A sloped structure consisting of masonry, s<strong>to</strong>ne,s<strong>and</strong>bags, etc. constructed <strong>to</strong> protect objects or structuresbehind it.<strong>Pleasant</strong> <strong>Bay</strong> Alliance 2011
<strong>Coastal</strong> <strong>Resource</strong> <strong>Guide</strong> for <strong>Pleasant</strong> <strong>Bay</strong> <strong>and</strong> <strong>Chatham</strong> HarborTable of ContentsAcknowledgements ______________________________List of Tables, Figures <strong>and</strong> Maps ___________________Glossary of Terms ________________________________Section 1. Introduction ___________________________1.1 Purpose Statement1.2 Study Area1.3 Organization of the <strong>Guide</strong>Section 2. Barrier Beach <strong>and</strong> Inlet Dynamics ________2.1 Purpose2.2 Background2.3 Key Studies: Methodologies <strong>and</strong> Findings2.3.1 Barrier Beach <strong>and</strong> Inlet Migration2.3.2 Tide Gage Moni<strong>to</strong>ring <strong>and</strong> Analysis2.3.3 Light Detection <strong>and</strong> Ranging (LIDAR)2.3.4 Inner Shoreline Change Rates2.3.5 Digital Database of Aerial ImagerySection 3. Wave <strong>and</strong> Tidal Conditions ______________3.1 Purpose3.2 Methodology-Outer Wave Climate3.2.1 Findings-Outer Wave Climate3.3 Methodology-Inner Wave Climate3.3.1 Findings-Inner Wave Climate3.4 Tide Cycle in <strong>Pleasant</strong> <strong>Bay</strong> <strong>and</strong> <strong>Chatham</strong> HarborSection 4. Sediment Transport _____________________4.1 Purpose4.2 Methodology-Sediment Transport4.3 Findings: Sediment Transport Types in<strong>Pleasant</strong> <strong>Bay</strong> <strong>and</strong> <strong>Chatham</strong> Harbor4.3.1 Tidally Induced Transport4.3.2 Longshore Sediment Transport4.3.3 <strong>Coastal</strong> Bank <strong>and</strong> Dune Erosion4.3.4 Barrier Beach Overwash4.3.5 Cross-Shore Sediment Transport4.3.6 Aeolian Transportiiii121014Section 5. <strong>Coastal</strong> Structures _________________5.1 Purpose5.2 Methodology5.3 <strong>Coastal</strong> Structures5.3.1 Shoreline Protection Structures5.3.2 Piers <strong>and</strong> DocksSection 6. <strong>Coastal</strong> Vulnerability _______________6.1 Purpose6.2 <strong>Coastal</strong> Vulnerability6.2.1 <strong>Coastal</strong> Flooding6.2.2 Shoreline Change from <strong>Coastal</strong> Erosion<strong>and</strong> Sea Level RiseSection 7. Natural <strong>Resource</strong>s _________________7.1 Purpose7.2 Methodology7.3 Surficial Geology7.4 <strong>Coastal</strong> Wetl<strong>and</strong>s <strong>Resource</strong>s7.4.1 Beaches, Dunes <strong>and</strong> <strong>Coastal</strong> Banks7.4.2 Marine <strong>and</strong> Estuarine Wetl<strong>and</strong>s7.4.3 Freshwater Wetl<strong>and</strong>s7.5 Fish <strong>and</strong> Wildlife7.5.1 Birds7.5.2 Seal Haul-out Sites7.5.3 Anadramous Fish Runs7.5.4 Shellfish <strong>and</strong> Horseshoe Crabs7.5.5 Rare Species <strong>and</strong> Priority NaturalCommunity Types7.6 Water QualitySection 8. Bathymetry <strong>and</strong> Navigation ________8.1 Purpose8.2 Methodology8.3 Overview of the Channel System8.4 Boating8.5 His<strong>to</strong>rical Channel Depths8.6 Existing Bathymetric Conditions8.7 Shoal Migration PatternsSources _____________________________________ 3618212332Maps _______________________________________ 38iv<strong>Pleasant</strong> <strong>Bay</strong> Alliance 2011
<strong>Coastal</strong> <strong>Resource</strong> <strong>Guide</strong> for <strong>Pleasant</strong> <strong>Bay</strong> <strong>and</strong> <strong>Chatham</strong> HarborSection 1Introduction11.1 Purpose Statement<strong>Pleasant</strong> <strong>Bay</strong> is an exceptionally beautiful <strong>and</strong> environmentallysignificant estuarine system located on the eastern shore ofCape Cod in the <strong>Town</strong>s of <strong>Chatham</strong>, Orleans, Harwich, <strong>and</strong>Brewster. The <strong>Pleasant</strong> <strong>Bay</strong> system is also renowned for the diverserecreational activities it supports, including shellfishing, sailing,power boating, kayaking, wind surfing <strong>and</strong> bird watching. Thearea’s significance as an environmental <strong>and</strong> cultural resource isevidenced by its designation as an Area of Critical EnvironmentalConcern (ACEC) in 1987.The <strong>Pleasant</strong> <strong>Bay</strong> system is a collection of embayments, tidal rivers<strong>and</strong> salt ponds that currently exchange water with the AtlanticOcean through two inlets in the Nauset Barrier Beach system. Thebarrier beach <strong>and</strong> inlet system follows a quasi-cyclical pattern ofinlet formation <strong>and</strong> migration, which influences the volume <strong>and</strong>rate of tidal exchange throughout the system. The configuration ofthe barrier beach <strong>and</strong> inlets greatly influences resource conditionswithin <strong>Pleasant</strong> <strong>Bay</strong> <strong>and</strong> adjacent <strong>Chatham</strong> Harbor.The dramatic changes in the Nauset barrier system observedover the past two decades, following the formation of inletsin 1987 <strong>and</strong> 2007, have included measurable changes in tiderange <strong>and</strong> volume, sediment movement <strong>and</strong> shoreline erosion inboth <strong>Pleasant</strong> <strong>Bay</strong> <strong>and</strong> <strong>Chatham</strong> Harbor. While these conditionsare continuing <strong>to</strong> evolve, they have brought in<strong>to</strong> sharper focusa multitude of coastal resource management issues. Thesemanagement issues include protection of public <strong>and</strong> privateproperty <strong>and</strong> infrastructure from erosion, protection of publicaccess points, impacts <strong>to</strong> navigation, <strong>and</strong> impacts <strong>to</strong> fisheries,wetl<strong>and</strong>s <strong>and</strong> other coastal resources.The <strong>Coastal</strong> <strong>Resource</strong> <strong>Guide</strong> for <strong>Pleasant</strong> <strong>Bay</strong>/<strong>Chatham</strong> Harbor isintended <strong>to</strong> provide a source of objective, scientific informationregarding the status of coastal resources in the <strong>Pleasant</strong> <strong>Bay</strong> <strong>and</strong><strong>Chatham</strong> Harbor system, <strong>and</strong> the dynamic forces <strong>and</strong> trendsaffecting resource conditions. The guide draws from a number ofrecent technical studies sponsored by the <strong>Pleasant</strong> <strong>Bay</strong> Alliance,as well as existing regional <strong>and</strong> state resources, <strong>to</strong> describe trendsin barrier beach migration, tidal dynamics, flushing, water quality,<strong>and</strong> related processes.In providing this information, the guide seeks <strong>to</strong> present acomprehensive <strong>and</strong> long-term perspective on past, current <strong>and</strong>likely future resource conditions in <strong>Pleasant</strong> <strong>Bay</strong> <strong>and</strong> <strong>Chatham</strong>Harbor. The guide is intended as a resource <strong>to</strong> ConservationCommissions, planners, resource managers, property owners <strong>and</strong>interested citizens. The guide provides the technical underpinningsfor development of management recommendations <strong>and</strong> bestpractices for coastal erosion protection, beach nourishment, <strong>and</strong>dredging, <strong>and</strong> for long-term planning <strong>to</strong> protect coastal resources<strong>and</strong> minimize coastal hazards.1.2 Study AreaThe study area for the guide includes the entire <strong>Pleasant</strong> <strong>Bay</strong>ACEC <strong>and</strong> all of <strong>Chatham</strong> Harbor southward <strong>to</strong> the inlet formed in1987. Marine waterways within the study area include <strong>Chatham</strong>Harbor, <strong>Pleasant</strong> <strong>Bay</strong> <strong>and</strong> Little <strong>Pleasant</strong> <strong>Bay</strong>, numerous saltponds <strong>and</strong> coves (Meetinghouse Pond, Arey’s Pond, Pah WahPond, Kescayogansett Pond, Quanset Pond, Crow’s Pond, RoundCove, Ryder’s Cove <strong>and</strong> Bassing Harbor) <strong>and</strong> three tidal rivers(The River, Namequoit River, <strong>and</strong> Muddy Creek.) The ACEC alsoincludes eleven freshwater ponds <strong>and</strong> lakes that have a perennialhydrological connection <strong>to</strong> <strong>Pleasant</strong> <strong>Bay</strong>. The study area, includingthe <strong>Pleasant</strong> <strong>Bay</strong> ACEC <strong>and</strong> watershed boundaries, is shown onMap 1.1.3 Organization of the <strong>Guide</strong>The guide is intended <strong>to</strong> be a map-based resource <strong>to</strong> provide aspatial representation of data <strong>and</strong> information. Accordingly, eachsection contains a brief description of current resource conditions<strong>and</strong> trends, citing relevant research <strong>and</strong> background sources. Eachsection also contains references <strong>to</strong> GIS maps, compiled at theend of this document, which provide a visualization of resources,conditions <strong>and</strong> trends.In addition <strong>to</strong> this Introduction, the guide contains the followingsections:Section 2. Barrier Beach <strong>and</strong> Inlet DynamicsSection 3. Wave <strong>and</strong> Tidal ConditionsSection 4: Sediment TransportSection 5. <strong>Coastal</strong> StructuresSection 6. <strong>Coastal</strong> VulnerabilitySection 7. Natural <strong>Resource</strong>sSection 8. Bathymetry <strong>and</strong> NavigationA glossary of terms is provided at the beginning of the guide <strong>to</strong>assist readers who may be unfamiliar with some of the terms <strong>and</strong>acronyms used.The guide <strong>and</strong> a complete set of maps havebeen provided <strong>to</strong> each Alliance community<strong>and</strong> <strong>to</strong> the Cape Cod Commission. However,due <strong>to</strong> the size <strong>and</strong> number of maps, it wasnot feasible <strong>to</strong> reproduce the entire guide forbroad distribution. The guide <strong>and</strong> all mapsmay be viewed <strong>and</strong> downloaded from theAlliance website:www.pleasantbay.org.<strong>Pleasant</strong> <strong>Bay</strong> Alliance 2011
<strong>Coastal</strong> <strong>Resource</strong> <strong>Guide</strong> for <strong>Pleasant</strong> <strong>Bay</strong> <strong>and</strong> <strong>Chatham</strong> HarborSection 2Barrier Beach <strong>and</strong> Inlet Dynamics2.1 PurposeThe purpose of this section is <strong>to</strong> illustrate the nature of change inthe configuration of the Nauset Barrier Beach <strong>and</strong> inlet system, <strong>and</strong>the inner shoreline areas of <strong>Pleasant</strong> <strong>Bay</strong> <strong>and</strong> <strong>Chatham</strong> Harbor.2.2 BackgroundTogether, <strong>Pleasant</strong> <strong>Bay</strong> <strong>and</strong> <strong>Chatham</strong> Harbor encompass seventymiles of shoreline, including the backside of the Nauset barrierbeach <strong>and</strong> twelve <strong>and</strong> a half miles around six isl<strong>and</strong>s in <strong>Pleasant</strong><strong>Bay</strong>. This expanse of shoreline includes distinct barrier beach <strong>and</strong>inl<strong>and</strong>/estuarine shoreline types. The intensity of wave energyvaries for different shoreline types, from the quieter enclosedshores of salt ponds <strong>to</strong> more exposed shores subject <strong>to</strong> wavesgenerated over a longer distance.As described more fully in Section 7, the Nauset Barrier Beachseparating <strong>Pleasant</strong> <strong>Bay</strong> <strong>and</strong> <strong>Chatham</strong> Harbor from the openAtlantic Ocean is itself part of a much larger system of beachesformed of sediments eroded by wave action from the glacialdeposits of outer Cape Cod <strong>and</strong> carried southward by lit<strong>to</strong>raldrift (Giese, 1978). Relative sea level was about 15-20 feet lowersome 5,000 years ago than it is <strong>to</strong>day. As sea level gradually rose<strong>and</strong> the cliffs of Truro, Wellfleet, Eastham <strong>and</strong> Orleans retreated,some of the eroded sediment moved southward <strong>to</strong> Nauset Beach.Through time, Nauset Beach elongated <strong>and</strong> migrated westward ass<strong>to</strong>rm waves eroded beaches <strong>and</strong> dunes <strong>and</strong> s<strong>to</strong>rm overwash <strong>and</strong>tides transported sediments in<strong>to</strong> <strong>Pleasant</strong> <strong>Bay</strong>, causing the barrier<strong>to</strong> roll over itself (Howes et al, 2006).Section Highlights<strong>Pleasant</strong> <strong>Bay</strong> <strong>and</strong> <strong>Chatham</strong> Harbor encompass seventymiles of varied shoreline.The Nauset Barrier Beach <strong>and</strong> inlet system is amajor influence on tide range <strong>and</strong> natural resourceconditions in <strong>Pleasant</strong> <strong>Bay</strong>. Tide ranges increased halfa foot following the formation of the 2007 inlet, <strong>and</strong>continued <strong>to</strong> increase a tenth of a foot per year in thethree years following.The barrier beach <strong>and</strong> inlet follows a 150-year cycle ofinlet formation <strong>and</strong> migration. In accordance with thiscycle, a single stable inlet could be in place in twentyyears <strong>and</strong> begin a southward migration in thirty years,potentially ending up somewhere between Minister’sPoint <strong>and</strong> <strong>Chatham</strong> Light in fifty years.The inner shoreline of <strong>Pleasant</strong> <strong>Bay</strong> is more stablethan the outer beach shoreline. A comparison ofrates of change from 1868-2005 along twenty-fivemiles of shoreline where both the High Water Line(HWL) <strong>and</strong> the marshline were delineated showedthat approximately six miles of the HWL <strong>and</strong> fourteenmiles of the marshline exhibited statistically significantshoreline change over this timeframe.Nauset Beach is shown cluttered with clumps of peat deposited onthe ocean-facing beach following a coastal s<strong>to</strong>rm. This pho<strong>to</strong> providesfurther evidence of the coastal process known as “beach rollover.”The peat was initially formed in the marshes along the bayside of thebarrier beach. As the ocean facing beach erodes <strong>and</strong> overwashes, thebeach migrates l<strong>and</strong>ward (rolling over on itself) ultimately exposing thepeat <strong>to</strong> the open ocean. Pho<strong>to</strong>: Ted Keon<strong>Pleasant</strong> <strong>Bay</strong> Alliance 20112.3 Key Studies: Methodologies <strong>and</strong> FindingsA number of studies have compiled <strong>and</strong> analyzed current <strong>and</strong>his<strong>to</strong>rical data regarding the Nauset Barrier Beach <strong>and</strong> inlet system.These studies have helped inform our underst<strong>and</strong>ing of the trendsinfluencing barrier beach <strong>and</strong> inlet migration <strong>and</strong> their effects in<strong>Pleasant</strong> <strong>Bay</strong> <strong>and</strong> <strong>Chatham</strong> Harbor.2.3.1 Barrier Beach <strong>and</strong> Inlet Migration<strong>Pleasant</strong> <strong>Bay</strong> tides are controlled by an inlet system that generallyfollows an approximately 150-year cycle of inlet formation <strong>and</strong>migration. Figure 1 depicts this cycle. As the barrier beachelongates it moves the inlet further south of the main basin ofthe <strong>Bay</strong>. The tidal exchange between ocean <strong>and</strong> <strong>Bay</strong> decreases asthe barrier beach lengthens, creating hydraulic inefficiency. Thisinefficiency is overcome eventually by the formation of newnortherly inlets, closer <strong>to</strong> <strong>Pleasant</strong> <strong>Bay</strong>. Over time the northernmostinlet becomes the dominant, <strong>and</strong> eventually the only inlet,as the barrier isl<strong>and</strong> forming the southern inlet erodes <strong>and</strong> movesinl<strong>and</strong>. The first phase of the cycle ends—<strong>and</strong> sets the stage forthe following one —as the single inlet migrates southward farenough <strong>to</strong> recreate conditions of hydraulic inefficiency conducive<strong>to</strong> the formation of new inlets.2
<strong>Coastal</strong> <strong>Resource</strong> <strong>Guide</strong> for <strong>Pleasant</strong> <strong>Bay</strong> <strong>and</strong> <strong>Chatham</strong> HarborA full description of Nauset Barrier Beach <strong>and</strong> inlet formation<strong>and</strong> migration is found in a study commissioned by the <strong>Pleasant</strong><strong>Bay</strong> Alliance (Giese, 2009). The study builds upon earlier work(Giese,1978) <strong>and</strong> analyzes current aerial pho<strong>to</strong>graphy <strong>and</strong>more than 150 years of his<strong>to</strong>rical data <strong>to</strong> assess the likely futuremovement of the outer beach <strong>and</strong> inlet. The data show that theformation of the inlet in 2007 is a continuation of the his<strong>to</strong>ricalcycle, <strong>and</strong> that the cycle occurs in two distinct phases.Phase 1 is an inlet formation stage in which a new breachingevent launches a period of multiple inlets <strong>and</strong> changes in tides <strong>and</strong>tidal channels. The system is presently in Phase 1. It was initiatedin 1987 with the formation of a new inlet east of <strong>Chatham</strong>Light. Phase 2 is an inlet migration phase, in which a single stableinlet migrates southward. Under this scenario a single stable inletcould be in place in twenty years <strong>and</strong> begin a southward migrationin thirty years, potentially ending up somewhere betweenMinister’s Point <strong>and</strong> <strong>Chatham</strong> Light in fifty years (Figure 1).2.3.2 Tide Gage Moni<strong>to</strong>ring <strong>and</strong> AnalysisFrom 2005 through 2010, tide gage data was collected fromMeetinghouse Pond located at the headwaters of the <strong>Pleasant</strong><strong>Bay</strong> system in Orleans by Graham Giese (Province<strong>to</strong>wn Center for<strong>Coastal</strong> Studies) <strong>and</strong> Kelly Medeiros (Cape Cod National Seashore).The tide gage was deployed in the spring of 2005, 2006 <strong>and</strong> 2007,<strong>to</strong> allow the collection of data during at least one full lunar cycleeach year. However, because of the breaching of Nauset Beachin April 2007, followed by formation of a new tidal inlet, the tidegage was left in place after the 2007 deployment until commercialmarina reconstruction required its removal in December 2010. Thetide gage was redeployed in April 2011 at a nearby location.The purpose of collecting the tide gage data was <strong>to</strong> moni<strong>to</strong>rdifferences between the tides of <strong>Pleasant</strong> <strong>Bay</strong> <strong>and</strong> those of theopen Atlantic Ocean outside of the <strong>Bay</strong>. Initially the moni<strong>to</strong>ring wasundertaken in an attempt <strong>to</strong> anticipate inlet formation. Changesin tide range <strong>and</strong> phase (see Section 3), as well as changes intide dis<strong>to</strong>rtion, can give valuable information about <strong>Pleasant</strong> <strong>Bay</strong>hydrodynamics <strong>and</strong>, in so doing, give indications of conditions3Figure 1. Three images show successive morphological changes consistent with the initiation of a future wave-dominated inlet migration phaseof the system’s development. In each, the barrier beach north of the inlet has become increasingly well developed, producing (a half-centuryfollowing the 2007 breach) a well developed re-curved spit <strong>and</strong> tidal inlet in the general location of <strong>to</strong>day’s Tern Isl<strong>and</strong> (Source: Giese, 2009).<strong>Pleasant</strong> <strong>Bay</strong> Alliance 2011
<strong>Coastal</strong> <strong>Resource</strong> <strong>Guide</strong> for <strong>Pleasant</strong> <strong>Bay</strong> <strong>and</strong> <strong>Chatham</strong> HarborFigure 2 shows projected changes in the Nauset Barrier Beach <strong>and</strong> Inlet System. (Source: Giese, 2009; Mark Adams)that could lead <strong>to</strong> changes in the barrier beach inlet configuration(Figure 2).An abrupt increase in tidal range followed the formation of anew tidal inlet in 2007 (Figure 3). After this inlet formed, thegage was maintained in order <strong>to</strong> record the expected ensuingtidal changes. They show that not only did tide range increaseapproximately half a foot directly following formation of the 2007inlet, but it continued <strong>to</strong> increase at an average rate of about atenth of a foot per year during the following three years. Thesechanges indicate increased flushing of the <strong>Bay</strong> resulting fromimproving tidal connections with the ocean.<strong>Pleasant</strong> <strong>Bay</strong> Alliance 20112.3.3 Light Detection <strong>and</strong> Ranging (LIDAR)Additional measurements of the Nauset barrier shoreline have beencollected through aerial imagery <strong>and</strong> a technology known as LightDetection <strong>and</strong> Ranging (LIDAR).LIDAR is an optical remote sensing technology that uses lasers <strong>to</strong>detect the distance <strong>to</strong> an object or surface. LIDAR measurementstaken in the vicinity of <strong>Pleasant</strong> <strong>Bay</strong> appear like aerial pho<strong>to</strong>graphs,but also contain detailed elevation data on the depth or height ofl<strong>and</strong>forms.4
<strong>Coastal</strong> <strong>Resource</strong> <strong>Guide</strong> for <strong>Pleasant</strong> <strong>Bay</strong> <strong>and</strong> <strong>Chatham</strong> HarborFigure 3 illustrates the increase in tide range (difference between high tide <strong>and</strong> low tide) following the formation of a second inlet in 2007(indicated by the green vertical line). Mean monthly low tides (bot<strong>to</strong>m-most diamond shapes) remain fairly stable following the 2nd inletformation, <strong>and</strong> mean monthly high tides (<strong>to</strong>p-most diamond shapes) increased markedly, due <strong>to</strong> the higher volume of water entering the two-inletsystem. As result, tide range increased approximately a half-foot in the first few months following the 2007 inlet formation, <strong>and</strong> it continued<strong>to</strong> increase at an average rate of about a tenth of a foot per year during the following 3 years. Data were collected from a tide gage installed atMeetinghouse Pond in Orleans.LIDAR data for <strong>Pleasant</strong> <strong>Bay</strong> vary in coverage <strong>and</strong> quality. TypicallyLIDAR data sets have high resolution but his<strong>to</strong>rically have onlycovered the barrier beach systems of <strong>Pleasant</strong> <strong>Bay</strong> (Figure 4). LIDAR 1is a powerful <strong>to</strong>ol <strong>to</strong> provide the elevation or height of l<strong>and</strong>formssuch as dunes or shoals <strong>and</strong> determine how elevations change overtime. A series of change-over-time maps is shown in Figure 5. Thisexample is a broad scale analysis of a large area, <strong>and</strong> is not meantfor viewing individual parcels. A comparison of Figures 4 <strong>and</strong> 5serves <strong>to</strong> illustrate the care that must be taken in interpreting theselarge, dense data sets. For example, an uninformed analysis mightconclude that the shallow water bot<strong>to</strong>m just offshore of NausetBeach shoaled between 1998 <strong>and</strong> 2000, but deepened between2000 <strong>and</strong> 2007. In fact, of course, each data set represents only theconditions that existed at the time of the survey; they provide noinformation concerning the changes that occurred between surveys.2.3.4 Inner Shoreline Change RatesRecognizing that little scientific study or measurement hadbeen done <strong>to</strong> assess change in the inner shoreline, the Alliancecommissioned two research projects focused on the innershoreline. The first project compiled <strong>and</strong> digitized decades of aerialpho<strong>to</strong>graphy encompassing the inner shoreline available fromdisparate sources. A second study analyzed the aerial imagery <strong>to</strong>measure the extent of change in the inner shoreline.The rates of shoreline change in this resource guide are taken froma study commissioned by the <strong>Pleasant</strong> <strong>Bay</strong> Alliance (Borrelli, 2009).The study looked at shoreline change in <strong>Pleasant</strong> <strong>Bay</strong> using twodifferent shoreline indica<strong>to</strong>rs. Shoreline change from 1868 <strong>to</strong> 2005using the High Water Line (HWL) shoreline indica<strong>to</strong>r was compared<strong>to</strong> shoreline change from 1938 <strong>to</strong> 2005 using the basinward edgeof marsh vegetation, or ‘marshline’ shoreline indica<strong>to</strong>r. A detailed51 Examples of LIDAR being used within <strong>Pleasant</strong> <strong>Bay</strong> include: bathymetry data utilized in the development of a <strong>Pleasant</strong> <strong>Bay</strong> hydrodynamic model for post-breachanalysis, elevations serving as moni<strong>to</strong>ring data for the NPS, <strong>and</strong> research in<strong>to</strong> developing <strong>and</strong> testing remote sensing equipment <strong>and</strong> processing <strong>and</strong> analysis techniques.Some potential additional applications of LIDAR data within <strong>Pleasant</strong> <strong>Bay</strong> include: analyzing a time-series of beach <strong>and</strong> near shore conditions for geomorphic changestudies, habitat mapping, ecological moni<strong>to</strong>ring, change detection, <strong>and</strong> event assessment. Available seamless elevation data include: 10x10 meter – produced byUSGS NED, 5x5 meter – produced by MassGIS, <strong>and</strong> ≤ 3x3 meter LIDAR (Light Detection And Ranging) – produced by individual <strong>and</strong> joint studies by NASA, NOAA, NPS,USACE, <strong>and</strong> USGS. A logistical limitation is that LIDAR is data dense <strong>and</strong> requires a large amount of computing resources. Additionally, different LIDAR systems utilizedistinct laser wavelengths in order <strong>to</strong> vary penetration through water <strong>and</strong> saturated fine grained sediments, this can affect elevation readings in certain sediment types.Differing processing algorithms (Bare-earth, Top of Canopy, Average, etc) may be utilized, <strong>and</strong> vegetation cover can affect laser penetration <strong>to</strong> the ground. Each projectcan have systematic inaccuracies which become amplified when comparing between datasets. LIDAR surveys are a snapshot in time, <strong>and</strong> may not be reflective of typicalelevations <strong>and</strong> can be greatly influenced by individual events (think of the difference between a summer vs. winter beach, or right after a s<strong>to</strong>rm).<strong>Pleasant</strong> <strong>Bay</strong> Alliance 2011
<strong>Coastal</strong> <strong>Resource</strong> <strong>Guide</strong> for <strong>Pleasant</strong> <strong>Bay</strong> <strong>and</strong> <strong>Chatham</strong> Harbordiscussion of both indica<strong>to</strong>rs <strong>and</strong> documented changes is found inthe study report.Shoreline change from 1868 <strong>to</strong> 2005 used a combination ofTopographic sheets (T-Sheets) from the National Oceanic <strong>and</strong>Atmospheric Administration (NOAA) <strong>and</strong> hardcopy <strong>and</strong> digitalvertical aerial pho<strong>to</strong>graphy from various sources including the<strong>Town</strong> of <strong>Chatham</strong>, Cape Cod National Seashore (CCNS) <strong>and</strong> theMassachusetts Geographic Information Systems Website (www.mass.gov/mgis).Shoreline change was calculated every 65 feet for the entireshoreline of <strong>Pleasant</strong> <strong>Bay</strong>. Starting from the open ocean shorelinesouth of Nauset barrier beach in Orleans, along the entireembayment shoreline, <strong>to</strong> the northernmost point of South Beachnear the 1987 inlet. The 2005 shoreline was 62 miles long.Rates of change along 25 miles of shoreline where both theHWL <strong>and</strong> the marshline were delineated were documented<strong>and</strong> compared <strong>to</strong> one another. Less than 6.1 miles of the HWLexhibited statistically significant shoreline change as compared <strong>to</strong>14 miles of the marshline for the same segments of the shoreline.Thus, 8 miles of shoreline that saw no change using the HWL had,in fact, experienced erosion of the marshline, in some places up <strong>to</strong>55 feet. Shoreline change is depicted on the Map 2 series.Changes in marsh vegetation below the HWL have implicationsfor sediment transport, s<strong>to</strong>rm damage prevention <strong>and</strong> floodcontrol that would not be otherwise quantifiable using most othershoreline indica<strong>to</strong>rs. Furthermore, application of this method fortracking marsh change also has potential usefulness for waterquality, preda<strong>to</strong>r-prey relationships, ecosystem health <strong>and</strong> otherscience <strong>and</strong>/or management issues. The marshline allows theinvestiga<strong>to</strong>r <strong>to</strong> quantitatively assess changes in salt marsh habitatrelated <strong>to</strong> surface area, fringing marsh thickness, shorelineorientation <strong>and</strong> marsh disappearance <strong>and</strong> appearance. Thistechnique also has implications for inlet formation as inlets are lesslikely <strong>to</strong> form in places with extensive salt marsh.2.3.5 Digital Database of Aerial ImageryHis<strong>to</strong>rical aerial imagery is a useful <strong>to</strong>ol that enables resourcemanagers <strong>to</strong> track changes in a dynamic system over time (Table1). For example, Figure 6 shows successive aerial pho<strong>to</strong>graphicdepictions of the Nauset barrier beach <strong>and</strong> inlets over a periodof five years, during which time the second inlet formed. Asignificant archive of aerial pho<strong>to</strong>graphy of <strong>Pleasant</strong> <strong>Bay</strong> <strong>and</strong><strong>Chatham</strong> Harbor has been compiled by the <strong>Pleasant</strong> <strong>Bay</strong> Alliance,beginning with pho<strong>to</strong>graphs from 1938. The Alliance, in concertwith the <strong>Town</strong>s of <strong>Chatham</strong> <strong>and</strong> Orleans, continues <strong>to</strong> commissionregular aerial imaging of the entire system.Table 1. Breakdown of Digitized Aerial Pho<strong>to</strong>graphs.Year No. of Pho<strong>to</strong>s Scale Scanned Resolution Source Total Size (MegaBytes) Color/B&W1938 15 1:24,000 1200 CCNS 1659 B&W1947 7 1:18,00 1200 CCNS 758 B&W1960 66 1:10,000 (approx) 1000 CCNS 6498 B&W1970 9(9) 1:20,000 (approx) 1200 (600) CCNS 967(723) Color(B&W)1978 10 1:24,000 1200 CCNS 1085 B&W1994-APR 12 1:5,000 N/A (1 meter) MassGIS 69 B&W1994-SEP 12 1:5,000 N/A (1 meter) MassGIS 26 Color2000 161 1:6,000 600 TOC 12994 Color2001 12 1:5,000 N/A (1/2 meter) MassGIS 115 Color2003 35 1:10,000 1200 CCNS 3256 Color2005 12 1:5,000 N/A (1/2 meter) MassGIS 115 Color2009 43 ---- 30 cm MassGIS 5 Mb/file, 215 <strong>to</strong>tal Color11 Coverages (10 yrs) 348 28.3GBCCNS = Cape Cod National Seashore, TOC = <strong>Town</strong> of <strong>Chatham</strong>, MassGIS = Massachusetts Geographic Information Systems website.*Not included in Borrelli report2 Most of the images were nine by nine inches; however the desk<strong>to</strong>p scanner used was eight <strong>and</strong> one-half inches by fourteen inches. Therefore, careful attention wasrequired during scanning <strong>to</strong> determine which edge(s) would, or would not be included in the scan6<strong>Pleasant</strong> <strong>Bay</strong> Alliance 2011
<strong>Coastal</strong> <strong>Resource</strong> <strong>Guide</strong> for <strong>Pleasant</strong> <strong>Bay</strong> <strong>and</strong> <strong>Chatham</strong> Harbor7Figure 4<strong>Pleasant</strong> <strong>Bay</strong> Alliance 2011
<strong>Coastal</strong> <strong>Resource</strong> <strong>Guide</strong> for <strong>Pleasant</strong> <strong>Bay</strong> <strong>and</strong> <strong>Chatham</strong> HarborFigure 5 8<strong>Pleasant</strong> <strong>Bay</strong> Alliance 2011
<strong>Coastal</strong> <strong>Resource</strong> <strong>Guide</strong> for <strong>Pleasant</strong> <strong>Bay</strong> <strong>and</strong> <strong>Chatham</strong> Harbor2006200720082009<strong>Chatham</strong> Inlet Development 2006-201020100 0.25 0.5 1 MilesAerial Pho<strong>to</strong>graphy produced by James W. Sewall Company9Figure 6<strong>Pleasant</strong> <strong>Bay</strong> Alliance 2011
<strong>Coastal</strong> <strong>Resource</strong> <strong>Guide</strong> for <strong>Pleasant</strong> <strong>Bay</strong> <strong>and</strong> <strong>Chatham</strong> HarborSection 3Wave <strong>and</strong> Tidal Conditions3.1 PurposeThe purpose of this section is <strong>to</strong> describe wave <strong>and</strong> tidal conditionsthat impact <strong>Pleasant</strong> <strong>Bay</strong> <strong>and</strong> <strong>Chatham</strong> Harbor. Wave conditionsinclude the intensity of waves generated in the Atlantic Ocean thatreach the barrier beach, as well as waves formed inside <strong>Pleasant</strong><strong>Bay</strong> <strong>and</strong> <strong>Chatham</strong> Harbor. The cycle of tides in <strong>Pleasant</strong> <strong>Bay</strong> <strong>and</strong><strong>Chatham</strong> Harbor is an important related physical process. Tides,along with wind <strong>and</strong> wave conditions, help <strong>to</strong> move sedimentalong the shoreline, as described in Section 4.3.2 Methodology - Outer Wave ClimateOcean waves reaching the outer barrier beach shoreline areinfluenced by meteorological conditions offshore in the Gulf ofMaine <strong>and</strong> do not represent conditions in <strong>Pleasant</strong> <strong>Bay</strong>. However,underst<strong>and</strong>ing the outer ocean wave climate is important becauseit is among the dominant forces shaping the barrier beach.The direction <strong>and</strong> intensity of ocean wave energy can be depictedby a wave rose. A wave rose graphically summarizes wave height,frequency, <strong>and</strong> direction. The wave rose for this resource guide wasderived from offshore Wave Information Studies (WIS) hindcastdata. The wave rose in Figure 7 illustrates the percentage of wavesthat arrive from a given directional b<strong>and</strong> <strong>and</strong> the distribution ofwave height within that direction b<strong>and</strong>.The WIS hindcast data provide a valuable source of long-termwave data, at dense spatial resolution <strong>and</strong> over a period oftime not available from measurements. The WIS uses his<strong>to</strong>ricalmeteorological data <strong>to</strong> calculate hourly wave conditions, whichare then verified against measurements from wave buoys. Theresultant data set is comprised of twenty years (1980-1999) ofwave information, including significant wave height, peak period,<strong>and</strong> direction once each hour.A relatively small change in wave direction could correlate <strong>to</strong>a major impact on s<strong>to</strong>rm damage for a portion of shorelineprotected by headl<strong>and</strong>s, which can shelter neighboring beaches.This protection is highly sensitive <strong>to</strong> the direction from which thewaves are coming. An open stretch of barrier beach (e.g., Nauset)is much less sensitive <strong>to</strong> small changes in the angle of wave attack.It should be noted that these roses are for an area greater than tenmiles offshore of <strong>Pleasant</strong> <strong>Bay</strong> <strong>and</strong> do not take in<strong>to</strong> considerationfine-scale geometry that can have a significant local impact onwind <strong>and</strong> waves. This data is presented <strong>to</strong> illustrate the generalwind <strong>and</strong> wave patterns for the portion of the coast exposed <strong>to</strong>ocean waves.3.2.1 Findings - Outer Wave ClimateWIS station 67 has a broad, but fairly consistent, wave directionfrom between 0 <strong>and</strong> 180 degrees (north-east-south) <strong>and</strong>approximately 95% of the waves during this time had a heigh<strong>to</strong>f less than two meters. The wave rose of the offshore WISwave hindcast station shows the relatively weak westerly waveSection HighlightsThe outer coastline is dominated by waves that donot originate from local wind conditions, but insteadare generated offshore in the Gulf of Maine. Theseoffshore winds have limited influence on waveconditions inside <strong>Pleasant</strong> <strong>Bay</strong> <strong>and</strong> <strong>Chatham</strong> Harbor.Local <strong>and</strong> seasonally variable winds as well asbathymetry (water depth) <strong>and</strong> fetch (distance windtravels over water) affect wave conditions in theinterior of the <strong>Bay</strong>. The summer is characterized bylower wind speed <strong>and</strong> a dominant wind directionfrom the southwest. Winter is characterized byprevailing northwest winds <strong>and</strong> higher wind speeds.Tides within <strong>Pleasant</strong> <strong>Bay</strong> <strong>and</strong> <strong>Chatham</strong> Harborare semi-diurnal (two tidal cycles per day) with anaverage range of approximately 6 feet in <strong>Chatham</strong>Harbor <strong>and</strong> 4.5 feet at Meetinghouse Pond inOrleans at the very head of Little <strong>Pleasant</strong> <strong>Bay</strong>. Thesetides are produced by the open continental shelf(Gulf of Maine) tides which, as they rise <strong>and</strong> fall,cause seawater <strong>to</strong> flow in<strong>to</strong> <strong>and</strong> out of the estuarythrough the tidal inlets that connect the two systems.conditions for the open ocean due <strong>to</strong> the shadowing effect of theOuter Cape. All stations show the trend of a higher quantity ofwaves from the south, but a larger significant wave height fromthe north. This indicates that over the course of a year seasonal(e.g. northeasterly) waves occur with similar frequency, but theoverall impact may be larger as the higher wave heights tend<strong>to</strong> approach from the same direction. The wave data is fromall months during the twenty-year period in order <strong>to</strong> depict anannual average wave condition free of seasonal trends. The windrose for the same station <strong>and</strong> time period (also shown on Figure7) shows that most of the wind is traveling from west <strong>to</strong> east,the opposite of prevailing ocean wave conditions. This indicatesthat offshore waves are more heavily influenced by conditions inthe Atlantic Ocean than nearby l<strong>and</strong>-derived winds. As such, thewave rose likely does not represent conditions within <strong>Pleasant</strong> <strong>Bay</strong>,but instead provides insight as <strong>to</strong> the energy impacting the outercoastlines of the barrier beaches.3.3 Methodology - Inner Wave ClimateThe waves within <strong>Pleasant</strong> <strong>Bay</strong> are influenced by the localwind regime. Estimating potential wave heights can be quitecomplicated <strong>and</strong> is very site specific, but generally is a functionof wind velocity, fetch, <strong>and</strong> duration of the wind. Atlantic Oceanwaves that may enter the system through inlets also may havesome influence on the <strong>Bay</strong>’s inner wave climate. While the 10<strong>Pleasant</strong> <strong>Bay</strong> Alliance 2011
<strong>Coastal</strong> <strong>Resource</strong> <strong>Guide</strong> for <strong>Pleasant</strong> <strong>Bay</strong> <strong>and</strong> <strong>Chatham</strong> Harbor11 Figure 7<strong>Pleasant</strong> <strong>Bay</strong> Alliance 2011
<strong>Coastal</strong> <strong>Resource</strong> <strong>Guide</strong> for <strong>Pleasant</strong> <strong>Bay</strong> <strong>and</strong> <strong>Chatham</strong> HarborFigure 8. Wind data collected from a site in Orleans by the Renewable Energy Research Labora<strong>to</strong>ry, UMASS, displayed as wind roses using LakesEnvironmental Software WRPLOT View previous section on outer wave climate dealt with the forcesshaping the barrier beach, this section deals with waves generatedwithin the estuarine system. As the offshore WIS stations are notsuitable for depicting wind <strong>and</strong>/or waves within <strong>Pleasant</strong> <strong>Bay</strong>, analternative station consisting solely of wind data was utilized. From2003 <strong>to</strong> 2005 data was collected <strong>to</strong> support a Wind Data Reportfor Orleans by the Renewable Energy Research Labora<strong>to</strong>ry (RERL)at the University of Massachusetts-Amherst. This publicly availabledataset was downloaded for the resource guide <strong>and</strong> the only fullyear (2004) was extracted in order not <strong>to</strong> bias the average withseasonal trends. It should be noted that the resultant data setis comprised of only one year of data, as opposed <strong>to</strong> the twentyyears of WIS data, <strong>and</strong> therefore there is a much higher potentialfor long-term trends <strong>to</strong> be lost <strong>and</strong> for short-term perturbationsin a cycle <strong>to</strong> skew the trend. The vane (wind direction) <strong>and</strong>anemometer (wind speed) data used <strong>to</strong> generate the wind rose 12<strong>Pleasant</strong> <strong>Bay</strong> Alliance 2011
<strong>Coastal</strong> <strong>Resource</strong> <strong>Guide</strong> for <strong>Pleasant</strong> <strong>Bay</strong> <strong>and</strong> <strong>Chatham</strong> Harborwere located on a UMass <strong>to</strong>wer twenty meters off the ground,near Arey’s Pond in Orleans. The data have been filtered by RERL’squality control software, filtered <strong>to</strong> hourly average, <strong>and</strong> enteredin<strong>to</strong> Lakes Environmental Software WRPLOT View which isdesigned <strong>to</strong> created wind rose plots for meteorological data.The direction <strong>and</strong> intensity of estuarine wind energy has beendepicted by a wind rose (Figure 8). The wind rose summarizeswind speed, duration <strong>and</strong> direction. Additional detail is providedby providing three roses, one annual average, one just for Maythrough Oc<strong>to</strong>ber, <strong>and</strong> one just for November through April.3.3.1 Findings - Inner Wave ClimateThe Orleans station has a broad, but fairly consistent, annualwind direction from the northwest <strong>to</strong> the southwest. Annually,approximately 70% of the time winds are between four <strong>and</strong>eleven knots. The summer is characterized by lower wind speed<strong>and</strong> a dominant wind direction from the southwest. The winter ischaracterized by a northwest dominant wind direction <strong>and</strong> higherwind speeds. Summer winds only exceed twelve knots 6.6% ofthe time, compared <strong>to</strong> 21.5% for winter winds. The southwestwinds do not happen as often in the winter as they do in thesummer, but when they occur in the winter they are frequentlystronger.<strong>Pleasant</strong> <strong>Bay</strong> is a complex estuarine system. In addition <strong>to</strong> anirregular shoreline, it contains numerous isl<strong>and</strong>s <strong>and</strong> mobileshoals, all of which may block or redirect surface winds <strong>and</strong>/or theresultant waves. The inner wind roses are not a perfect proxy forinner wave climate, however they illustrate the seasonality of thewind, which drives wave generation within <strong>Pleasant</strong> <strong>Bay</strong>. A latersection (4.3 - Longshore Sediment Transport) further discussesinner wave climate as it relates <strong>to</strong> sediment transport.3.4 Tidal Cycle in <strong>Pleasant</strong> <strong>Bay</strong> <strong>and</strong> <strong>Chatham</strong> HarborTides within the <strong>Pleasant</strong> <strong>Bay</strong> <strong>and</strong> <strong>Chatham</strong> Harbor estuary aresemi-diurnal (two tidal cycles per day) with an average range ofsomewhat less than six feet in <strong>Chatham</strong> Harbor <strong>and</strong> about four<strong>and</strong> one-half feet at Meetinghouse Pond in Orleans at the veryhead of Little <strong>Pleasant</strong> <strong>Bay</strong> (Figure 9). These tides are producedby the open continental shelf (Gulf of Maine) tides which, as theyrise <strong>and</strong> fall, cause seawater <strong>to</strong> flow in<strong>to</strong> <strong>and</strong> out of the estuarythrough the tidal inlets that connect the two systems.Passage of the tidal wave through the inlets <strong>and</strong> inner channelsdelays <strong>and</strong> dis<strong>to</strong>rts the estuary’s tides. While high tide at <strong>Chatham</strong>Harbor occurs less than an hour following Bos<strong>to</strong>n high tide (Bos<strong>to</strong>nis the location of the region’s tidal reference station), <strong>Chatham</strong>’slow tide occurs more than an hour after Bos<strong>to</strong>n’s low. AtMeetinghouse Pond the delay <strong>and</strong> dis<strong>to</strong>rtion are greater. Highs <strong>and</strong>lows occur about two <strong>and</strong> one-half <strong>and</strong> three <strong>and</strong> one-half hours,respectively, after those at Bos<strong>to</strong>n.reducing ranges <strong>and</strong> increasing phase lags (time delay betweenthe Bos<strong>to</strong>n <strong>and</strong> local tides) over most of the 21 st Century.This discussion has concerned “astronomical” or “predicted” tidesin the estuary, but the actual water level at any time <strong>and</strong> placemay differ markedly from the predicted tides due <strong>to</strong> atmosphericconditions. A common example would be the effect of s<strong>to</strong>rmsurges along the outer coast, but even greater anomalies canresult from direct wind stress acting along the length of thesystem, either “setting-up” or “setting-down” the water level,especially in the ponds <strong>and</strong> narrows.<strong>Chatham</strong> Harbor tides are recorded (at the time of this writing) bythe National Ocean Service (NOAA) at <strong>Chatham</strong>’s municipal fishpier (Aunt Lydia’s Cove). Both “real-time” <strong>and</strong> his<strong>to</strong>ric sea leveldata are available for this station on-line at http://tides<strong>and</strong>currents.noaa.gov/. In addition, the Cape Cod National Seashore (CCNS)presently operates a tide recorder at Meetinghouse Pond inOrleans. Tidal data for a single day from both stations arepresented <strong>to</strong>gether in Figure 9.Elevation (feet - navd88)6543210-1-2-3-428Tide Records:<strong>Chatham</strong> Harbor (red) <strong>and</strong> Meetinghouse Pond (blue)28.5 29 29.5 30Oc<strong>to</strong>ber 2011Figure 9 shows changes in tide elevation over Oc<strong>to</strong>ber 28–29, 2011 for<strong>Chatham</strong> Harbor (red) <strong>and</strong> Meetinghouse Pond (Orleans) at the headof Little <strong>Pleasant</strong> <strong>Bay</strong> (blue).13As discussed in Section 2, the inlets <strong>and</strong> channels within theestuary continually shift position <strong>and</strong> these changes producecorresponding changes in <strong>Pleasant</strong> <strong>Bay</strong> <strong>and</strong> <strong>Chatham</strong> Harbor tides.The present (2011) configuration is probably near-optimal withrespect <strong>to</strong> tide range within the estuary, so we anticipate slowly<strong>Pleasant</strong> <strong>Bay</strong> Alliance 2011
<strong>Coastal</strong> <strong>Resource</strong> <strong>Guide</strong> for <strong>Pleasant</strong> <strong>Bay</strong> <strong>and</strong> <strong>Chatham</strong> HarborSection 4Sediment Transport4.1 PurposeThe purpose of this section is <strong>to</strong> describe <strong>and</strong> illustrate thefundamental processes that influence sediment movement alongthe shoreline of <strong>Pleasant</strong> <strong>Bay</strong> <strong>and</strong> <strong>Chatham</strong> Harbor.4.2 Methodology - Sediment TransportThe direction of sediment transport within the system wasdetermined from a review of shoreline type, as well as extensiveregional <strong>and</strong> local knowledge of fac<strong>to</strong>rs that influence lit<strong>to</strong>ralprocesses (e.g., waves, tides, s<strong>to</strong>rm surge, wind, etc). Directionof sediment transport is only delineated in areas where sedimentmovement is significant, i.e., shorelines exhibiting active movemen<strong>to</strong>f nearshore sediments.Along most areas of the <strong>Pleasant</strong> <strong>Bay</strong> shoreline, tides <strong>and</strong> wavescomprise the primary forces for reshaping the shoreline. The effec<strong>to</strong>f these forces varies throughout the system, from the relativelystraight, smooth outer shoreline, <strong>to</strong> inner estuarine areas wheremultiple isl<strong>and</strong>s break up the force of wind, waves <strong>and</strong> currents,resulting in an irregular coast. Beaches have formed due <strong>to</strong>long-term coastal erosion (the reworking of glacial <strong>and</strong> Holocenedeposits). Additionally, large portions of shoreline (e.g. baysideof the northern barrier beach system) are fronted by marsh whichdissipates wave energy by friction <strong>and</strong> drag, thereby reducingerosion further inl<strong>and</strong>. The natural variability in shoreline typeinfluences how a particular shoreline stretch responds <strong>to</strong> the longtermeffects of waves <strong>and</strong> tides, as well as the infrequent, shortterminfluence of s<strong>to</strong>rm waves <strong>and</strong> surge.Based on the regional geomorphology <strong>and</strong> exposure of theshoreline <strong>to</strong> wave conditions (i.e., fetch), it was possible <strong>to</strong> assessthe dominant coastal processes governing the various shorelineregions of <strong>Pleasant</strong> <strong>Bay</strong>. The Map 3 series depicting sedimentmovement provides information regarding the direction, but notthe magnitude, of longshore sediment transport <strong>and</strong> fetch datafor each 200 feet of shoreline within <strong>Pleasant</strong> <strong>Bay</strong>. As shown inthe map legend, the fetch is classified at the following intervals:1/8, 1/4, 1/2, 1, 2, 5, <strong>and</strong> 10 miles. The lack of observablelongshore sediment transport indica<strong>to</strong>rs in areas with fetch lessthan a half mile likely indicates that other coastal processes aremore significant in these areas. Fetch is one parameter thataffects potential wave height for any given section of coastline.As noted in Section 3, estimating potential wave heights can bequite complicated <strong>and</strong> is very site specific. With that in mind, waveheight generally is a function of wind velocity, fetch, <strong>and</strong> durationof the wind. Furthermore, this function does not apply in shallowwater where wave heights are limited due <strong>to</strong> forced wave breakingwhen the height exceeds approximately 0.6 <strong>to</strong> 0.8 times the waterdepth. 1Section HighlightsSediment transport along most of <strong>Pleasant</strong> <strong>Bay</strong> <strong>and</strong><strong>Chatham</strong> Harbor is predominantly characteristic oflongshore transport (drift) or tidally induced transport.Proximity <strong>to</strong> inlets can increase susceptibility <strong>to</strong> tidallyinduced transport.Proximity <strong>to</strong> a new inlet may correlate <strong>to</strong> increasedfetch <strong>and</strong> tidal flow.Longshore sediment transport is minimal in areas ofless than half a mile fetch.Headl<strong>and</strong>s <strong>and</strong> inlets (including the 2007 inlet) affectthe flow of sediment within the <strong>Pleasant</strong> <strong>Bay</strong> system.While the flow of sediment on the outer shoreline isconsistently north <strong>to</strong> south, the direction of transportalong the irregular interior shoreline of <strong>Pleasant</strong> <strong>Bay</strong>varies depending on fetch distance <strong>and</strong> wave direction.4.3 Findings: Sediment Transport Processes in <strong>Pleasant</strong><strong>Bay</strong> <strong>and</strong> <strong>Chatham</strong> HarborSediment transport in estuarine systems is more complex <strong>to</strong>map than open coast environments. Multiple inlets, new inletformation, isl<strong>and</strong>s, shoals <strong>and</strong> deltas all contribute <strong>to</strong> a shiftingfetch environment for portions of <strong>Pleasant</strong> <strong>Bay</strong>. The shorelineof <strong>Pleasant</strong> <strong>Bay</strong> is influenced by a combination of tidally inducedtransport, longshore sediment transport, coastal bank <strong>and</strong> duneerosion, barrier beach overwash, cross-shore sediment transport<strong>and</strong> aeolian transport. Each of these sediment transport processesis depicted on Figure 10 <strong>and</strong> is described below.4.3.1 Tidally Induced TransportTidal forces influence all of <strong>Pleasant</strong> <strong>Bay</strong>, but are even moredominant near the inlets. Other coastal processes, such aslongshore sediment transport, are more important in areas subject<strong>to</strong> significant wave action. At most inlets tidal currents arestrong enough <strong>to</strong> suspend <strong>and</strong> move sediment. For this reason,some inlets can remain open without significant dredging. Tidalcurrents can be strong enough <strong>to</strong> shape those sections of beachimmediately adjacent <strong>to</strong> the inlet. Inlet tidal currents are typicallystrongest <strong>and</strong> have the largest influence over sediment transportin the vicinity of inlets. The formation of a new tidal inlet cantransport vast quantities of sediment in the form of shifting1 The USACE (EM 1110-2-1100) suggests that fetch <strong>and</strong> wind speed can be used <strong>to</strong> estimate the wave height <strong>and</strong> period from the deepwater equations, then if waveheight exceeds 0.6 times the depth, wave height should be limited <strong>to</strong> 0.6 times the depth.14<strong>Pleasant</strong> <strong>Bay</strong> Alliance 2011
<strong>Coastal</strong> <strong>Resource</strong> <strong>Guide</strong> for <strong>Pleasant</strong> <strong>Bay</strong> <strong>and</strong> <strong>Chatham</strong> Harbormigrating bars, ebb <strong>and</strong> flood deltas, <strong>and</strong> even the entire barrierisl<strong>and</strong> system. An example of an area dominated by tidal transportis Strong Isl<strong>and</strong>, which is close <strong>to</strong> the 2007 inlet <strong>and</strong> focuses tidalflow through channels adjacent <strong>to</strong> the isl<strong>and</strong>.Waves breaking on Nauset Beach at an angle can suspend <strong>and</strong> thentransport sediment along the shoreline. Pho<strong>to</strong>: Greg Berman4.3.2 Longshore Sediment TransportWaves typically break at an angle in the surf zone (not perfectlyperpendicular <strong>to</strong> the shore), <strong>and</strong> so much of their energy isreleased in the form of a current that flows parallel <strong>to</strong> theshoreline. This wave-driven current moving along the coast iscalled the longshore current. If the waves have sufficient energy,they can mobilize sediment in<strong>to</strong> the water column (e.g., due <strong>to</strong>wave breaking). This s<strong>and</strong> will be carried by the longshore current,moving it down the beach. This process of suspended s<strong>and</strong> beingcarried along the coast by the longshore current is referred <strong>to</strong>as longshore sediment transport, or drift. This process shouldnot be thought of as s<strong>and</strong> flowing along the coast at a steadyrate at all times. Rather, longshore sediment transport is betterunders<strong>to</strong>od as an episodic event related <strong>to</strong> periods of high waveenergy. Net longshore transport can be defined as the sum ofsediment movement under all wave conditions (accounting fordifferent transport directions), while gross longshore transport is<strong>to</strong>tal transport up <strong>and</strong> down the beach. Some beaches may havea large gross transport <strong>and</strong> a minimal net transport if there is not adominant wind/wave direction.15Figure 10 illustrates the fundamental processes that move sediment along a generalized shoreline. Longshore Transport-a wave driven currentmoving along the coast is called the longshore current. The current can mobilize sediment in<strong>to</strong> the water column <strong>and</strong> transport materials downthe beach. This process is referred <strong>to</strong> as longshore sediment transport or longshore drift. Tidal-the ebb <strong>and</strong> flow of tidal waters mobilizingsediment can be dominant near inlets. Aeolian-strong winds can mobilize the s<strong>and</strong> along a dry beach. <strong>Coastal</strong> Bank <strong>and</strong> Dune Erosion-direct waveimpact at the base removes material <strong>and</strong> subsequently can cause instability <strong>and</strong> collapse of portions above wave action. Overwash-the flow ofwater <strong>and</strong> sediment over a beach <strong>and</strong>/or dune that does not directly return <strong>to</strong> the ocean, this process typically forms a fan of material. Cross-Shore-a component of wave transport that moves sediment onshore <strong>and</strong> offshore. A winter beach profile is characterized by s<strong>and</strong> moving fromthe dry beach <strong>to</strong> shallow water areas offshore, in the summer months this s<strong>and</strong> is returned <strong>to</strong> the beach.<strong>Pleasant</strong> <strong>Bay</strong> Alliance 2011
<strong>Coastal</strong> <strong>Resource</strong> <strong>Guide</strong> for <strong>Pleasant</strong> <strong>Bay</strong> <strong>and</strong> <strong>Chatham</strong> HarborWith larger waves there is a wider surfzone, stronger longshore currents,<strong>and</strong> an increase in the amount ofs<strong>and</strong> that is suspended in the watercolumn. As a result, little sedimentmay be transported over weeks/months of low wave energy followedby relatively large volumes of sedimentbeing moved during a s<strong>to</strong>rm event.However, depending on the number<strong>and</strong> intensity of s<strong>to</strong>rm events,characteristic conditions of low waveenergy may move more material overthe course of a year.Where appropriate, the long-termdirection of longshore sedimenttransport (or lit<strong>to</strong>ral drift) has beendepicted as arrows on the Map 3 series.These arrows only indicate net direction of sediment transport<strong>and</strong> not the relative magnitude of transport. The direction oflongshore sediment transport was delineated only where sufficientinformation was available <strong>to</strong> determine the net direction ofsediment movement. Regions starved of natural lit<strong>to</strong>ral sedimentsmay experience long-term weakening of the beach’s natural s<strong>to</strong>rmprotection function. An example of an area dominated by thistype of transport is the outer coast of the barrier beach (NausetBeach), near the inlet, for which it has been well documented thatsediment is being transported southward.Although all (or at least most) coastal processes influence sedimentmovement in every portion of the <strong>Bay</strong>, the dominant processesalong the developed shorelines of <strong>Pleasant</strong> <strong>Bay</strong> are longshore <strong>and</strong>tidally induced transport. The additional processes described belowmay be important in localized areas, but have relatively less impactin the overall system.4.3.3 <strong>Coastal</strong> Bank <strong>and</strong> Dune Erosion<strong>Coastal</strong> banks along the shore of <strong>Pleasant</strong> <strong>Bay</strong> are comprised ofglacial sediments consisting primarily of gravelly s<strong>and</strong> with localfine-grained inclusions (silt <strong>and</strong> clay) <strong>and</strong> can include glacial till<strong>Coastal</strong> bank erosion at Namequoit Point. Pho<strong>to</strong>: Judith BruceAtlantic Ocean waves overwash Nauset Barrier Beach. Pho<strong>to</strong>: Ted Keon(see Section 7.3, Surficial Geology). <strong>Coastal</strong> bank erosion providesan important source of material <strong>to</strong> beaches, tidal flats, <strong>and</strong> saltmarshes. In general, the erosion of banks can be attributed <strong>to</strong> directwave impact at the base, which removes material. Following theerosion at the base of the bank, the upper portions may collapseunder their own weight, falling <strong>to</strong> the beach below. Alternately,scarped dunes can heal between s<strong>to</strong>rm events, <strong>and</strong> vegetation cancolonize in the newly built-up sediment. This process is knownas dune prograding. Other mechanisms that can play a rolein bank <strong>and</strong> dune erosion include upl<strong>and</strong> runoff, groundwaterseepage through the bank face, freezing <strong>and</strong> thawing cycles, <strong>and</strong>direct erosion from wind <strong>and</strong> rain. It should also be noted thatbank erosion is largely an episodic event, corresponding <strong>to</strong> s<strong>to</strong>rmconditions with high water levels <strong>and</strong> large waves. This episodicerosion should be kept in mind when considering average erosionrates for banked shorelines. An example of an area dominatedby this type of transport is recent erosion at Namequoit Point, asshown in the picture at left.4.3.4 Barrier Beach OverwashOverwash is the flow of water <strong>and</strong> sediment over a beach <strong>and</strong>/or dune crest that does not directly return <strong>to</strong> the ocean. Overwashbegins when the runup level of waves, usually coinciding with as<strong>to</strong>rm surge, exceeds the local beach or dune crest height. As thewater level in the ocean rises <strong>to</strong> a level where the beach or dunecrest is over-<strong>to</strong>pped, a steady sheet of water <strong>and</strong> sediment runsover the backside of the barrier beach, forming overwash fansthat may serve as platforms for future salt marsh development.Along barrier beach systems, s<strong>and</strong> derived from the beach face istransported by waves in<strong>to</strong> the bays or harbors backing the barrier.On undeveloped barrier beaches, overwash <strong>and</strong> aeolian transportare the mechanisms by which the barrier migrates l<strong>and</strong>ward inresponse <strong>to</strong> sea level rise (known as “rollover”), maintaining theintegrity of the barrier beach system. As a result of major s<strong>to</strong>rms,dunes can be destroyed or weakened along barrier beaches. Barrierbeach weakening typically is temporary, as natural coastal processesrebuild the barrier. An example of an area dominated by this typeof transport is the bayside of the barrier beach that is comprised ofoverwash fans that have been colonized by salt marsh.16<strong>Pleasant</strong> <strong>Bay</strong> Alliance 2011
<strong>Coastal</strong> <strong>Resource</strong> <strong>Guide</strong> for <strong>Pleasant</strong> <strong>Bay</strong> <strong>and</strong> <strong>Chatham</strong> Harborwinter months, while during summer months this s<strong>and</strong> is returned<strong>to</strong> the beach. In general, steeper, high-energy waves during thewinter months cause sediment <strong>to</strong> move seaward <strong>and</strong> the milderlate spring through fall wave climate causes s<strong>and</strong> <strong>to</strong> migrateback on<strong>to</strong> the beach face. The movement of s<strong>and</strong> back <strong>and</strong> forthperpendicular <strong>to</strong> the shoreline is called cross-shore sedimenttransport. This process can be dominant on relatively short beachesbetween sections of erosion-resistant coast, where there is littleopportunity for a strong longshore current <strong>to</strong> be generated. Anexample of an area dominated by this type of transport can bethe coves <strong>and</strong> ponds throughout the bay, or the summer/winterprofiles of the ocean-facing barrier beach.A widened “summer” beach profile at Scatteree will narrow as onshore sediments are moved offshore by winter s<strong>to</strong>rms. Pho<strong>to</strong>: GregBerman4.3.5 Cross-Shore Sediment TransportIn addition <strong>to</strong> s<strong>and</strong> moving parallel <strong>to</strong> the coast, there is alsoa component of transport that moves sediment onshore <strong>and</strong>offshore (i.e., cross-shore transport). A familiar example of this isthe formation of a winter beach profile, where s<strong>and</strong> is moved fromthe dry beach <strong>to</strong> shallow water areas offshore, typically forming anearshore bar. Offshore s<strong>and</strong> migration typically occurs during the4.3.6 Aeolian TransportUnder strong enough winds, the s<strong>and</strong> along the dry beach canbe mobilized <strong>and</strong> carried away from its original location. Thistransport of dry s<strong>and</strong> by wind forces, called aeolian transport, istypically less dominant on an estuarine shoreline due <strong>to</strong> reducedfetch, availability of sediments, <strong>and</strong> dense vegetation. Anyimpediment <strong>to</strong> the s<strong>and</strong>’s movement along the beach can serve <strong>to</strong>limit windblown transport. Fencing <strong>and</strong> beach grass planting arecommon examples of such efforts <strong>to</strong> limit aeolian transport <strong>and</strong>/orencourage the deposition of wind blown s<strong>and</strong>s in specific locationssuch as on an existing dune. An example of an area dominatedby this type of natural transport is the extensive dune system onNauset Beach.17The extensive dune system on Nauset Beach is an example of an area dominated by aeolian transport. Pho<strong>to</strong> by Greg Berman<strong>Pleasant</strong> <strong>Bay</strong> Alliance 2011
<strong>Coastal</strong> <strong>Resource</strong> <strong>Guide</strong> for <strong>Pleasant</strong> <strong>Bay</strong> <strong>and</strong> <strong>Chatham</strong> HarborSection 5<strong>Coastal</strong> Structures5.1 PurposeThe purpose of this section is <strong>to</strong> describe <strong>and</strong> illustrate the type<strong>and</strong> distribution of coastal structures within the <strong>Pleasant</strong> <strong>Bay</strong>system. The function of coastal structures <strong>and</strong> their potentialimpacts <strong>to</strong> the coastal zone also are described.5.2 MethodologyThe type, number <strong>and</strong> distribution of coastal structures in <strong>Pleasant</strong><strong>Bay</strong> were derived from a combination of existing geospatialdata <strong>and</strong> local knowledge. In 1996, large-scale base maps withparcel boundaries produced by the Cape Cod Commission wereused by local resource managers (Harbormasters, Conservation,Environmental Staff) <strong>to</strong> map the approximate locations of coastalstructures around the <strong>Bay</strong>. The locations were then digitized by theCape Cod Commission for mapping purposes <strong>and</strong> a GIS databasewas created for the 1998 <strong>Pleasant</strong> <strong>Bay</strong> <strong>Resource</strong> ManagementPlan. The 1996 data was augmented with more recent datataken from field observations by local resource managers involvedwith the 2008 plan update. The location of many of the softshoreline structures were provided by conservation permittingrecords. Shoreline structures in the <strong>Chatham</strong> section are currentlybeing updated using information derived from aerial pho<strong>to</strong>graphy.5.3 <strong>Coastal</strong> Structures<strong>Coastal</strong> structures in <strong>Pleasant</strong> <strong>Bay</strong> include shorefront protectionstructures, as well as piers, docks, floats, <strong>and</strong> elevated walkways,etc. Shorefront protection structures (“hard structures”) <strong>and</strong> otherapproaches (“soft solutions” such as fiber rolls, pictured right)are used <strong>to</strong> manage shoreline erosion, especially on developedcoasts. Revetments, bulkheads, <strong>and</strong> gabions are examples of hardstructures, while soft structures or soft stabilization techniquesinclude fiber rolls, artificial dunes with beach grass plantings orfencing, <strong>and</strong> beach nourishment.Section Highlights<strong>Coastal</strong> structures in <strong>Pleasant</strong> <strong>Bay</strong> include shorefrontprotection structures <strong>to</strong> manage coastal erosion <strong>and</strong>docks <strong>and</strong> piers <strong>to</strong> provide water access. In 2007,approximately 160 piers <strong>and</strong> docks were locatedaround the <strong>Bay</strong>. These structures may impact coastalenvironments by altering water circulation <strong>and</strong>causing scour, or by shading vegetation.“Hard” shorefront protection structures includerevetments, bulkheads, <strong>and</strong> gabions. In 2007, therewere 132 hard structures around the <strong>Bay</strong>. Thesemostly permanent structures may affect sedimentdynamics along the shore by inhibiting bankerosion, causing scour near the base <strong>and</strong>/or end ofthe structure <strong>and</strong> lowering of beach profile on thefronting beach.Soft stabilization structures or solutions around the<strong>Bay</strong> include fiber rolls, artificial dunes with plantingsor fencing, <strong>and</strong> beach nourishment. They are fewer innumber (28), but have become increasingly common.Regula<strong>to</strong>ry agencies typically prefer soft shoreprotection solutions since they are less permanent<strong>and</strong> typically cause fewer impacts <strong>to</strong> the shore.The growing number of docks <strong>and</strong> piersin <strong>Pleasant</strong> <strong>Bay</strong> was a major impetusfor the <strong>Bay</strong>’s designation as an ACEC<strong>and</strong> the subsequent developmen<strong>to</strong>f a resource management plan forthe <strong>Bay</strong>. In an effort <strong>to</strong> assist <strong>to</strong>wnsaround the <strong>Bay</strong> in developing specificregula<strong>to</strong>ry or bylaw changes relative<strong>to</strong> the permitting of docks, piers,walkways <strong>and</strong> stairways, the <strong>Pleasant</strong><strong>Bay</strong> <strong>Resource</strong> Management Allianceissued <strong>Guide</strong>lines <strong>and</strong> PerformanceSt<strong>and</strong>ards for Permitting Docks <strong>and</strong> Piersin <strong>Pleasant</strong> <strong>Bay</strong> in 1999 <strong>and</strong> <strong>Guide</strong>linesfor Private Walkways <strong>and</strong> Stairways inFresh <strong>and</strong> Marine <strong>Resource</strong> Areas in<strong>Pleasant</strong> <strong>Bay</strong> in 2002. These documentsrecommend design criteria <strong>and</strong>performance st<strong>and</strong>ards for constructionof these structures in order <strong>to</strong> minimizeFiber rolls, considered a “soft solution,” can be covered over with vegetation <strong>to</strong> res<strong>to</strong>re a naturalappearance <strong>and</strong> functioning of a coastal bank. Pho<strong>to</strong>: Kristin Andres 18<strong>Pleasant</strong> <strong>Bay</strong> Alliance 2011
<strong>Coastal</strong> <strong>Resource</strong> <strong>Guide</strong> for <strong>Pleasant</strong> <strong>Bay</strong> <strong>and</strong> <strong>Chatham</strong> HarborA small s<strong>to</strong>ny beach at the base of this rock revetment leaves littleadjacent sediment supply <strong>to</strong> fronting fringe marsh. Pho<strong>to</strong>: KristenAndres.Gabions (wire boxes filled with rocks) can absorb wave energy <strong>and</strong>allow water <strong>to</strong> penetrate. Pho<strong>to</strong>: Kristin Andrestheir impacts <strong>to</strong> marine habitats, wildlife, fisheries, <strong>and</strong> marshes.The guidelines also encourage “shared-use” proposals (i.e., a singlestructure jointly owned <strong>and</strong> used by two or more property owners)<strong>to</strong> preserve access <strong>to</strong> the shore while reducing the overall numberof structures that might otherwise be permitted.5.3.1 Shorefront Protection StructuresHard shoreline structures, have increasingly been used <strong>to</strong> protectprivate property along the shore from s<strong>to</strong>rm damage that hasbeen amplified by changes associated with recent breaches ofthe Nauset Barrier Beach. These structures also can help stabilizeshorelines for water-dependent uses, such as bulkheads at the<strong>Chatham</strong> Fish Pier. Although shoreline protection structures protectharbor infrastructure <strong>and</strong> shoreline property, they can result inadverse impacts <strong>to</strong> coastal resources <strong>and</strong> public access. <strong>Coastal</strong>armoring with seawalls <strong>and</strong> revetments prevents the naturalerosion of coastal banks which provides sediment needed bybeaches, dunes, tidal flats, <strong>and</strong> salt marshes <strong>to</strong> maintain themselves<strong>and</strong> keep pace with rising sea level. Beach width <strong>and</strong> height aretypically reduced (“sediment starved”) downdrift of revetments<strong>and</strong> seawalls, weakening their s<strong>to</strong>rm damage prevention <strong>and</strong> floodcontrol functions (ultimately causing downdrift property owners <strong>to</strong>install similar protective structures). Waves striking hard structuresalso cause turbulence, which, in turn, may erode <strong>and</strong> lower theprofile of the beach fronting the seawall as well as adjacentbeaches. Some beaches near hard structures have become s<strong>to</strong>nierdue <strong>to</strong> the winnowing away of s<strong>and</strong>. Soft structures, while notas permanent as hard structures, provide similar protection fora limited period of time with significantly fewer environmentalimpacts. Although soft shore protection solutions may requiremore frequent maintenance <strong>to</strong> remain effective, they may be lesscostly than hard structures over the long term.less coastal armoring in Little <strong>Pleasant</strong> <strong>Bay</strong> where fetch distances,<strong>and</strong> thus wave energy, are less. Over 130 hard structures (105revetments, 27 bulkheads) were in place around the <strong>Bay</strong> in2007, only slightly more than the number of hard structures in1998 (Table 2). Hard structures are especially common along thewesternmost section of the <strong>Pleasant</strong> <strong>Bay</strong> shoreline (near RoundCove) where Route 28 parallels the shore, in Orleans near QuansetPond, <strong>and</strong> the <strong>Chatham</strong> shore opposite the 1987 inlet breach.The number of soft shoreline structures installed around the <strong>Bay</strong>increased significantly from five in 1998 <strong>to</strong> twenty-eight in 2007(Table 2), with most projects located along the south shore of<strong>Pleasant</strong> <strong>Bay</strong> <strong>and</strong> along adjoining embayments (e.g., Crows Pond,Ryders Cove <strong>and</strong> Bassing Harbor). State <strong>and</strong> local permittingagencies encourage the installation of soft structures where shoreprotection is needed, since they are generally less permanent<strong>and</strong> cause fewer adverse impacts <strong>to</strong> shore environments. Thepreference state <strong>and</strong> local permitting agencies have for soft shorestabilization techniques may be responsible for the increase innumber of these projects around the <strong>Bay</strong> over the last decade.Some projects identified as “soft” erosion control solutions (e.g.,fiber rolls) function in a way similar <strong>to</strong> a hard structure due <strong>to</strong>design or the need <strong>to</strong> be anchored in some way, <strong>and</strong> may result inimpacts similar <strong>to</strong> more permanent structures.Table 2. Erosion Control Structures on <strong>Pleasant</strong> <strong>Bay</strong>Orleans Brewster <strong>Chatham</strong> Harwich 2007 1998<strong>to</strong>tal <strong>to</strong>talBulkheads 10 - 14 3 27 25Revetments 25 1 64 15 105 103Soft Solutions 8 - 20 - 28 5Total Number 43 1 98 23 165 13319The distribution of hard coastal structures is controlled by l<strong>and</strong>development patterns <strong>and</strong> varying exposure <strong>to</strong> waves <strong>and</strong> tidesaround the <strong>Bay</strong> — see Map 4 Series. The majority of hardstructures are located on the western <strong>and</strong> southern margins of<strong>Pleasant</strong> <strong>Bay</strong> <strong>and</strong> areas of <strong>Chatham</strong> Harbor near the inlets, with<strong>Pleasant</strong> <strong>Bay</strong> Alliance 2011
<strong>Coastal</strong> <strong>Resource</strong> <strong>Guide</strong> for <strong>Pleasant</strong> <strong>Bay</strong> <strong>and</strong> <strong>Chatham</strong> HarborDocks extend below mean low water, which means they extend in<strong>to</strong> Commonwealth tidel<strong>and</strong>s where the public has access <strong>and</strong> usage rights.Pho<strong>to</strong>: Kristin Andres5.3.2 Piers <strong>and</strong> DocksPiers <strong>and</strong> docks are a critical part of the infrastructure of workingharbors, such as <strong>Chatham</strong> Harbor, <strong>and</strong> provide other commercial<strong>and</strong> recreational boaters easy access <strong>to</strong> their boats from theshore. When properly constructed, they allow boat owners <strong>to</strong>reach their vessels during all tides. They also provide a platformfor loading <strong>and</strong> offloading, <strong>and</strong> temporary s<strong>to</strong>rage space formarine supplies <strong>and</strong> equipment. Piers <strong>and</strong> docks can minimizedamage <strong>to</strong> the shore that would otherwise occur in their absenceby keeping boats, people, <strong>and</strong> other materials off sensitive coastalenvironments.Although most piers <strong>and</strong> docks are privately owned, they typicallyoccupy public waters <strong>and</strong> extend across l<strong>and</strong>s where the public hasaccess <strong>and</strong> usage rights.Docks <strong>and</strong> piers are common along most of the bay shorelineexcept for the Nauset barrier, <strong>Chatham</strong> Harbor shore, <strong>and</strong> the bayisl<strong>and</strong>s where these structures are few or non-existent. Docks <strong>and</strong>piers are especially common along The River, Crows Pond, RydersCove, <strong>and</strong> along the westernmost shore near Route 28. The 2008<strong>Pleasant</strong> <strong>Bay</strong> Management Plan identifies roughly 160 docks <strong>and</strong><strong>Pleasant</strong> <strong>Bay</strong> Alliance 2011piers in the management plan study area. These structures areshown on Map 5.As with other coastal structures, piers <strong>and</strong> docks may adverselyimpact sensitive coastal resources. For example, the installationof pilings supporting a pier or dock may alter water circulation,which may cause sediment erosion <strong>and</strong> scour. Marsh <strong>and</strong> eelgrassvegetation may be affected by shading caused by decking on apier. Stairways leading <strong>to</strong> piers <strong>and</strong> docks can have similar impacts<strong>to</strong> dune vegetation <strong>and</strong>/or potentially de-stabilize bank vegetation<strong>and</strong> soils. Benthic communities may also be affected by shading,especially by floats which cover a larger area. In addition, floatscan directly impact benthic marine organisms if they settle on thesubstrate at low tides. The leaching of wood preservatives (e.g.,wood treated with copper chromated arsenic, or CCA) from piers<strong>and</strong> docks in<strong>to</strong> the marine environment can have <strong>to</strong>xic effects onmarine organisms. In addition, the use of heavy equipment forinstalling coastal structures may have significant impacts on marineenvironments, potentially damaging valuable resources such asshellfish beds that may require years <strong>to</strong> recover, if ever.20
<strong>Coastal</strong> <strong>Resource</strong> <strong>Guide</strong> for <strong>Pleasant</strong> <strong>Bay</strong> <strong>and</strong> <strong>Chatham</strong> Harbor21Section 6<strong>Coastal</strong> Vulnerability6.1 PurposeThe purpose of this section is <strong>to</strong> explain the vulnerability ofnatural resources, coastal l<strong>and</strong>forms <strong>and</strong> human infrastructurein the <strong>Pleasant</strong> <strong>Bay</strong> system <strong>to</strong> the effects of coastal s<strong>to</strong>rm surge,flooding, erosion <strong>and</strong> sea level rise.6.2 <strong>Coastal</strong> VulnerabilityThe Barnstable County Pre-Disaster Mitigation Plan definesvulnerability as susceptibility <strong>to</strong> attack or injury by identifiedhazards. Vulnerability could be measured in terms of lossor private property, loss of tax base, or damage <strong>to</strong> publicinfrastructure. Hazard mitigation planning is a process ofassessing risks associated with hazards, <strong>and</strong> preparing strategies<strong>to</strong> minimize the impact or damage those hazards may cause.The county plan identifies the following potential hazards (inorder of priority): flooding, shoreline change (from sea level riseor s<strong>to</strong>rm induced), wildfire (following drought), snow <strong>and</strong> iceaccumulation, wind, drought, <strong>to</strong>rnado, earthquake. The planalso notes that climate change could increase the frequency orseverity of hazards, <strong>and</strong> should be considered in ongoing hazardmitigation planning.6.2.1 <strong>Coastal</strong> Flooding<strong>Coastal</strong> flooding represents a frequently occurring threat <strong>to</strong>natural resources <strong>and</strong> human infrastructure located within thevarious flood plains surrounding the <strong>Pleasant</strong> <strong>Bay</strong> estuary. Risingsea levels caused by global warming are projected <strong>to</strong> increasethe frequency <strong>and</strong> severity of damaging s<strong>to</strong>rm surges <strong>and</strong> coastalflooding. The creation of the new inlet in April 2007, hasresulted in increased tidal ranges throughout the <strong>Bay</strong>, <strong>and</strong> hashelped <strong>to</strong> amplify the combined impacts from increased s<strong>to</strong>rmfrequencies <strong>and</strong> severity. <strong>Pleasant</strong> <strong>Bay</strong> is susceptible <strong>to</strong> s<strong>to</strong>rmsurges from episodic s<strong>to</strong>rm events, such as large hurricanes, aswell as our more common winter “nor’easters”. Map 6 showsmajor s<strong>to</strong>rm <strong>and</strong> hurricane paths since 1900.Severe winter low-pressure systems (nor’easters) represent thegreatest coastal flooding threat <strong>to</strong> <strong>Pleasant</strong> <strong>Bay</strong>. This threatis exacerbated by the orientation of the two inlets relative <strong>to</strong>the northeast set of the s<strong>to</strong>rm waves, <strong>and</strong> due <strong>to</strong> the relativelyslow rate of speed at which these systems move. During theses<strong>to</strong>rm events, water is forced in<strong>to</strong> the <strong>Pleasant</strong> <strong>Bay</strong> system fromlarge s<strong>to</strong>rm driven waves, which increase normal tidal height.Persistent s<strong>to</strong>rm waves restrict the discharge of water from the<strong>Bay</strong> on outgoing tidal cycles, <strong>and</strong> effectively trap water withinthe system. When these low-pressure s<strong>to</strong>rm systems stall, asoften happens, they can impact the area over multiple tidalcycles. Each successive tidal cycle is amplified by water alreadytrapped in the <strong>Bay</strong>, <strong>and</strong> results in repetitive s<strong>to</strong>rm surges during as<strong>to</strong>rm event.Currently most coastal floodplain regulations <strong>and</strong> planningefforts are based upon the Federal Management Agency (FEMA)Section HighlightsThe shoreline <strong>and</strong> low lying upl<strong>and</strong>s surrounding<strong>Pleasant</strong> <strong>Bay</strong> <strong>and</strong> <strong>Chatham</strong> Harbor are vulnerable <strong>to</strong>damage caused by s<strong>to</strong>rm-induced flooding, surge, <strong>and</strong>erosion. These conditions <strong>and</strong> the resulting impactscould be worsened as sea level rises over the comingdecades as predicted.Vulnerability is measurable in terms of loss of naturalresources, habitat, <strong>and</strong> coastal l<strong>and</strong>forms that createour coastal l<strong>and</strong>scape <strong>and</strong> buffer <strong>and</strong> help <strong>to</strong> protectthe shoreline. It is also measurable in terms of lossof property, public access <strong>to</strong> the shoreline, <strong>and</strong>infrastructure.Further study <strong>to</strong> underst<strong>and</strong> how sea level rise couldalter Cape Cod’s shoreline <strong>and</strong> possible ways of adaptingis advisable, but is outside the scope of this <strong>Guide</strong>. Inthe interim, communities can take steps <strong>to</strong> mitigatecoastal hazards. These steps include acquiring orprotecting coastal property <strong>to</strong> allow for inl<strong>and</strong> migrationof wetl<strong>and</strong>s, relocating valuable infrastructure, <strong>and</strong>removing unnecessary coastal armoring.Flood Insurance Rate Maps (FIRM) or Flood Hazard BoundaryMap. These maps identify geographic areas, called flood zones,according <strong>to</strong> varying levels of flood risk. Each zone reflects theseverity or type of flooding in the area. FEMA has developed theseFIRM maps for all coastal communities in the United States.FEMA A zones are areas with a 1% annual chance of flooding <strong>and</strong>a 26% chance of flooding over the life of a 30-year mortgage.Because detailed analyses are not performed for such areas, nodepths or base flood elevations are shown within these zones.FEMA V zones are coastal areas with a 1% or greater chance offlooding <strong>and</strong> an additional hazard associated with s<strong>to</strong>rm waves.These areas have a 26% chance of flooding over the life of a 30-year mortgage. No base flood elevations are shown within thesezones.Map 7 shows the location of A <strong>and</strong> V zones in <strong>Pleasant</strong> <strong>Bay</strong> <strong>and</strong><strong>Chatham</strong> Harbor. The map also illustrates areas of repetitive lossclaims from the federal flood insurance program.All coastal flood plains surrounding <strong>Pleasant</strong> <strong>Bay</strong> <strong>and</strong> <strong>Chatham</strong>Harbor will see increased flood levels over time, <strong>and</strong> planningfor future coastal flooding will require new methods <strong>and</strong>metrics. Present flood hazard maps <strong>and</strong> flood plain planning <strong>and</strong>management concepts will prove ineffective if they do not<strong>Pleasant</strong> <strong>Bay</strong> Alliance 2011
<strong>Coastal</strong> <strong>Resource</strong> <strong>Guide</strong> for <strong>Pleasant</strong> <strong>Bay</strong> <strong>and</strong> <strong>Chatham</strong> Harboraccount for sea level rise. FEMA FIRM maps do not account foranticipated sea level rise, <strong>and</strong> are frequently based on decadesold flood studies. <strong>Pleasant</strong> <strong>Bay</strong> communities will need <strong>to</strong> developadditional <strong>to</strong>ols <strong>to</strong> help them plan for future flooding <strong>and</strong>conduct risk assessments for public <strong>and</strong> private infrastructure <strong>and</strong>natural resources. The continued study <strong>and</strong> moni<strong>to</strong>ring of localtidal regimes within the <strong>Pleasant</strong> <strong>Bay</strong> system is essential for thedevelopment of future flood hazard mapping <strong>and</strong> risk assessment.Other <strong>to</strong>ols, including airborne Light Detection <strong>and</strong> Ranging(LIDAR) used <strong>to</strong> delineate coastal <strong>to</strong>pography (i.e., l<strong>and</strong> elevation)with high precision; accurate bay-wide bathymetry maps <strong>and</strong>sophisticated dynamic computer models will also be necessary forthe development of predictive flood hazard data.While all floodplains will continue <strong>to</strong> be affected by coastalflooding, areas most vulnerable <strong>to</strong> coastal flooding are locatedwithin the FEMA mapped flood zones closest <strong>to</strong> the two inlets.Over time, future flood hazards will be better unders<strong>to</strong>od for allareas of the <strong>Pleasant</strong> <strong>Bay</strong> system, <strong>and</strong> communities can develop<strong>and</strong> implement appropriate hazard management measures.6.2.2 Shoreline Change from Erosion <strong>and</strong> Sea LevelRise<strong>Coastal</strong> erosion is another response <strong>to</strong> increased tidal ranges, risingsea level <strong>and</strong> increased s<strong>to</strong>rm frequency <strong>and</strong> severity. Erosion is aprocess that provides sediments <strong>to</strong> adjacent dunes, beaches <strong>and</strong>marshes within the lit<strong>to</strong>ral system. Erosion is a process that occursin nature. However, the natural rate or pattern of erosion maybe influenced by coastal armoring or other human activity thatinterferes with the natural movement of sediments. The rate ofsea level rise also may expedite the process of erosion.A fuller picture of the effects of SLR in <strong>Pleasant</strong> <strong>Bay</strong> <strong>and</strong> <strong>Chatham</strong>Harbor would require further data collection <strong>and</strong> analysis. In thefuture, this degree of detailed analysis may be warranted <strong>to</strong> guidelocal planning <strong>and</strong> management responses. At this time thereare general strategies for preparing for sea level rise that could beconsidered. These include:• Acquiring coastal property <strong>to</strong> protect access, reduce property<strong>and</strong> infrastructure damage <strong>and</strong> improve the functioning ofcoastal processes;• Relocating vulnerable infrastructure;• Removing unnecessary, dangerous or damaging coastalarmoring;• Developing improved regulations <strong>to</strong> protect coastal systems <strong>and</strong>beaches;• Encouraging l<strong>and</strong>owners <strong>to</strong> obtain conservation easements forunarmored bluffs that provide sediment <strong>to</strong> down drift beaches(Theiler, 2009).Some areas of <strong>Pleasant</strong> <strong>Bay</strong> <strong>and</strong> <strong>Chatham</strong> Harbor, particularlyin the vicinity of the 1987 <strong>and</strong> 2007 inlets, have experiencedsignificant erosion. The areas currently experiencing the mosterosion are located on the east facing <strong>Chatham</strong> shorelineopposite the 2007 inlet, as well as most other unarmored eastfacing properties throughout the <strong>Bay</strong>. The primary managementresponse <strong>to</strong> coastal erosion has been an increase in coastal erosioncontrol structures though out the <strong>Bay</strong> (see Section 5). Many <strong>to</strong>wnl<strong>and</strong>ings have lost significant areas of beach over recent years.Some of <strong>Chatham</strong>’s <strong>to</strong>wn l<strong>and</strong>ings, such as Scatteree <strong>and</strong> StrongIsl<strong>and</strong> Road, have required regular s<strong>and</strong> nourishment as a resul<strong>to</strong>f erosion. Much of Jacknife Beach in <strong>Chatham</strong> has been lost <strong>to</strong>erosion, <strong>and</strong> the parking lot experiences frequent flooding.Sea Level Rise (SLR) will continue <strong>to</strong> be a fac<strong>to</strong>r in shoreline changecaused by flooding <strong>and</strong> s<strong>to</strong>rm surges as well as coastal erosion.The effects of rising sea level can be magnified by human actionssuch as coastal armoring. Recent reports suggest that sea level willrise by approximately one meter by 2100. This degree of change,coupled with increased potential for s<strong>to</strong>rm surge, would beexpected <strong>to</strong> have significant effects such as loss of coastal habitats<strong>and</strong> resources, increased coastal erosion, loss of recreationalresources such as beaches <strong>and</strong> marshes, salt-water intrusion in<strong>to</strong>wells <strong>and</strong> septic systems, elevated s<strong>to</strong>rm surge levels, <strong>and</strong> morefrequent coastal inundation (Theiler, 2009).22<strong>Pleasant</strong> <strong>Bay</strong> Alliance 2011
<strong>Coastal</strong> <strong>Resource</strong> <strong>Guide</strong> for <strong>Pleasant</strong> <strong>Bay</strong> <strong>and</strong> <strong>Chatham</strong> HarborSection 7Natural <strong>Resource</strong>s237.1 PurposeThe purposes of this section are <strong>to</strong> briefly describe the region’sglacial his<strong>to</strong>ry <strong>and</strong> sediment regime, <strong>and</strong> <strong>to</strong> illustrate the breadth ofnatural resources in the <strong>Pleasant</strong> <strong>Bay</strong> system, including the currentstatus of water quality in the <strong>Bay</strong>.7.2 MethodologyNarratives describing the <strong>Bay</strong>’s diverse natural resources are basedon previous scientific studies <strong>and</strong> resource management plansfor the <strong>Bay</strong>, as well as information from local <strong>to</strong>wn officials. GISdata depicting wildlife habitats was supplemented by informationfrom Mass Audubon staff familiar with the <strong>Bay</strong>. Water qualityinformation was derived from studies determining critical nitrogenloading thresholds. Robert Oldale’s 2001 publication describing thegeology of Cape Cod <strong>and</strong> the Isl<strong>and</strong>s provided useful informationabout the glacial his<strong>to</strong>ry <strong>and</strong> geology of the bay area.The location <strong>and</strong> distribution of natural resources in the <strong>Bay</strong> is basedon existing maps, Geographic Information System (GIS) data layers(including MORIS <strong>and</strong> ESI data layers), <strong>and</strong> local knowledge.<strong>Coastal</strong> wetl<strong>and</strong> resource areas (e.g., dune, salt marsh, etc.),eelgrass, fish <strong>and</strong> wildlife, <strong>and</strong> priority natural community typesare delineated by MORIS <strong>and</strong> ESI data mapping. MORIS, theMassachusetts Ocean <strong>Resource</strong> Information System, is an onlinemapping <strong>to</strong>ol created by Massachusetts Office of <strong>Coastal</strong> ZoneManagement (CZM) <strong>and</strong> the Massachusetts Office of GeographicInformation (MassGIS). MORIS can be used <strong>to</strong> search <strong>and</strong>display spatial data related <strong>to</strong> the Massachusetts coastal zone(e.g., eelgrass beds, coastal wetl<strong>and</strong>s, shore access points, etc.)on a backdrop of aerial pho<strong>to</strong>graphs. Environmental SensitivityIndex (ESI) maps delineate coastal resources that are at risk,including biological resources, in a geodatabase format. TheMassachusetts Environmental Sensitivity Index Metadata (April2000) provides attribute definition <strong>and</strong> source information.7.3 Surficial GeologyThe type <strong>and</strong> distribution of natural resources in <strong>and</strong> around<strong>Pleasant</strong> <strong>Bay</strong> <strong>and</strong> <strong>Chatham</strong> Harbor are largely influenced bythe area’s Pleis<strong>to</strong>cene glacial his<strong>to</strong>ry <strong>and</strong> the diverse types <strong>and</strong>distribution of sediments deposited during this time. The surficialgeology of Cape Cod, including the <strong>Pleasant</strong> <strong>Bay</strong> area, owes itsorigin <strong>to</strong> the last continental glacier (Laurentide ice sheet) <strong>and</strong>the subsequent rise in sea-level. The dynamics <strong>and</strong> timing ofglaciation as well as the variety of deposits left by the glacier asit advanced <strong>and</strong> retreated over the l<strong>and</strong>scape of Cape Cod isdescribed in detail by Robert Oldale in his book Cape Cod, Martha’sVineyard & Nantucket: The Geologic S<strong>to</strong>ry (Oldale, 2001). Threebroad categories of glacial sediments were deposited during thePleis<strong>to</strong>cene epoch (10,000 years or older) on the Cape: glacialtill, glacial moraine deposits, <strong>and</strong> glacial stratified deposits (S<strong>to</strong>ne& DiGiacomo-Cohen, 2009). Glacial till consists of unsorted <strong>and</strong>unstratified sediments of various grain sizes (boulders, gravel,s<strong>and</strong>, silt, clay) deposited directly on bedrock by the glacier. GlacialSection Highlights<strong>Pleasant</strong> <strong>Bay</strong> supports a wide variety of inl<strong>and</strong> <strong>and</strong>coastal wetl<strong>and</strong> resources, fish <strong>and</strong> wildlife, <strong>and</strong> manyrare species <strong>and</strong> natural community types.<strong>Coastal</strong> <strong>and</strong> inl<strong>and</strong> wetl<strong>and</strong>s serve important publicinterests such as flood control, s<strong>to</strong>rm damageprevention, pollution prevention, <strong>and</strong> marine <strong>and</strong>terrestrial wildlife habitat.Approximately 1,400 acres of salt marsh <strong>and</strong> 225 acresof intertidal flats exist in the <strong>Bay</strong>. Several areas of saltmarsh <strong>and</strong> tidal flat in the <strong>Bay</strong> are identified as “Areasof Critical Marine Habitat” based on their habitat valuesfor coastal waterbirds, horseshoe crabs, <strong>and</strong> the rarediamondback terrapin.Over 1,800 acres of eelgrass beds occur in the <strong>Bay</strong>. Thesehighly productive subtidal communities provide feeding<strong>and</strong> nursery habitat for many marine species, includingmany commercially valuable finfish <strong>and</strong> shellfish species.Seven rare wildlife species have been documented usingbay habitats, including Piping Plover, Northern Harrier,<strong>and</strong> Diamondback terrapin. Many other rare speciesoccur within the study area.Nutrient impacts on <strong>Bay</strong> water quality have beenmoni<strong>to</strong>red since 2000, <strong>and</strong> data were used <strong>to</strong> identifythreshold limits for Total Nitrogen. Reductions in currentwatershed nitrogen load will be needed <strong>to</strong> maintain orres<strong>to</strong>re healthy water quality. Increased flushing fromthe 2007 inlet did not result in changes sufficient <strong>to</strong>mitigate the effects of watershed nitrogen loading.moraine deposits are similarly unsorted <strong>and</strong> unstratified, s<strong>and</strong>ysediments with coarser materials including boulders. Morainedeposits accumulated in ice-walled lakes <strong>and</strong> streams <strong>and</strong> onstagnant, buried ice in front of the receding edge of the ice sheet.Glacial stratified deposits are layered, well-sorted <strong>to</strong> poorlysortedgravel, s<strong>and</strong>, silt <strong>and</strong> clay laid down by flowing meltwaterin glacial streams <strong>and</strong> lakes in front of the retreating ice margin(identified as “coarse” in Map 9). The glacial stratified depositson Cape Cod (e.g., Harwich outwash plain deposits) are the mostextensive in Massachusetts. These broad, gently sloping plainsare sometimes pitted, forming dry depressions or kettle pondswhere the depressions intersect groundwater. Less common areglacial lake sediments composed of gravelly s<strong>and</strong>, silt <strong>and</strong> claythat were deposited in lakes impounded by glacial ice (identifiedas “glaciolacustrine fine” in Map 9). The diverse sedimenttypes deposited by the Laurentide ice sheet comprise the parentmaterials of the Cape’s modern sedimentary environments. Risingsea-levels reworked the glacial sediments forming beaches, dunes<strong>Pleasant</strong> <strong>Bay</strong> Alliance 2011
<strong>Coastal</strong> <strong>Resource</strong> <strong>Guide</strong> for <strong>Pleasant</strong> <strong>Bay</strong> <strong>and</strong> <strong>Chatham</strong> Harbor<strong>and</strong> marshes during the Holocene epoch (post-glacial, less than10,000 years old). Bedrock is not exposed on the Cape due <strong>to</strong> thethick layer of glacial sediments.The distribution <strong>and</strong> types of surficial geologic deposits around<strong>Pleasant</strong> <strong>Bay</strong> is shown on the U.S. Geological Survey’s <strong>Chatham</strong><strong>and</strong> Orleans geologic quadrangle maps (Map 9) (S<strong>to</strong>ne &DiGiacomo-Cohen, 2009). Glacial stratified deposits (“coarse”)comprise almost all of the upl<strong>and</strong>s (not including Nauset Beach)surrounding the <strong>Pleasant</strong> <strong>Bay</strong> <strong>and</strong> <strong>Chatham</strong> Harbor. This map unitconsists of stratified s<strong>and</strong> <strong>and</strong> gravel deposits laid down in variousdepositional environments in front of the retreating ice margin(e.g., meltwater stream, lake deltas, etc.). The sediment layersmay be poorly sorted in gravel deposits <strong>to</strong> well-sorted in s<strong>and</strong> <strong>and</strong>gravel deposits, with faulted bedding due <strong>to</strong> post-depositionalcollapse.Post-glacial deposits in the region surrounding <strong>Pleasant</strong> <strong>Bay</strong> <strong>and</strong><strong>Chatham</strong> Harbor include beaches, dunes, salt marshes, freshwaterswamp <strong>and</strong> marsh deposits, as well as artificial fill. Beaches aretypically linear, narrow deposits of s<strong>and</strong> <strong>and</strong> fine gravel reworkedby waves <strong>and</strong> currents. The texture of beach deposits varies locally<strong>and</strong> is generally controlled by the sediment composition of nearbyglacial materials eroded by wave action. Dunes are wind-depositeds<strong>and</strong>s <strong>and</strong> granules derived from beaches, which may consist ofcross-bedded deposits up <strong>to</strong> 100 feet thick. Nauset Beach <strong>and</strong>North Beach Isl<strong>and</strong> are composed of beaches <strong>and</strong> extensive dunes,with localized areas of s<strong>to</strong>rm beach deposits (e.g., overwash fans,channels) consisting of s<strong>and</strong> <strong>and</strong> gravel deposited by high energys<strong>to</strong>rm waves. Beach <strong>and</strong> dune deposits may also include artificials<strong>and</strong> deposits from locally-replenished beaches. Swamp <strong>and</strong> marshdeposits are composed of decaying marine grasses <strong>and</strong> vegetationwith varying amounts of fine marine sediments. These olderpeat deposits are overlain by live marine <strong>and</strong> brackish wetl<strong>and</strong>vegetation. Swamp <strong>and</strong> marsh deposits occur locally on barrierbeaches where depressions intersect groundwater. Cranberry bogsexist locally in low-lying upl<strong>and</strong> areas. Artificial fill occurs alongthe shoreline (e.g., beneficial re-use of dredged materials on <strong>to</strong>wnbeaches).7.4 <strong>Coastal</strong> Wetl<strong>and</strong> <strong>Resource</strong>sSeveral coastal wetl<strong>and</strong> resource areas, as defined by theMassachusetts Wetl<strong>and</strong>s Protection Act (MWPA) (M.G.L. c. 131,s. 40) <strong>and</strong> its Regulations (310 CMR 10.00), occur in <strong>Pleasant</strong> <strong>Bay</strong>including: Salt Marsh, Barrier Beach, <strong>Coastal</strong> Beach, <strong>Coastal</strong> Dune, 7.4.2 Marine <strong>and</strong> Estuarine Wetl<strong>and</strong>s<strong>Coastal</strong> Bank, <strong>and</strong> other l<strong>and</strong>s subject <strong>to</strong> tidal flow (Map 10 <strong>and</strong> Marine <strong>and</strong> estuarine wetl<strong>and</strong>s include non-vegetated flats (tidalTable 3). The MWPA protects wetl<strong>and</strong>s <strong>and</strong> the public interests flats) <strong>and</strong> vegetated, tidal wetl<strong>and</strong>s. Non-vegetated flats arethey serve, including flood control, prevention of pollution composed of various combinations of s<strong>and</strong>, silt <strong>and</strong> clay (Tiner,<strong>and</strong> s<strong>to</strong>rm damage, <strong>and</strong> protection of public <strong>and</strong> private 2010). Some flats are colonized by algae, while shallow estuarinewater supplies, groundwater supply, fisheries, l<strong>and</strong> containing waters in the <strong>Bay</strong> support extensive beds of eelgrass. Tidal wetl<strong>and</strong>sshellfish, <strong>and</strong> wildlife habitat. For example, <strong>Coastal</strong> Beach is include salt marshes <strong>and</strong> brackish marshes, which are salinitysignificant <strong>to</strong> the interests of s<strong>to</strong>rm damage prevention, flood dependent. Salt marshes develop closest <strong>to</strong> the ocean wherecontrol, <strong>and</strong> the protection of wildlife. Salt Marshes are also salinities are highest, while brackish marshes form along tidal riverssignificant <strong>to</strong> the protection of s<strong>to</strong>rm damage prevention <strong>and</strong> <strong>and</strong> streams where salt water is significantly diluted by fresh water.wildlife habitat, but also <strong>to</strong> the protection of marine fisheries,shellfish, the prevention of pollution, <strong>and</strong> groundwater supply.These public interests are protected by requiring a carefulreview of proposed work that may alter these wetl<strong>and</strong>s. The 24<strong>Pleasant</strong> <strong>Bay</strong> Alliance 2011law protects not only wetl<strong>and</strong>s, but other coastal resourceareas, such as L<strong>and</strong> Subject <strong>to</strong> <strong>Coastal</strong> S<strong>to</strong>rm Flowage (100-yearcoastal floodplain), the Riverfront Area (Rivers Protection Act),<strong>and</strong> L<strong>and</strong> Under Salt Ponds, L<strong>and</strong> Under the Ocean, <strong>and</strong> fishruns. Several tidal or salt ponds exist in the study area, includingRound Cove in Harwich, Crows Pond in <strong>Chatham</strong>, <strong>and</strong> QuansetPond, Arey’s Pond, <strong>and</strong> Kescayogansett (Lonnie’s) Pond in Orleans.Freshwater wetl<strong>and</strong>s <strong>and</strong> water bodies that outflow in<strong>to</strong> <strong>Pleasant</strong><strong>Bay</strong>, as well as isolated wetl<strong>and</strong>s located on coastal l<strong>and</strong>forms(Nauset Beach), also occur within the study area. These includehydrologically-connected lakes <strong>and</strong> ponds <strong>and</strong> their borderingfreshwater wetl<strong>and</strong>s, vernal pools, bogs, shrub swamps, woodedswamps, <strong>and</strong> freshwater seeps. These wetl<strong>and</strong>s are similarlyprotected by the MWPA <strong>and</strong> its regulations under several wetl<strong>and</strong>resource area types: Bordering Vegetated Wetl<strong>and</strong>s, Bank, L<strong>and</strong>Under Water Bodies <strong>and</strong> Waterways, L<strong>and</strong> Subject <strong>to</strong> Flooding, <strong>and</strong>Riverfront Area.Activities within the above wetl<strong>and</strong> resource areas are also strictlyregulated by local <strong>and</strong> federal wetl<strong>and</strong> protection laws <strong>and</strong>regulations. Activities undertaken within 100 feet of wetl<strong>and</strong>slocated within the state-designated ACEC are subject <strong>to</strong> the higherst<strong>and</strong>ard of “no adverse effect.” Local wetl<strong>and</strong> bylaws for <strong>to</strong>wnsbordering the <strong>Bay</strong> may extend wetl<strong>and</strong> protections further thanstate or federal regulations.7.4.1 Beaches, Dunes <strong>and</strong> <strong>Coastal</strong> BanksNauset Beach, the most prominent coastal l<strong>and</strong>form in the <strong>Pleasant</strong><strong>Bay</strong> area, is a barrier beach consisting of coastal beach <strong>and</strong> extensivecoastal dune resource areas. Smaller barrier beaches exist elsewherearound the <strong>Bay</strong>, extending downdrift of headl<strong>and</strong>s (e.g., StrongIsl<strong>and</strong>) <strong>and</strong> protecting small coves <strong>and</strong> marshes. <strong>Coastal</strong> beachesbacked by coastal banks composed of glacial sediments (<strong>and</strong>sometimes associated with small, linear dunes or fringing salt marsh)form much of the shoreline on the western side of the <strong>Bay</strong>. Wherecoastal banks are actively eroding, they provide sediment <strong>to</strong> thecoastal system, allowing beaches, marshes <strong>and</strong> flats <strong>to</strong> accrete <strong>and</strong>keep pace with ongoing sea-level rise. Eroding banks also providenesting sites for some bird species (e.g., bank swallow, beltedkingfisher). Where coastal structures such as seawalls or revetmentsexist, beach <strong>and</strong> dune environments are typically narrower unlessthe shore has been re-nourished.
<strong>Coastal</strong> <strong>Resource</strong> <strong>Guide</strong> for <strong>Pleasant</strong> <strong>Bay</strong> <strong>and</strong> <strong>Chatham</strong> HarborTable 3. <strong>Coastal</strong> Wetl<strong>and</strong> <strong>Resource</strong> Areas <strong>and</strong> Freshwater Wetl<strong>and</strong>s in the <strong>Pleasant</strong> <strong>Bay</strong> Study AreaWetl<strong>and</strong><strong>Resource</strong> TypeAcreage(2007) Interests Protected by Wetl<strong>and</strong> <strong>Resource</strong> Type<strong>Coastal</strong> Bank 96 S<strong>to</strong>rm damage prevention, flood control<strong>Coastal</strong> Beach 113 S<strong>to</strong>rm damage prevention, flood control, wildlife habitat<strong>Coastal</strong> Dune 85Rocky Intertidal Shore 1 S<strong>to</strong>rm damage prevention, flood control, marine fisheries, wildlife habitat, shellfishSalt Marsh1,391 Marine fisheries, wildlife habitat, shellfish, prevention of pollution, s<strong>to</strong>rm damage prevention,groundwater supplyTidal flat 225 Marine fisheries, wildlife habitat, shellfishBarrier Beach System 41 S<strong>to</strong>rm damage prevention, flood control, wildlife habitat, marine fisheries, wildlife habitat,shellfishBarrier Beach-<strong>Coastal</strong> Beach 259Barrier Beach-<strong>Coastal</strong> Dune 650Wooded swamp – deciduous trees 116 Public/private water supply, groundwater supply, flood control, s<strong>to</strong>rm damage prevention,Wooded swamp – coniferous trees 38 pollution prevention, fisheries, <strong>and</strong> wildlife habitat. (Interests served by Bordering VegetatedWooded swamp – mixed trees 41 Wetl<strong>and</strong>s, which includes wet meadows, marshes, swamps <strong>and</strong> bogs.)Shrub swamp 264Shallow marsh, meadow or fen 48Deep marsh 20Cranberry bog 59Bog 425Salt MarshesApproximately 1,400 acres of salt marsh occur in <strong>Pleasant</strong> <strong>Bay</strong>,making these the most abundant <strong>and</strong> widespread coastal wetl<strong>and</strong>resource areas in the Atlas area. Hundreds of acres of salt marshborder the l<strong>and</strong>ward margin of the Nauset barrier, with the mostextensive marshes occurring in Little <strong>Pleasant</strong> <strong>Bay</strong> in the vicinity ofPochet, Sampson, <strong>and</strong> Hog Isl<strong>and</strong>s. Large areas of salt marsh alsoborder the tidal creek between Pochet Isl<strong>and</strong> <strong>and</strong> Pochet Neck <strong>and</strong>occur adjacent <strong>to</strong> Strong Isl<strong>and</strong> <strong>and</strong> just east of Little Sipson Isl<strong>and</strong>in <strong>Pleasant</strong> <strong>Bay</strong> (Sipson Meadow). Salt marshes are common insmall, protected inlets along the shore <strong>and</strong> fringe the edge of the<strong>Bay</strong> in low energy settings. Just over half of the 45-mile mainl<strong>and</strong>bay shoreline (i.e., not including the back-barrier margin of NausetBeach <strong>and</strong> North Beach Isl<strong>and</strong>) is fringed by salt marsh (Borrelli,2009). The comparatively smaller amount of fringing salt marshalong the mainl<strong>and</strong> shore of <strong>Chatham</strong> Harbor may be due <strong>to</strong> itsmore dynamic nature given its proximity <strong>to</strong> the 1987 <strong>and</strong> 2007inlets. A recent study of shoreline change in the <strong>Bay</strong> from 1868<strong>to</strong> 2005 using the marsh edge as a proxy for determining rates ofshoreline change found that the seaward margin of salt marsh iseroding around much of the <strong>Bay</strong> (See Section 2.3.3). Marsh edgeaccretion was documented only on the isl<strong>and</strong>s <strong>and</strong> along the bayside of Nauset Beach due <strong>to</strong> salt marsh development on washoverfans <strong>and</strong> subtidal shoals.Salt marshes are highly productive coastal wetl<strong>and</strong>s dominated bySpartina grasses that are comprised of three distinct zones: lowmarsh, high marsh, <strong>and</strong> the marsh border (Carlisle et al, 2002).Low marsh forms the seaward edge of the salt marsh <strong>and</strong> is usuallyflooded during every high tide <strong>and</strong> exposed at low tide. Smoothcordgrass (Spartina alterniflora), a tall salt-<strong>to</strong>lerant grass species,Salt marsh at Jackknife L<strong>and</strong>ing in <strong>Chatham</strong>. Pho<strong>to</strong> Credit: Carole Ridleyis the dominant plant growing in the low marsh. High marsh liesbetween the low marsh <strong>and</strong> marsh border, <strong>and</strong> is generally floodedonly during higher than average tides. Salt meadow hay (Spartinapatens), spike grass (Distichlis spicata), <strong>and</strong> black grass (Juncusgerardii) are the most common plant species comprising the highmarsh. A short form of smooth cordgrass may also be common inthis zone. Depressions, or pannes, in the high marsh hold waterfor extended periods, creating highly saline conditions that onlythe most salt <strong>to</strong>lerant plant species can withst<strong>and</strong>. High marshoccurs primarily in the upper sections of the <strong>Bay</strong> where areas of saltmarsh are more extensive, while fringing marshes along the lowerbay shoreline is typically low marsh. Large areas of high marsh inthe <strong>Bay</strong> were converted <strong>to</strong> low marsh between 1984 <strong>and</strong> 2000due <strong>to</strong> changes in tidal amplitude caused by inlet breaching <strong>and</strong>migration (Smith, 2009). However, there have been no net changesin marsh area within the <strong>Bay</strong>, <strong>and</strong> evidence of marsh dieback (e.g.,due <strong>to</strong> crab herbivory) has not been found. High marsh comprisesa relatively small amount of the overall area of salt marsh in the <strong>Bay</strong>(approximately 10%), with most of the remaining salt marsh aroundthe <strong>Bay</strong> being low marsh (Smith, 2010, Pers. Comm., 27 April).<strong>Pleasant</strong> <strong>Bay</strong> Alliance 2011
<strong>Coastal</strong> <strong>Resource</strong> <strong>Guide</strong> for <strong>Pleasant</strong> <strong>Bay</strong> <strong>and</strong> <strong>Chatham</strong> HarborThe marsh border along the upper edge of the salt marsh is onlyflooded during extreme astronomical tides or s<strong>to</strong>rm surges. Ahigher diversity of plants grows in this part of the marsh, includingboth herbaceous <strong>and</strong> woody plants such as high tide bush (Ivafrutescens), seaside goldenrod (Solidago sempervirens), <strong>and</strong> switchgrass (Panicum virgatum). Plants adapted <strong>to</strong> brackish conditionsoccur along the upper reaches of salt marshes <strong>and</strong> border tidalrivers <strong>and</strong> streams that discharge <strong>to</strong> the <strong>Bay</strong>.Tidal FlatsAlthough salt marsh is the most abundant intertidal habitat typein the <strong>Bay</strong>, other unvegetated intertidal environments (tidal flats)also exist including s<strong>and</strong> flat, mud flat, <strong>and</strong> cobble/pebble flats.Tidal flats reach their greatest extent in the upper reaches of the<strong>Bay</strong> between Sampson <strong>and</strong> Pochet Isl<strong>and</strong>s, <strong>and</strong> in the tidal inletbetween Pochet Isl<strong>and</strong> <strong>and</strong> Pochet Neck. Extensive tidal flats alsooccur south of Strong Isl<strong>and</strong>, in <strong>Chatham</strong> Harbor in the vicinityof Tern Isl<strong>and</strong>, <strong>and</strong> bordering some sections of the bay shore ofNauset Beach. The grain size composition of tidal flats is controlledprimarily by the velocity of tidal currents. Mudflats develop inlower energy settings such as small, protected coves in the upperbay, while s<strong>and</strong> flats occur in areas of high tidal current velocitynear barrier beach inlets <strong>and</strong> channels. The net transport of s<strong>and</strong>grains on a s<strong>and</strong> flat in any one direction is small because of theoscilla<strong>to</strong>ry nature of the tidal currents.The salt marshes <strong>and</strong> tidal flats in several parts of the <strong>Bay</strong> wereidentified in the <strong>Pleasant</strong> <strong>Bay</strong> <strong>Resource</strong> Management Plan as Areasof Critical Marine Habitat based on their significant habitat values(e.g., feeding <strong>and</strong> roosting areas for coastal waterbirds, habitatfor horseshoe crabs, diamondback terrapin, etc.) These areas(numbers correspond <strong>to</strong> areas shown on Map 11) include:#1• The intertidal zone <strong>and</strong> tidal flats north of Tern Isl<strong>and</strong>, south ofMinister’s Point, <strong>and</strong> west of the channel.#2• The intertidal zone <strong>and</strong> tidal flats surrounding the east, west<strong>and</strong> south sides of Strong Isl<strong>and</strong>.• The intertidal area of Nickerson’s Neck from the Strong Isl<strong>and</strong><strong>to</strong>wn l<strong>and</strong>ing <strong>to</strong> the southeastern tip of Fox Hill <strong>and</strong> from the<strong>Chatham</strong> Yacht Club north <strong>to</strong> the 7 th tee of the Eastward Ho!Country Club.• The intertidal zone <strong>and</strong> flats west of Nauset Beach from the2007 inlet north <strong>to</strong> Broad Creek <strong>and</strong> Hog Isl<strong>and</strong> Creek, <strong>and</strong> thesouth side of Hog Isl<strong>and</strong> <strong>and</strong> the west side of Sampson Isl<strong>and</strong> <strong>to</strong>its northern tip.• The intertidal zone from the southwest end of the Narrows (justnorthwest of Sipson Isl<strong>and</strong>) <strong>to</strong> the eastern end of the Winslowrevetment, <strong>and</strong> the intertidal zone <strong>and</strong> flats surrounding LittleSipson Isl<strong>and</strong>.• The intertidal zone along south shore of Barley Neck.Submerged eelgrass in <strong>Pleasant</strong> <strong>Bay</strong>. Pho<strong>to</strong>: Cape Cod CooperativeExtension/Woods Hole Sea Grant#3• The intertidal zone from in Little <strong>Pleasant</strong> <strong>Bay</strong> from NamequoitPoint west <strong>to</strong> the entrance of Pah Wah Pond.• The intertidal zone from the conservation property on the southside of Kent’s Point, <strong>and</strong> along both sides of The River <strong>to</strong> Meetinghouse Pond (including Frost Fish Cove).Eelgrass BedsEelgrass beds are highly productive, subtidal plant communitiesthat provide nursery <strong>and</strong>/or feeding habitat for many fish,waterfowl <strong>and</strong> invertebrate species (Costa, undated). Loss ofeelgrass can result in significant shifts in marine fauna, includingcommercial <strong>and</strong> recreational species. The degradation of eelgrassbeds in the 1930s from an outbreak of wasting disease causedbay scallop s<strong>to</strong>cks <strong>to</strong> crash <strong>and</strong> brant geese population numbers<strong>to</strong> plummet. Because eelgrass grows underwater, these importanthabitats often go unnoticed except by boaters, shellfishermen,<strong>and</strong> divers. Eelgrass is highly sensitive <strong>to</strong> pollution (e.g., nitrogenloading) <strong>and</strong> serves as an ideal indica<strong>to</strong>r of water quality changes.Over 1,800 acres of eelgrass occurs in <strong>Pleasant</strong> <strong>Bay</strong>, reflecting thehigh habitat <strong>and</strong> water quality of areas within the <strong>Bay</strong> (Howes,et al 2006). Map 12 shows the distribution of eelgrass mappedduring 1995 <strong>and</strong> 2001 surveys. 1 The most extensive eelgrass bedsare located in Little <strong>Pleasant</strong> <strong>Bay</strong>, the central section of <strong>Pleasant</strong><strong>Bay</strong> around Sipson Isl<strong>and</strong> <strong>and</strong> west of Strong Isl<strong>and</strong>. Eelgrass bedsalso exist in the tidal creek between Sampson Isl<strong>and</strong> <strong>and</strong> BarleyNeck. Significant eelgrass habitat also exists in Bassing Harbor <strong>and</strong>the tidal river between Barley Neck <strong>and</strong> Pochet Isl<strong>and</strong> (althoughsome eelgrass in these areas was mapped only during the 1995survey). Smaller patches of eelgrass are scattered in the shallowsubtidal zone west of the Nauset Barrier Beach. Eelgrass coveragein the <strong>Bay</strong> has declined by approximately 24% over the last halfcentury (except <strong>Chatham</strong> Harbor) <strong>and</strong> the density of eelgrass inexisting beds may be thinning (Howes et al, 2006). Anecdotally,the health eelgrass beds appear <strong>to</strong> be increasing in Little <strong>Pleasant</strong><strong>Bay</strong>, possibly due <strong>to</strong> improved water quality (Farber, 2010, Pers.Comm., 7 February). However, the system-wide eelgrass decline inthe <strong>Bay</strong> is linked <strong>to</strong> environmental changes associated with nutrientenrichment (Howes et al, 2006).1 Eelgrass mapped during the 1995 survey but not during the 2001 survey may have disappeared, or may not have occurred in sufficient density <strong>to</strong> be mapped.26<strong>Pleasant</strong> <strong>Bay</strong> Alliance 2011
277.4.3 Freshwater Wetl<strong>and</strong>sFreshwater, or palustrine, wetl<strong>and</strong>s are characterized by trees,shrubs <strong>and</strong> persistent herbaceous plants, <strong>and</strong> include marshes,swamps, bogs <strong>and</strong> shallow open water bodies (ponds). Theboundary of the <strong>Pleasant</strong> <strong>Bay</strong> ACEC includes eleven freshwaterponds, each of which has a perennial hydrological connection <strong>to</strong>the <strong>Bay</strong>. Examples include Crystal Lake, Pilgrim Lake, <strong>and</strong> LittleQuanset Pond in Orleans, <strong>and</strong> Mill Pond, Stillwater Pond, <strong>and</strong> FoxPond in <strong>Chatham</strong>. A 2003 study documented exemplary sitesfor state <strong>and</strong> globally rare habitat (New Engl<strong>and</strong> <strong>Coastal</strong> PlainPond Shore Community <strong>and</strong> the Atlantic White Cedar SwampCommunity) among the freshwater pond shores within the ACEC(Horsley & Witten, 2003). In addition, the study found occurrencesof Plymouth gentian (Sabatia kennedyana) <strong>and</strong> slender arrowhead(Sagittaria teres) around pond shores, both of which are species ofSpecial Concern. Shrub swamps, wooded swamps (e.g., red mapleswamp), cranberry bogs, <strong>and</strong> other freshwater wetl<strong>and</strong> typesborder water bodies <strong>and</strong> waterways that discharge in<strong>to</strong> the <strong>Bay</strong>.A good example of these varied wetl<strong>and</strong> types exists along MuddyCreek. Dune swale wetl<strong>and</strong>s occur in depressions between s<strong>and</strong>dunes where the s<strong>and</strong>y soils are waterlogged due <strong>to</strong> seasonal highwater tables. Although scattered <strong>and</strong> relatively few in number,interdunal wetl<strong>and</strong>s are best developed on Nauset Beach. Marshes<strong>and</strong> shrub swamps are the most common wetl<strong>and</strong> types in thedune swales on Nauset Beach.7.5 Fish <strong>and</strong> Wildlife<strong>Pleasant</strong> <strong>Bay</strong>’s diverse coastal environments provide habitat for aremarkable array of fish <strong>and</strong> wildlife species. Contributing <strong>to</strong> the<strong>Bay</strong>’s biodiversity is its location near the intersection of two majorbiogeographic ocean regions, the Acadian <strong>and</strong> Virginian provinces,which are distinguished by marked differences in physicalcharacteristics, biological communities, <strong>and</strong> weather patterns.Resident <strong>and</strong> migra<strong>to</strong>ry species of finfish, shellfish, birds, reptiles,<strong>and</strong> mammals find feeding, resting, breeding, <strong>and</strong> nursery habitatin or around the <strong>Bay</strong>. Sensitive wildlife <strong>and</strong> wildlife habitats withinthe coastal zone include: shorebirds, seal haul-out sites, horseshoecrabs, anadromous fish runs, shellfish, <strong>and</strong> rare wildlife species(Maps 13 <strong>and</strong> 14).7.5.1 Birds<strong>Pleasant</strong> <strong>Bay</strong> provides habitat for a variety of migra<strong>to</strong>ry <strong>and</strong> yearroundshorebirds, coastal waterbirds, waterfowl, rap<strong>to</strong>rs, <strong>and</strong>songbirds, including several state <strong>and</strong> federally-listed rare species(Map 13 <strong>and</strong> 14). Common eiders, black ducks, brant <strong>and</strong> otherwaterfowl gather in large numbers in the relatively shelteredwaters of the <strong>Bay</strong>, especially during the winter. Sea ducks, such ascommon eiders <strong>and</strong> scoters, typically gather in greatest numbersin <strong>Chatham</strong> Harbor during this time of year. Snowy owls <strong>and</strong> twostate-listed rare bird species, short-eared owl <strong>and</strong> Northern harrier,use habitats on Nauset Beach during the winter.During the spring <strong>and</strong> summer, rare species such as piping plovers<strong>and</strong> common <strong>and</strong> least terns nest on Nauset Beach <strong>and</strong> NorthBeach Isl<strong>and</strong>. Piping plovers nest on the uppermost beach whileterns favor sparsely vegetated or unvegetated, s<strong>and</strong>y or gravellyareas for nesting. As the name suggests, least terns are the mostcommon nesting shorebird on Tern Isl<strong>and</strong>. Other bird species that<strong>Coastal</strong> <strong>Resource</strong> <strong>Guide</strong> for <strong>Pleasant</strong> <strong>Bay</strong> <strong>and</strong> <strong>Chatham</strong> HarborSeals are increasingly common in <strong>Pleasant</strong> <strong>Bay</strong> <strong>and</strong> <strong>Chatham</strong> Harbor.Pho<strong>to</strong>: Robert Prescott.nest in the area include American oystercatcher, which nests neardunes or the marsh edge on Monomoy <strong>and</strong> possibly on NausetBeach, <strong>and</strong> willets, which often nest on edge of the salt marsh.Extensive areas of high salt marsh in Little <strong>Pleasant</strong> <strong>Bay</strong> providenesting habitat for salt marsh sharp-tailed sparrows. Beltedkingfishers nest in eroding coastal banks on Sipson Isl<strong>and</strong>.Shorebirds, such as terns, feed in the <strong>Bay</strong>, tidal inlets, <strong>and</strong> shallow,coastal waters, while overwash fans (unvegetated expanses ofs<strong>and</strong> deposited by s<strong>to</strong>rm waves on the bayside of barrier beaches)provide optimal high tide roosting <strong>and</strong> loafing sites. The LittleSipson Isl<strong>and</strong> flats are rich with invertebrates (e.g., marine worms,crustaceans, etc.) <strong>and</strong> are important feeding habitat for migra<strong>to</strong>ry<strong>and</strong> nesting shorebirds, including red knot, short-billed dowitcher,<strong>and</strong> Hudsonian godwit. At high tide, shorebirds fly <strong>to</strong> roosts suchas Little Sipson Isl<strong>and</strong>, North Beach Isl<strong>and</strong>, Tern Isl<strong>and</strong>, <strong>and</strong> StrongIsl<strong>and</strong>. Many more shorebirds use the South Beach-Monomoycomplex <strong>to</strong> rest. Although only green herons nest on isl<strong>and</strong>s in theAtlas area, the isl<strong>and</strong>s provide important roost sites for great blueherons.7.5.2 Seal Haul-out SitesThe populations of gray seals <strong>and</strong> harbor seals are increasingin the Cape Cod region. Harbor seals are generally seasonalresidents <strong>and</strong> migrate north <strong>to</strong> breed in the summer. Gray sealsare now year-round residents on the Cape. The 2007 breachof the barrier beach in <strong>Chatham</strong> has afforded seals anotherentryway in<strong>to</strong> <strong>Pleasant</strong> <strong>Bay</strong> <strong>and</strong> <strong>Chatham</strong> Harbor. While the <strong>Bay</strong>attracts seals because of its good water quality <strong>and</strong> abundantfish, the overall numbers of seals in the study area are muchlower than populations elsewhere in the region (e.g., MonomoyIsl<strong>and</strong>, Muskeget Isl<strong>and</strong>). Seals currently use the flats south ofTern Isl<strong>and</strong> <strong>and</strong> the southern tip of North Beach Isl<strong>and</strong> as hauloutsites (Map 13). Both gray seals <strong>and</strong> harbor seals use thesehaul-out sites in winter, while only gray seals use the sites duringthe summer (Prescott, 2003, Pers. Comm., 18 April). Seals mayuse other locations in the <strong>Bay</strong> as seasonal haul-outs, such asephemeral shoals near the inlets that form <strong>and</strong> disappear <strong>and</strong>other areas where fish are concentrated (e.g., near fish runs). Theincreasing presence of gray seals year-round has attracted greatwhite sharks in recent years, a chief preda<strong>to</strong>r of this species in thewestern Atlantic Ocean. Shark sightings have been documented in<strong>Chatham</strong> Harbor on an infrequent basis.<strong>Pleasant</strong> <strong>Bay</strong> Alliance 2011
<strong>Coastal</strong> <strong>Resource</strong> <strong>Guide</strong> for <strong>Pleasant</strong> <strong>Bay</strong> <strong>and</strong> <strong>Chatham</strong> HarborThe Atlantic “blue-eyed”scallop. Pho<strong>to</strong>: Cape CodCooperative Extension/Woods Hole Sea Grant7.5.3 Anadromous Fish RunsFish runs provide passage for anadromous fishes (e.g., bluebackherring, alewife) between freshwater spawning sites <strong>and</strong> the oceanwhere adult fish spend their lives. Active anadromous fish runsin <strong>Pleasant</strong> <strong>Bay</strong> currently exist between Kescayogansett (Lonnie’s)Pond <strong>and</strong> Pilgrim Pond, <strong>and</strong> between Ryder’s Cove. Stillwater Pond<strong>and</strong> Lovers Lake (Map 13). Muddy Creek dividing <strong>Chatham</strong> <strong>and</strong>Harwich provides habitat for some catadramous fish such asAmerican eel.7.5.4 Shellfish <strong>and</strong> Horseshoe Crabs<strong>Pleasant</strong> <strong>Bay</strong> supports a variety of commercially important shellfishspecies, including quahogs, scallops <strong>and</strong> oysters. Areas of the<strong>Bay</strong> identified as suitable habitat for specific shellfish species areshown on Map 15. 2 Quahog <strong>and</strong> soft-shelled clam habitat occursalong the margins of large tidal creeks in upper Little <strong>Pleasant</strong><strong>Bay</strong>, shallow inlets <strong>and</strong> coves (Ryder’s Cove, Crows Pond), <strong>and</strong>elsewhere along the shallow margins of <strong>Pleasant</strong> <strong>Bay</strong>. Quahogharvests have fallen considerably since the mid-1980s. Possiblecauses include increased <strong>Bay</strong> salinity due <strong>to</strong> inlet breaching (<strong>and</strong>reduced freshwater flows), changes in allowable harvest size,<strong>and</strong> increase preda<strong>to</strong>r <strong>and</strong> pest populations. 3 Soft shell clamharvests, on the other h<strong>and</strong>, have been rising since 2002. Theincrease in razor clam harvesting in the <strong>Bay</strong> over the last decadeor so is possibly due <strong>to</strong> new harvesting techniques (“salting”) thatare driven by increased market dem<strong>and</strong> for this species. Fieldobservations have found an abundance of razor clam <strong>and</strong> soft-shellclam larvae in bay waters sufficient <strong>to</strong> sustain a relatively largeharvest. Habitat for blue mussels is located along the shallow bayshore margin of Nauset Beach in the vicinity of the 2007 inlet <strong>and</strong>just south of Tern Isl<strong>and</strong>.Although extensive areas of both <strong>Pleasant</strong> <strong>Bay</strong> <strong>and</strong> Little <strong>Pleasant</strong><strong>Bay</strong> are mapped as habitat for bay scallop, the local scallop harvesthas been almost non-existent since the productive harvests in 1983<strong>and</strong> 1984. The reasons for the dramatic decline in scallop over thelast two decades are unknown, though water quality degradation<strong>and</strong> the continued loss of eelgrass in the <strong>Bay</strong> are possiblecontribu<strong>to</strong>rs. In contrast, the local scallop harvest in 2009 was verygood (Farber, Murphy, Moore, 2010, Pers. Comm.). Improvementin bay water quality following the inlet breach in 2007 may havebenefited the local scallop fishery, but increased populationsthroughout the northeast suggest other, more regional causes forthe rebound.Eighteen private aquaculture grants currently exist in <strong>Pleasant</strong> <strong>Bay</strong>,all in the <strong>Town</strong> of Orleans. Oysters <strong>and</strong> quahogs are the primaryshellfish species being cultivated in the grant areas. Aquaculturebenefits the <strong>Bay</strong> in several ways, including enhancing spawningshellfish numbers, increasing overall shellfish productivity onpreviously unproductive flats, attenuating pollution (nitrogen) inthe <strong>Bay</strong>, <strong>and</strong> providing habitat (i.e., the shellfish gear) for juvenilefish <strong>and</strong> crustaceans. Aquaculture also generates local economicactivity.Horseshoe crabs, long considered <strong>to</strong> a threat <strong>to</strong> shellfishpopulations, are now recognized as a commercially <strong>and</strong> ecologicallyimportant species. <strong>Pleasant</strong> <strong>Bay</strong> supports a significant populationof actively spawning adult horseshoe crabs <strong>and</strong> providessubstantial feeding <strong>and</strong> nursery grounds for them (Carmichaelet al, 2003). The horseshoe crab spawning season on Cape Codextends from May <strong>to</strong> June, with spawning occurring on s<strong>and</strong>y,low energy estuarine beaches. The Little Sipson Isl<strong>and</strong> flats are animportant horseshoe crab spawning site as are s<strong>and</strong> flats east <strong>and</strong>south of Hog <strong>and</strong> Sampson Isl<strong>and</strong>s <strong>and</strong> overwash fans along thebayside of Nauset Beach (e.g., near Pochet Isl<strong>and</strong>). These sites in<strong>Pleasant</strong> <strong>Bay</strong>, along with Monomoy Isl<strong>and</strong>, have been identifiedas spawning hot spots on Cape Cod, <strong>and</strong> may be responsible forthe majority of the spawning that occurs on this part of the Cape.Following hatching, larvae <strong>and</strong> juveniles remain in the intertidalflats <strong>and</strong> subtidal areas near the breeding beaches (Smith et al,2009). The general migra<strong>to</strong>ry pattern of horseshoe crabs is thought<strong>to</strong> involve juveniles moving <strong>to</strong> deeper waters as they mature, <strong>and</strong>reaching sexual maturity either in the estuary or migrating further<strong>to</strong> mature in the ocean. Adults migrate annually from the ocean ordeep bay waters <strong>to</strong> spawn on estuarine beaches. Some adults mayoverwinter in embayments.Conservation <strong>and</strong> management of this species is controversialsince they are harvested for biomedical, scientific, <strong>and</strong> baitpurposes. Concern about horseshoe crabs increased in the late1990s because of the increased harvest <strong>and</strong> the heightenedawareness of the critical ecological relationship between thisspecies <strong>and</strong> migra<strong>to</strong>ry shorebirds in Delaware <strong>Bay</strong> (many shorebirdsfeed almost exclusively on horseshoe crab eggs). It is not knownhow many shorebirds on Cape Cod use horseshoe crab eggsas a food resource, although migrating shorebirds s<strong>to</strong>pping atMonomoy Isl<strong>and</strong> are known <strong>to</strong> consume them (James-Pirri et al,2007). The <strong>to</strong>tal <strong>Pleasant</strong> <strong>Bay</strong> harvest in 2001 accounted for themortality of ~1-2% of the adult population, with the biomedicalharvest causing the great loss of horseshoe crabs since manymore crabs were harvested for this purpose than for other uses(Rutecki et al, 2004). Harvest mora<strong>to</strong>riums in the Delaware <strong>Bay</strong>states triggered increased harvesting elsewhere, including CapeCod. In response <strong>to</strong> increased l<strong>and</strong>ings on Cape Cod, the CapeCod National Seashore prohibited harvesting of horseshoe crabswithin their jurisdiction. The remaining waters on the Cape understate Division of Marine Fisheries jurisdiction are also closed <strong>to</strong> any2 Note: these areas include sites where shellfish have been recorded but may not currently support any shellfish; therefore, these maps represent potential habitat. Also,because of changing sediment <strong>and</strong> water quality conditions, areas supporting shellfish may exist in areas not identified on MassGIS maps.3 Quahog Parasite Unknown (QPX) is also a significant concern among shellfish managers but has only been observed in selected private grant areas in the northernportion of the <strong>Bay</strong>.28<strong>Pleasant</strong> <strong>Bay</strong> Alliance 2011
<strong>Coastal</strong> <strong>Resource</strong> <strong>Guide</strong> for <strong>Pleasant</strong> <strong>Bay</strong> <strong>and</strong> <strong>Chatham</strong> Harbor<strong>and</strong> the Isl<strong>and</strong>s harbor most of the state’s remaining nestingpopulations. Harriers may nest on Nauset Beach. Harriers huntalong the bayside of Nauset Beach during winter.Atlantic horseshoe crabs, Limulus polyphemus. Pho<strong>to</strong>: Ben Carrollharvest with the exception of a permit issued <strong>to</strong> a single harvesterfor biomedical purposes (Moore, 2010, Pers. Comm.).7.5.5 Rare Species <strong>and</strong> Priority Natural CommunityTypesBoth priority rare species habitat <strong>and</strong> estimated rare specieshabitat are found throughout the entire study area (Map16). 4 Many rare (state <strong>and</strong>/or federally listed) plant <strong>and</strong> animalspecies have been documented in the study area. Rare speciesknown <strong>to</strong> occur in <strong>Pleasant</strong> <strong>Bay</strong> include one Endangered species(Roseate Tern), three Threatened species (Piping Plover, NorthernHarrier, <strong>and</strong> Diamondback Terrapin), <strong>and</strong> three Special Concernspecies (Least Tern, Common Tern, <strong>and</strong> Arctic Tern). Rare speciesincluding plants, dragonflies/ damselflies, reptiles, <strong>and</strong> moths arealso associated with freshwater wetl<strong>and</strong>s in the study area. Tworare coastal plain pondshore plants, Plymouth gentian (Sabatiakennedyana) <strong>and</strong> slender arrowhead (Sagittaria teres), have beendocumented on freshwater ponds within the <strong>Pleasant</strong> <strong>Bay</strong> ACEC(Horsley & Witten, 2003). Both of these plants are classified by theMassachusetts Natural Heritage <strong>and</strong> Endangered Species Program(NHESP) as Species of Special Concern, <strong>and</strong> are found in muddy,s<strong>and</strong>y, or peaty soils in the shallow water margins of freshwaterponds.The following are brief profiles of each of the rarewildlife species found in the study area.Roseate Tern (Endangered) –disperse from breeding groundsin Buzzards <strong>Bay</strong> in mid <strong>to</strong> lateAugust <strong>and</strong> concentrate in stagingareas around Cape Cod, includingSouth Beach <strong>and</strong> increasingly onNorth Beach Isl<strong>and</strong>. Feed almostexclusively on small fish. Depart forwintering grounds in September.RoseateTern. Pho<strong>to</strong>: Ben CarrollNorthern Harrier (Threatened) – establish nesting <strong>and</strong> feedingterri<strong>to</strong>ries in wet meadows, grassl<strong>and</strong>s, <strong>and</strong> coastal <strong>and</strong> inl<strong>and</strong>marshes. Prey on rodents, rabbits <strong>and</strong> other small mammals, smallbirds, insects, amphibians, etc. The breeding season of Northernharriers extends from March <strong>to</strong> July in Massachusetts. Cape CodPiping Plover (Threatened)– arrive on nesting groundsin late March or April. Pipingplovers nest on Nauset Beach,Tern Isl<strong>and</strong>, <strong>and</strong> South Beach,often building their nestbetween the high tide line <strong>and</strong>the foot of the dunes. Youngchicks leave their nests withinhours of hatching <strong>and</strong> w<strong>and</strong>erhundreds of meters beforethey are capable of flight. Feed on mollusks, marine worms,crustaceans, <strong>and</strong> insects. Plovers migrate south between late July<strong>and</strong> early September, with occasional stragglers remaining until lateOc<strong>to</strong>ber.Least Tern, Common Tern, Arctic Tern (Special Concern) –Common terns arrive in late April or early May, while Least ternsarrive somewhat later (early May) <strong>and</strong> Arctic Terns later still (midMay). All species use s<strong>and</strong>y or gravelly areas with generally littleor no vegetation on isl<strong>and</strong>s <strong>and</strong>/or barrier beaches for nesting(e.g., Nauset Beach, South Beach, Tern Isl<strong>and</strong>). Terns feed onsmall fish such as s<strong>and</strong> lance, herring, minnows, etc., but also feedon crustaceans <strong>and</strong> insects. Disturbance by humans <strong>and</strong> dogs,preda<strong>to</strong>rs, <strong>and</strong> displacement by gulls are chronic managementissues. Arctic terns leave as soon as their young can fly (earlyAugust) for its wintering grounds near the Antarctic Circle.Common terns depart from nesting sites in July <strong>and</strong> August, <strong>and</strong>concentrate in “staging areas” around Cape Cod <strong>to</strong> feed beforemigrating south. Least terns depart by early September for theirwintering grounds.Diamondback Terrapin(Threatened) – inhabit tidalmarshes, mudflats, shallowbays, <strong>and</strong> coves, <strong>and</strong> nest ins<strong>and</strong>y upl<strong>and</strong>s on the baysideof Nauset Beach, near Sampson<strong>and</strong> Pochet Isl<strong>and</strong>s, <strong>and</strong> nearthe entrance <strong>to</strong> MeetinghousePond (Prescott, 2010). TerrapinsYoung Piping Plover (left).Pho<strong>to</strong>: Andy NorthrupDiamondback Terrapin, athreatened species. Pho<strong>to</strong>:Richard Johnsonoverwinter in the bot<strong>to</strong>m of estuaries, tidal creeks, <strong>and</strong> salt marshchannels. They feed on crabs, mollusks, crustaceans, fish, <strong>and</strong>carrion. Threats include loss of s<strong>and</strong>y nesting habitats (dunes),recreational activity disrupting nesting turtles <strong>and</strong> hatchlings (e.g.,off-road vehicles), egg <strong>and</strong> hatchling predation, etc.294 Priority Habitat is based on the known geographical extent of habitat for all state-listed rare species, both plants <strong>and</strong> animals. Habitat alteration within Priority Habitatsis subject <strong>to</strong> regula<strong>to</strong>ry review by NHESP. Estimated Habitats are a subset of Priority Habitats, <strong>and</strong> are based on the geographical extent of habitat of state-listed rarewetl<strong>and</strong>s wildlife only.5 Community state rank (SRANK) reflects the plant community’s rarity <strong>and</strong> threat within Massachusetts with regard <strong>to</strong> its regional rarity <strong>and</strong> threat. The SRANK S3 isdefined as “typically 21-100 occurrences.<strong>Pleasant</strong> <strong>Bay</strong> Alliance 2011
<strong>Coastal</strong> <strong>Resource</strong> <strong>Guide</strong> for <strong>Pleasant</strong> <strong>Bay</strong> <strong>and</strong> <strong>Chatham</strong> HarborThe approximately 300 acres of Saline/Brackish Flats in the centralpart of <strong>Pleasant</strong> <strong>Bay</strong> is the only priority natural community typeidentified by NHESP in the study area (Map 14). This prioritycommunity type, located between Sipson Isl<strong>and</strong> <strong>and</strong> Strong Isl<strong>and</strong>,has a community state rank of S3. 5 The Saline/Brackish Flatsestuarine community type is a sparsely vegetated intertidal habitatfound on mineral substrates. The flats are characterized by theNHESP as having an excellent diversity of marine fauna <strong>and</strong> algaein a variety of microhabitats. Horseshoe crabs are abundant hereas are shorebirds during migration. As mentioned in Section 7.4.3(Freshwater Wetl<strong>and</strong>s), exemplary occurrences of the state <strong>and</strong>globally rare New Engl<strong>and</strong> <strong>Coastal</strong> Plain Pond Shore Community(S2) <strong>and</strong> the Atlantic White Cedar Swamp Community (S2) havebeen documented among the freshwater ponds within the ACEC. 67.6 Water QualityThe <strong>Pleasant</strong> <strong>Bay</strong> Citizen Water Quality Moni<strong>to</strong>ring Program hasbeen moni<strong>to</strong>ring water quality in the <strong>Bay</strong> since 2000 in order <strong>to</strong>obtain consistent <strong>and</strong> comprehensive data <strong>to</strong> gauge nutrient inputsfrom the watershed <strong>and</strong> other sources. Twenty stations weremoni<strong>to</strong>red in 2011, <strong>and</strong> the program will moni<strong>to</strong>r that number forthe foreseeable future. The water quality data collected is essentialfor trend analyses <strong>and</strong> is relied upon by the <strong>to</strong>wns for development<strong>and</strong> compliance moni<strong>to</strong>ring for wastewater management plans.declining at others (Table 4). However, most of the sites do notdemonstrate any statistically significant trends. Sites showingimprovement in water quality are typically located in open waterareas of the <strong>Bay</strong>, while sites showing declining water qualitytend <strong>to</strong> be located in the sub-embayments. Results of the baywideanalysis indicate that water quality was declining for someparameters prior <strong>to</strong> the 2007 break in Nauset Beach, but that ithas been improving for these same parameters since that time.Other parameters remain unchanged. The results suggest that theincreased exchange of water between the <strong>Bay</strong> <strong>and</strong> ocean (due <strong>to</strong>2007 inlet formation) may be responsible for limited improvementsin water quality in some open areas of the <strong>Bay</strong>. Even with limitedimprovement in these areas, bioactive nitrogen concentrationscontinue <strong>to</strong> exceed MEP-modeled res<strong>to</strong>ration values for estuarinehealth. Furthermore, the anticipated continued southern migrationof the 2007 inlet suggests that tidal flushing <strong>and</strong> nitrogenconcentrations in the <strong>Bay</strong> may, over time, return <strong>to</strong> pre-inletconditions.The Massachusetts Estuaries Project (MEP) used water qualitydata collected by the <strong>Pleasant</strong> <strong>Bay</strong> program <strong>to</strong> determine criticalnitrogen loading thresholds. The MEP determined that in order<strong>to</strong> remain healthy enough <strong>to</strong> sustain eelgrass, waters in <strong>Pleasant</strong><strong>Bay</strong> would have a concentration of bioactive nitrogen not <strong>to</strong>exceed 0.21 mg/l (Howes et al, 2006). In 2007, the MassachusettsDepartment of Environmental Protection established TMDL’s (<strong>to</strong>talmaximum daily loads) for <strong>to</strong>tal nitrogen the <strong>Bay</strong>. The TMDLsrepresent the amount of nitrogen the <strong>Bay</strong> can receive <strong>and</strong> notexceed the threshold bioactive nitrogen concentration identified bythe MEP (Massachusetts EOEA, 2007). A TMDL for <strong>to</strong>tal nitrogenwas calculated for each of <strong>Pleasant</strong> <strong>Bay</strong>’s nineteen subembayments.The TMDL’s, which range from 2 <strong>to</strong> 155 kg/day, require reductionsin current watershed nitrogen loads of up <strong>to</strong> 100% in certainsubwatersheds. Because septic systems account for three quartersof the controllable watershed nitrogen load, several <strong>to</strong>wns arepursuing comprehensive wastewater treatment <strong>to</strong> achieve targetednitrogen reductions. Other nitrogen reduction strategies, such asminimizing loadings from s<strong>to</strong>rmwater runoff <strong>and</strong> fertilizer use, alsoare being explored but alone are not sufficient <strong>to</strong> achieve targetednitrogen reductions.In an effort <strong>to</strong> better underst<strong>and</strong> water quality trends in <strong>Pleasant</strong><strong>Bay</strong>, statistical analysis was conducted on the 10 years of waterquality data that have been collected (Cadmus, 2010). Statisticalanalysis of the data included a bay-wide trend analysis, as well assite-specific analyses. Analysis of the data also identify any effectsof the new inlet (2007), with its concomitant increase in the rate<strong>and</strong> volume of water exchange between <strong>Pleasant</strong> <strong>Bay</strong> <strong>and</strong> theAtlantic Ocean, on trends in bay water quality.The results of the site-specific analysis of water quality trendsdemonstrate that water quality is improving at some sites, but30<strong>Pleasant</strong> <strong>Bay</strong> Alliance 2011
<strong>Coastal</strong> <strong>Resource</strong> <strong>Guide</strong> for <strong>Pleasant</strong> <strong>Bay</strong> <strong>and</strong> <strong>Chatham</strong> HarborTable 4 shows statistically significant water quality trends at individual stations.Green triangles represent improved water quality; red triangles indicate declining water quality; yellow squares indicate no statisticallysignificant trend. Direction of triangles indicates direction of concentration. DO=dissolved oxygen; PO4 =phosphate; DIN=dissolvedinorganic nitrogen; TN=<strong>to</strong>tal nitrogen; BioN=bioactive nitrogen. Note: half the stations do not have data after the 2007 break. Source: TheCadmus Group, 2010.Station DO PO4 DIN TN BioN Pigment Post Break Data<strong>Chatham</strong> Harbor (PBA-1) n n n t t t NoBassing Harbor (PBA-2) n n n n n n NoInner Ryder’s Cove (PBA-3) n n s s s s YesOuter Ryder’s Cove (CM-13) n n s n n n YesFrost Fish Creek (CM-14) n n n n n n NoCrow’s Pond (PBA-4) n n n n n n YesMuddy Creek (PBA-5) n n n n n n YesMuddy Creek - Upper (PBA-5A) n n n n n n YesBig <strong>Bay</strong> - SW (PBA-6) n n n t n n NoBig <strong>Bay</strong> - Mid (PBA-7) n n n n n n NoBig <strong>Bay</strong> - NE (PBA-8) s n n n n n YesRound Cove (PBA-9) n n n n n n YesQuanset Pond (PBA-10) n n s s n n YesPaw Wah Pod (PBA-11) n n n n n n YesNamequoit - South (PBA-12) n n n n t n YesNamequoit - North (PBA-13) n n n n n n YesArey’s Pond (PBA-14) n n n n n n NoKescayogansett Pod (PBA-15) n s n n n n YesMeetinghouse Pond (PBA-16) n n n n n n NoAllen’s Ministers Point (PBA-18) n n n t t n NoStrong Isl<strong>and</strong> (PBA-19) n n n n n n NoNickersons Neck (PBA-20) n n n n t n NoLittle <strong>Pleasant</strong> <strong>Bay</strong> (PBA-21) n n n n t n NoPochet Mouth (WMO-3) n n n n n n YesPochet Upper (WMO-5) n n n n n s YesNamequoit River Mid (WMO-6) n n n n n n YesRiver at Rattles Dock (WMO-10) t s n n s s Yes<strong>Pleasant</strong> <strong>Bay</strong> off Quanset (WMO-10) n n n n n n NoPochet - Mid (WMO-4) n n n n n n NoNamequoit River - Mouth (WMO-7) n n n n n n NoLower River (WMO-8) n n n n n n NoMid River (WMO-9) n n n n n n NoLittle Quanset Pond (WMO-12) n n n n n n No31 6 SRANK S2 is defined as “typically 6-20 occurrences, few remaining acres or miles of stream, or very vulnerable <strong>to</strong> extirpation in Massachusetts for other reasons”.<strong>Pleasant</strong> <strong>Bay</strong> Alliance 2011
<strong>Coastal</strong> <strong>Resource</strong> <strong>Guide</strong> for <strong>Pleasant</strong> <strong>Bay</strong> <strong>and</strong> <strong>Chatham</strong> HarborSection 8Bathymetry <strong>and</strong> Navigation8.1 PurposeThe purpose of this section is <strong>to</strong> illustrate <strong>and</strong> describe how thedynamic pattern of growth, elongation <strong>and</strong> periodic breachingof Nauset Beach described in Section 2 contributes <strong>to</strong> a highlyvariable system of waterways <strong>and</strong> channels in <strong>Chatham</strong> Harbor <strong>and</strong><strong>Pleasant</strong> <strong>Bay</strong>.8.2 MethodologyA considerable number of studies over the past decade havelooked at the bathymetry <strong>and</strong> hydrodynamics of <strong>Pleasant</strong> <strong>Bay</strong>. Thefirst of these studies, entitled Hydrodynamic <strong>and</strong> Tidal Flushing:Study of <strong>Pleasant</strong> <strong>Bay</strong> Estuary, MA, was conducted by AubreyConsulting, Inc. in 1997. In 2005, as part of the MassachusettsEstuary Project (MEP) Technical Report for <strong>Pleasant</strong> <strong>Bay</strong>, bathymetrymeasurements were updated <strong>and</strong> hydrodynamics were modeledonce again. The 2005 MEP model was updated in 2007 followingthe formation of the second inlet, under a program sponsored bythe Army Corp of Engineers. The 2007 modeling study updatedthe <strong>Pleasant</strong> <strong>Bay</strong> RMA-2 model mesh developed for the MEP <strong>and</strong>included the new 2007 inlet <strong>and</strong> updated bathymetry from a 2007LIDAR survey. The 2007 model also included a harmonic analysisof tide gage data at Meetinghouse Pond collected between2005 <strong>and</strong> 2007, as well as ADCP (bathymetric <strong>and</strong> current)measurements collected in the newly formed inlet in 2007. In2009, the Alliance commissioned <strong>Coastal</strong> Engineering Company,Inc. <strong>to</strong> conduct hydrogeoraphic surveys of all major navigationchannels in <strong>Pleasant</strong> <strong>Bay</strong>. This study was intended <strong>to</strong> provide abaseline for moni<strong>to</strong>ring navigation depths <strong>and</strong> potential dredgingneeds.8.3 Overview of the Channel SystemThe internal channel system has his<strong>to</strong>rically fluctuated betweendecades of relative stability <strong>to</strong> other periods of rapid shoaling <strong>and</strong>channel migration. These periods of rapid change are generally aresponse <strong>to</strong> the breaching of Nauset Beach, the creation of newinlets <strong>and</strong> a large influx of new sediment, increased wave energy<strong>and</strong> higher current velocities associated with a larger overall tidalprism. The development of a new inlet in 2007, located north ofthe inlet formed in 1987 across from <strong>Chatham</strong> Light, provides fora more efficient water exchange between the Ocean <strong>and</strong> interiorestuary. This in turn has the tendency <strong>to</strong> increase the tidal rangeinside <strong>Pleasant</strong> <strong>Bay</strong> causing both higher high tides <strong>and</strong> lower lowtides. 1The navigable waters <strong>and</strong> channels surrounding <strong>Pleasant</strong> <strong>Bay</strong> <strong>and</strong><strong>Chatham</strong> Harbor have his<strong>to</strong>rically been relatively shallow exceptfor the deeper basins of <strong>Pleasant</strong> <strong>Bay</strong> <strong>and</strong> the adjoining innertidal ponds. Bathymetric data for <strong>Pleasant</strong> <strong>Bay</strong> <strong>and</strong> navigationalchannels is shown in the Map 17 series. Most of these ponds areSection HighlightsThe channel system linking <strong>Pleasant</strong> <strong>Bay</strong> <strong>and</strong> <strong>Chatham</strong>Harbor has fluctuated between periods of stability<strong>and</strong> shoaling, due in large part <strong>to</strong> changes in tidesresulting from the formation <strong>and</strong> migration of inletsin the Nauset barrier beach.The tide range increased .7 feet following theformation of the 2007 inlet, <strong>and</strong> there is now adifference of four <strong>and</strong> one-half feet between low <strong>and</strong>high tide. The volume of water exchanging with theAtlantic Ocean also increased by 11% following the2007 inlet formation.The navigable waters <strong>and</strong> channels surrounding<strong>Pleasant</strong> <strong>Bay</strong> <strong>and</strong> <strong>Chatham</strong> Harbor have his<strong>to</strong>ricallybeen relatively shallow except for the deeper basinsof <strong>Pleasant</strong> <strong>Bay</strong> <strong>and</strong> the adjoining inner tidal ponds.A 2009 hydrogeographic survey measured thecontrolling depths of navigational channelsthroughout the system. The survey indicated thatnavigation access is maintained in all channels,although in some cases is constrained at low tide.Shoaling in the vicinity of the 2007 inlet is beingmoni<strong>to</strong>red in view of potential negative impacts<strong>to</strong> his<strong>to</strong>ric access for recreational boaters <strong>and</strong> forreaching safe haven of commercial fishing boats.remnant glacial kettle ponds <strong>and</strong> while their inner basins can berelatively deep, the tidal channels accessing them are typicallyshallow. The portions of <strong>Pleasant</strong> <strong>Bay</strong> east of Strong Isl<strong>and</strong> <strong>and</strong>of Little <strong>Pleasant</strong> <strong>Bay</strong> east of Sipson’s, Sampson’s <strong>and</strong> Hog Isl<strong>and</strong>s,respectively, are characterized by wide shallow bars <strong>and</strong> flatswith depths typically between 0 <strong>to</strong> 3 feet at MLW. His<strong>to</strong>ricallythese areas have been subject <strong>to</strong> large intrusions of sedimentperiodically entering the estuary due <strong>to</strong> barrier beach washover<strong>and</strong> new inlet formation. Natural me<strong>and</strong>ering tidal channels areinterspersed throughout these shallow portions of <strong>Pleasant</strong> <strong>Bay</strong><strong>and</strong> navigation requires considerable local knowledge of the area.8.4 Boating<strong>Pleasant</strong> <strong>Bay</strong> <strong>and</strong> <strong>Chatham</strong> Harbor have a long his<strong>to</strong>ry as primeareas for recreational <strong>and</strong> commercial boating. The estuary’slocation at the elbow of the Outer Cape is in close proximity <strong>to</strong>productive near <strong>and</strong> offshore fishing resources <strong>and</strong> also provides1 A hydrodynamic modeling study conducted by the US Army Corp of Engineers just months after the formation of the 2007 inlet, found that the new second inletresulted in an increase in tidal range of 0.7 feet, from 3.6 feet pre-breach <strong>to</strong> 4.3 feet post-breach (a 1.1 foot increase in tide range was measured by the Fish Pier tidegage). System-wide, the tidal prism, which is the volume of water exchanged between <strong>Pleasant</strong> <strong>Bay</strong> <strong>and</strong> the Atlantic Ocean, increased 14.9% while the tidal prism atthe 1987 inlet decreased by 24%.32<strong>Pleasant</strong> <strong>Bay</strong> Alliance 2011
<strong>Coastal</strong> <strong>Resource</strong> <strong>Guide</strong> for <strong>Pleasant</strong> <strong>Bay</strong> <strong>and</strong> <strong>Chatham</strong> Harbora safe harbor for vessels accessing the Atlantic Ocean. Theseattributes have contributed <strong>to</strong> the development of <strong>Chatham</strong>as homeport <strong>to</strong> the largest commercial fishing fleet on CapeCod. The barrier beach system has also created a naturally large,sheltered estuary which is extremely popular for recreational smallboating <strong>and</strong> shallow draft sailing.The vast majority of the boats moored or launched in <strong>Chatham</strong>Harbor <strong>and</strong> <strong>Pleasant</strong> <strong>Bay</strong> range from 15 <strong>to</strong> 25 feet in length, witha few vessels up <strong>to</strong> about 35 feet. The majority of these vesselshave draft requirements of less than 3 feet in depth. A few largerinboard recreational vessels use the system but the majority oflarger vessels comprise the <strong>Chatham</strong> commercial fishing fleetlocated in <strong>Chatham</strong> Harbor <strong>and</strong> Aunt Lydia’s Cove. Even thesevessels, which measure in the range of 35 <strong>to</strong> 45 feet, are notparticularly large when compared <strong>to</strong> other commercial fishingports. Drafts of the commercial vessels typically range between 3.5<strong>to</strong> 7.5 feet. Few large sailing vessels are located in <strong>Pleasant</strong> <strong>Bay</strong> or<strong>Chatham</strong> Harbor due <strong>to</strong> the shallow depths <strong>and</strong> severely limitedaccess through <strong>and</strong> over the inlet bars.8.5 His<strong>to</strong>rical Channel Depths <strong>and</strong> Dredging<strong>Pleasant</strong> <strong>Bay</strong> <strong>and</strong> <strong>Chatham</strong> Harbor are considered relatively shoaledwater bodies from the perspective of navigation. Access throughthe inlets is limited. Relatively deep water (fifteen feet or more atMLW) exists in the main basin of <strong>Pleasant</strong> <strong>Bay</strong> <strong>and</strong> a few otherareas. However many of the connecting channels, nearshore areas<strong>and</strong> narrow tidal creeks <strong>and</strong> rivers are severely restricted <strong>to</strong> depthsof three feet at MLW or less. Some of the tidal ponds such asArey’s, Lonnie’s <strong>and</strong> Quanset ponds have entrance channels withonly about one <strong>to</strong> two feet of water depth at MLW. The generalprevalence of shoal water in <strong>Pleasant</strong> <strong>Bay</strong> has effectively limitedthe size <strong>and</strong> draft requirements of vessels utilizing the waterways.While dredging has been his<strong>to</strong>rically performed in some locations,most active dredging has been limited <strong>to</strong> the channels accessingAunt Lydia’s Cove <strong>and</strong> Round Cove.Dredged material from Aunt Lydia’s Cove is pumped on<strong>to</strong> AndrewHarding Beach. Pho<strong>to</strong>: Ted KeonRecent maintenance dredging at Round Cove has been performedby the Barnstable County dredge, Codfish, which is a cutterheadsuction pipeline dredge. Aunt Lydia’s Cove, which is the homeport for <strong>Chatham</strong>’s important commercial fishing fleet, is a federalnavigation project <strong>and</strong> dredging is performed by the U.S. ArmyCorps of Engineers’ special purpose hopper dredge, Currituck.Supplemental maintenance dredging of Aunt Lydia’s Cove is alsooccasionally accomplished by the Codfish. Minor maintenancedredging along bulkheads <strong>and</strong> ramps at public l<strong>and</strong>ings in otherareas within <strong>Pleasant</strong> <strong>Bay</strong> <strong>and</strong> <strong>Chatham</strong> Harbor is generallyperformed mechanically by either a crane with a clamshellbucket or excava<strong>to</strong>r. The material removed from the harbors <strong>and</strong>waterways of these dredging projects is generally clean, beachcompatible s<strong>and</strong>. Therefore, it is appropriate <strong>to</strong> reutilize thismaterial in a beneficial manner as beach nourishment which hasbeen the common practice for disposal of the dredged materialwithin <strong>Pleasant</strong> <strong>Bay</strong> <strong>and</strong> <strong>Chatham</strong> Harbor.A marked navigation channel maintained by the Harbormastersfrom Orleans <strong>and</strong> <strong>Chatham</strong> extends from the <strong>Chatham</strong> inle<strong>to</strong>pposite the <strong>Chatham</strong> Lighthouse <strong>to</strong> the northern terminus atMeetinghouse Pond. This channel identifies the preferred <strong>and</strong>“best water” conditions along the main north <strong>to</strong> south axis of theestuary in order <strong>to</strong> navigate from one end <strong>to</strong> the other. Depthsalong this channel can vary significantly but generally rangebetween four <strong>to</strong> seven feet at MLW. Migrating shoals, particularlyin <strong>Chatham</strong> can change the orientation of this channel as well asfurther restricting depths. Nonetheless, three feet at MLW hasbeen the approximate limiting controlling depth along the mainmarked navigation channel through <strong>Pleasant</strong> <strong>Bay</strong> <strong>and</strong> <strong>Chatham</strong>Harbor for the past several decades. Map 18 illustrates the primarymarked navigation channel from the southern <strong>Chatham</strong> Inletthrough Meetinghouse Pond in Orleans. It also shows the locationof the other marked tributary channels providing access <strong>to</strong> thevarious sub-embayments within the system.33Federal dredge, the Currituck. Pho<strong>to</strong>: Ted Keon<strong>Pleasant</strong> <strong>Bay</strong> Alliance 2011
<strong>Coastal</strong> <strong>Resource</strong> <strong>Guide</strong> for <strong>Pleasant</strong> <strong>Bay</strong> <strong>and</strong> <strong>Chatham</strong> HarborTable 5. Controlling Depths in <strong>Pleasant</strong> <strong>Bay</strong>Approx. ControllingDepth (MLW) 2Minister’s Point <strong>to</strong> <strong>Pleasant</strong> <strong>Bay</strong>, <strong>Chatham</strong> (4 ft. by 60 ft.) -4.5 ft (-1.4 m)Bassing Harbor Entrance Channel, <strong>Chatham</strong> (4 ft. by 60 ft.) -3.0 ft (-0.9 m)Crows Pond, <strong>Chatham</strong> (4 ft. by 40 ft. (1.2 m by 12 m) ) -3.0 ft (-0.9 m)Round Cove, Harwich (6 ft by 30 ft.) -4.0 ft (-1.2 m)Quanset Pond, Orleans (3 ft. by 30 ft.) -1.5 ft (-.46 m)The Narrows, Orleans (3 ft. by 50 ft.) -4.5 ft (-1.4 m)Paw Wah Pond, Orleans (3 ft. by 24 ft.) -1.0 ft (-0.3 m)Arey’s Pond, Orleans (3 ft. by 24 ft.) -1.5 ft (-.46 m)Lonnie’s Pond, Orleans (3 ft. by 24 ft.) -1.0 ft (-0.3 m)The River <strong>to</strong> Meetinghouse Pond, Orleans (3 ft. by 30 ft.) -6.0 ft (-2.8m)Source: Hydrogeographic survey of <strong>Pleasant</strong> <strong>Bay</strong>, <strong>Coastal</strong> Engineering, 20098.6 Existing Bathymetric ConditionsThe new inlet through Nauset Beach formed in April 2007is anticipated <strong>to</strong> cause various levels of impact <strong>to</strong> navigationthroughout <strong>Pleasant</strong> <strong>Bay</strong> <strong>and</strong> <strong>Chatham</strong> Harbor. The NationalOceanic <strong>and</strong> Atmospheric Administration (NOAA) installed a tidegauge at the <strong>Chatham</strong> Fish Pier during the spring of 2009. Basedon an analysis of the recent tide data, NOAA has confirmed thatas of May 2009, the tide range at the Fish Pier from MLW <strong>to</strong> MHWhas increased approximately one-foot due <strong>to</strong> the 2007 break. Thisincrease in range is comprised of approximately 0.8 feet in lowertide levels at MLW <strong>and</strong> 0.25 feet of higher tide levels at MHW.Therefore, from the perspective of navigation, the estuary is nowshallower at low tide <strong>and</strong> areas that previously were marginallynavigable at MLW may now not be passable for certain vessels.As the 2007 inlet formed <strong>and</strong> widened, large amounts of news<strong>and</strong> were carried in<strong>to</strong> <strong>Chatham</strong> Harbor. At the same time,the larger tidal prism entering through the inlet has caused anincrease in tidal current velocities in certain areas. These twofac<strong>to</strong>rs have the potential <strong>to</strong> cause additional shoaling withinexisting navigation channels. The stronger current velocities alsomay cause previously stable shoals <strong>and</strong> bars <strong>to</strong> move <strong>and</strong> migratewith impacts <strong>to</strong> navigation. This issue is more likely <strong>to</strong> occur inthe general vicinity of the new inlet although increased currentvelocities have caused some shifting of shoals <strong>and</strong> tidal channelssignificantly removed from the new inlet.This concern about possible shallower depths within existingnavigable channels precipitated the establishment of a baselinehydrogeographic survey of existing bathymetry. These surveyswere only conducted in the principal navigation channels whereit was felt that navigable depths may be negatively impacted <strong>and</strong>where dredging might be considered if deemed necessary. Thissurvey effort identified both the approximate MLW depths alongthe channel as well as the estimated volume of material thatwould need <strong>to</strong> be dredged <strong>to</strong> return the channel <strong>to</strong> the designdimensions. These results are based on survey data completed inthe fall of 2008.The location <strong>and</strong> channel dimensions (depth at MLW by width)where the surveys were performed as well as the approximateminimum depths (also referred <strong>to</strong> as the controlling depths)Table 6. Estimated Dredge VolumesDredge Over-Depth TotalVolume Volume VolumeMinister’s Point <strong>to</strong> <strong>Pleasant</strong> <strong>Bay</strong>, (4 ft. by 60 ft.) 0 795 795Bassing Harbor Entrance Channel, (4 ft. by 60 ft.) 2,310 5,535 7,845Crows Pond, (4 ft. by 40 ft.) 1,943 2,916 4,859Round Cove, (6 ft by 30 ft.) 1,300 1,450 2,750Quanset Pond, (3 ft. by 30 ft.) 365 410 775The Narrows, (3 ft. by 50 ft.) 0 0 0Paw Wah Pond, (3 ft. by 24 ft.) 1,530 1,020 2,550Arey’s Pond, (3 ft. by 24 ft.) 850 1,860 2,710Lonnie’s Pond, (3 ft. by 24 ft.) 1,603 1,705 3,308The River <strong>to</strong> Meetinghouse Pond, (3 ft. by 30 ft.) 0 250 250Source: Hydrogeographic survey of <strong>Pleasant</strong> <strong>Bay</strong>, <strong>Coastal</strong> Engineering, 20092 The negative sign indicates depth below MLW, which is 0. Therefore, -4.5 MLW is a water depth of 4.5 feet at MLW.34<strong>Pleasant</strong> <strong>Bay</strong> Alliance 2011
<strong>Coastal</strong> <strong>Resource</strong> <strong>Guide</strong> for <strong>Pleasant</strong> <strong>Bay</strong> <strong>and</strong> <strong>Chatham</strong> Harborincreased the overall tidal prism entering <strong>Chatham</strong> Harbor <strong>and</strong><strong>Pleasant</strong> <strong>Bay</strong>. This larger volume of water, in turn, increased tidalranges approximately 1.6 ft as well as increased current velocitiesthroughout the system. These increased velocities caused themigration of some shoals <strong>and</strong> channel systems that had beenrelatively stable for many years prior <strong>to</strong> the 1987 inlet. Within afew years after the inlet break, the channels <strong>and</strong> shoal systemswithin the mid <strong>and</strong> upper regions of <strong>Pleasant</strong> <strong>Bay</strong> became moreequilibrated <strong>to</strong> the new hydraulic regime. <strong>Chatham</strong> Harbor,however, was still undergoing considerable change twenty yearsafter the inlet breach due <strong>to</strong> close proximity <strong>to</strong> the inlet.Dredging with an excava<strong>to</strong>r at the Fish Pier. Pho<strong>to</strong>: Ted KeonThe <strong>to</strong>tal volume of material, which would be generated if thechannels were dredged <strong>to</strong> the design dimensions, is shown in Table6. The volume is based on cubic yards <strong>and</strong> the over-depth assumesone foot of additional dredging beyond the design depth. Notethat the dredge volume assumes establishing the project designdepth along the full channel width.8.7 Shoal Migration PatternsAs stated above, much of the <strong>Pleasant</strong> <strong>Bay</strong> system is characterizedby shallow s<strong>and</strong>y shoals <strong>and</strong> me<strong>and</strong>ering channels. Unlike finegrained silts <strong>and</strong> clays which are easily disturbed <strong>and</strong> transportedwithin the water column, s<strong>and</strong> needs a relatively high energyenvironment <strong>to</strong> become mobile. Therefore, the areas of greatestshoal movement are generally in the vicinity of tidal inlets <strong>and</strong>channels with high tidal currents. 3Areas adjacent <strong>to</strong> tidal inlets are particularly prone <strong>to</strong> migratingshoal patterns given the large potential for sediment introductionfrom the ocean beaches, strong tidal currents <strong>and</strong> high waveenergy. <strong>Chatham</strong> Harbor quickly became recognized as havingsome of the most dynamic channel <strong>and</strong> shoal systems in theCommonwealth following the formation of the new inlet near the<strong>Chatham</strong> Lighthouse in 1987. The inlet caused the developmen<strong>to</strong>f a highly variable flood <strong>and</strong> ebb shoal complex that werechallenging <strong>to</strong> navigate. These changes required the developmen<strong>to</strong>f an extensive dredging program <strong>to</strong> maintain navigation accessfor the <strong>Chatham</strong>’s commercial fishing fleet. The 1987 inlet alsoenabled higher energy waves <strong>to</strong> enter <strong>Chatham</strong> Harbor, whichresulted in considerable erosion of the adjoining, previouslysheltered, internal beaches <strong>and</strong> upl<strong>and</strong> property along themainl<strong>and</strong>. This erosion contributed lit<strong>to</strong>ral sediments <strong>to</strong> <strong>Pleasant</strong><strong>Bay</strong>, which modified shoals in <strong>Chatham</strong> Harbor.The more recent inlet breach in 2007 has already caused manychanges <strong>to</strong> the adjacent interior shoal systems <strong>and</strong> it is anticipatedthat considerable modifications will continue <strong>to</strong> occur as the inletfurther develops (see Figure 6 found in section 2). Given thenorthern location of the 2007 inlet, the upper portions of <strong>Chatham</strong>Harbor <strong>and</strong> southern waters of <strong>Pleasant</strong> <strong>Bay</strong> near Ministers Point<strong>and</strong> Strong Isl<strong>and</strong> are likely <strong>to</strong> be regions of greatest change. Thisdynamic potential is related <strong>to</strong> the influx of large, new sedimentsupplies <strong>and</strong> further increases in tidal flow. Many of the channelsystems between the <strong>Chatham</strong> mainl<strong>and</strong> <strong>and</strong> Strong Isl<strong>and</strong> alreadyhave become more dynamic due <strong>to</strong> the higher current velocities.A new flood shoal complex is forming inside the new inlet <strong>and</strong>at this time it is unclear how, where, or in what manner thisflood shoal will ultimately migrate. It is equally unclear how thetraditional navigation channels will respond <strong>to</strong> the intrusion of newsediments, shoal movement <strong>and</strong> increased current velocities. Map18 identifies the area where the greatest amount of shoal <strong>and</strong>channel migration is expected <strong>to</strong> occur over the next several years.The 2007 inlet has altered s<strong>and</strong> <strong>and</strong> channel stability within theportion of <strong>Chatham</strong> Harbor between the two inlets. The 2007inlet has captured a significant volume of the overall tidal prismfor <strong>Pleasant</strong> <strong>Bay</strong>. Therefore, current velocities have moderatedsomewhat between the two inlets since the southern inlet iscontributing less water <strong>to</strong> the estuary. This has slowed the rate<strong>and</strong> extent of shoal migration in <strong>Chatham</strong> Harbor <strong>and</strong> it is likelythat the previously highly mobile flood shoal complex will becomeincreasingly more stable in the short term. However, the longerterm changes within this portion of <strong>Chatham</strong> Harbor may still besignificant. Over the next few decades, it is assumed that theremnant isl<strong>and</strong> between the two inlets will break-up <strong>and</strong> ultimatelymigrate in an anticipated west <strong>to</strong> southwesterly direction. Thishas the potential <strong>to</strong> significantly alter the network of shoals <strong>and</strong>channels <strong>and</strong> shoreline morphology in <strong>Chatham</strong> Harbor in thecoming years.In addition <strong>to</strong> causing the growth <strong>and</strong> migration of large floodshoal systems within the adjacent harbor, the 1987 inlet also353 Barrier beach overwash is another mechanism whereby sediments are added <strong>to</strong> the interior estuary which can then be redistributed by waves <strong>and</strong> currents. This is amore episodic event generally only occurring during large s<strong>to</strong>rm events <strong>and</strong> effecting areas immediately l<strong>and</strong>ward of the barrier beach.<strong>Pleasant</strong> <strong>Bay</strong> Alliance 2011
<strong>Coastal</strong> <strong>Resource</strong> <strong>Guide</strong> for <strong>Pleasant</strong> <strong>Bay</strong> <strong>and</strong> <strong>Chatham</strong> HarborSourcesBorrelli, M., (2009). 137 years of Shoreline Change in <strong>Pleasant</strong> <strong>Bay</strong>: 1868 - 2005. Technical report submitted <strong>to</strong> the <strong>Pleasant</strong> <strong>Bay</strong> <strong>Resource</strong>Management Alliance. Harwich, Massachusetts. 29 p.Cape Cod Commission. Barnstable County, Cape Cod, Massachusetts Multi-Hazard Mitigation Plan. Prepared for the Federal EmergencyManagement Agency <strong>to</strong> comply with the DMA Act of 2000. 2010.Carlisle, B.K., A.M. Donovan, A.L. Hicks, V.S. Kooken, J.P. Smith, <strong>and</strong> A.R. Wilbur (2002). A Volunteer’s H<strong>and</strong>book for Moni<strong>to</strong>ring NewEngl<strong>and</strong> Salt Marshes. Massachusetts Office of <strong>Coastal</strong> Zone Management, Bos<strong>to</strong>n, MA.Carmichael, Ruth, H., D. Rutecki, <strong>and</strong> I. Valiela (2003). Abundance <strong>and</strong> population structure of the Atlantic horseshoe crab Limuluspolyphemus in <strong>Pleasant</strong> <strong>Bay</strong>, Cape Cod. Marine Ecology Progress Series, Vol. 246: 225–239, 2003<strong>Coastal</strong> Engineering Company, Inc. (2009). <strong>Pleasant</strong> <strong>Bay</strong> Hydrographic Survey. Prepared for the <strong>Pleasant</strong> <strong>Bay</strong> Alliance.Commonwealth of Massachusetts (EOEA) <strong>and</strong> Massachusetts Dept. of Environmental Protection (2007). <strong>Pleasant</strong> <strong>Bay</strong> System TotalMaximum Daily Loads For Total Nitrogen (Final Report # 96-TMDL-12, Control #244.0).Costa, Joe (no date). Eelgrass in Buzzards <strong>Bay</strong> (http://www.buzzardsbay.org/eelgrass.htm)Farber, Dawson. (2010). Interview with J. Andrew Walsh.Giese, Graham S. (1978). The Barrier Beaches of <strong>Chatham</strong>, Massachusetts. A Study Undertaken for the Conservation Commission, <strong>Town</strong>of <strong>Chatham</strong>, Massachusetts. Province<strong>to</strong>wn Center for <strong>Coastal</strong> Studies.Giese, Graham S.; Mague, Steven T.; Rogers, Stacy S. (2009). A Geomorphological Analysis of Nauset Beach/<strong>Pleasant</strong> <strong>Bay</strong>/<strong>Chatham</strong> HarborFor the Purpose of Estimating Future Configurations <strong>and</strong> Conditions. A Study Undertaken for the <strong>Pleasant</strong> <strong>Bay</strong> Alliance. Province<strong>to</strong>wnCenter for <strong>Coastal</strong> Studies.Horsley & Witten, Inc. (2003). A Qualitative Survey of Pond Shoreline Vegetation <strong>and</strong> Anthropogenic Threats at Eleven Freshwater Pondsin the <strong>Pleasant</strong> <strong>Bay</strong> Area of Critical Environmental Concern, <strong>Chatham</strong> <strong>and</strong> Orleans, Massachusetts.Howes B., S. W. Kelley, J.S. Ramsey, R. Samimy, D. Schlezinger, E. Eichner (2006). Linked Watershed-Embayment Model <strong>to</strong> DetermineCritical Nitrogen Loading Thresholds for <strong>Pleasant</strong> <strong>Bay</strong>, <strong>Chatham</strong>, Massachusetts. Massachusetts Estuaries Project, MassachusettsDepartment of Environmental Protection. Bos<strong>to</strong>n, MA. 227pp.Jackson, J.A. (2005). Glossary of Geology. 5th ed. ISBN 3-540-27951-2. Berlin: Springer, 2005.James-Pirri, M. J., et al. (2005). Spawning Densities, Egg Densities, Size Structure, <strong>and</strong> Movement Patterns of Spawning Horseshoe Crabs,Limulus polyphemus, within Four <strong>Coastal</strong> Embayments on Cape Cod, Massachusetts. Estuaries Vol. 28, No. 2, p. 296–313, April 2005.MassGIS. DEP Wetl<strong>and</strong>s (1:12,000) (August 2011), Shellfish Suitability Areas.Massachusetts Wetl<strong>and</strong>s Protection Act (M.G.L. c. 131, s. 40) <strong>and</strong> Regulations (310 CMR 10.00).Moore, Stuart. (2010). Interview with J. Andrew Walsh.Murphy, Diane. (2010). Interview with J. Andrew Walsh.National Oceanic <strong>and</strong> Atmospheric Administration, et al. (2001). Massachusetts Environmental Sensitivity Index MetadataOldale, Robert (rev. 2001). Cape Cod, Martha’s Vineyard & Nantucket: The Geologic S<strong>to</strong>ry. On Cape Publications, 226 p.Oldale, Robert, N. <strong>and</strong> Carl Koteff (1970). Geologic Quadrangle Map of the <strong>Chatham</strong> Quadrangle, Barnstable County, Cape Cod,Massachusetts. Published by <strong>Pleasant</strong> <strong>Bay</strong> Area of Critical Environmental Concern (http://www.mass.gov/dcr/stewardship/acec/acecs/lplebay.htm)Oldale, Robert, N., Carl Koteff <strong>and</strong> J.H. Hartshorn (1971). Geologic Quadrangle Map of the Orleans Quadrangle, Barnstable County, CapeCod, Massachusetts. Published by the U.S. Geological Survey.36<strong>Pleasant</strong> <strong>Bay</strong> Alliance 2011
<strong>Coastal</strong> <strong>Resource</strong> <strong>Guide</strong> for <strong>Pleasant</strong> <strong>Bay</strong> <strong>and</strong> <strong>Chatham</strong> HarborPrescott, Robert. (2010). Interview with J. Andrew Walsh.Rutecki, Deborah, R. H. Carmichael, <strong>and</strong> I. Valiela, (2004). Magnitude of Harvest of Atlantic Horseshoe Crabs, Limulus polyphemus, in<strong>Pleasant</strong> <strong>Bay</strong>, Massachusetts. Estuaries, Vol. 27, No. 2, p. 179-187. April 2004.Smith, D. R., M. J. Millard, <strong>and</strong> R.H. Carmichael (2009). Comparative status <strong>and</strong> assessment of Limulus polyphemus withemphasis on the New Engl<strong>and</strong> <strong>and</strong> Delaware <strong>Bay</strong> populations. p. 361-386. In J.T. Tanacredi et al. (eds.), Biology <strong>and</strong>Conservation of Horseshoe Crabs (2009).Smith, Stephen M. (2009). Multi-decadal Changes in Salt Marshes of Cape Cod, MA: Pho<strong>to</strong>graphic Analyses of Vegetation Loss, SpeciesShifts, <strong>and</strong> Geomorphic Change. Northeastern Naturalist, V. 16, No. 2, pp. 183-208.S<strong>to</strong>ne, Byron D., M. L. DiGiacomo-Cohen (2009). Surficial geologic map of the Pocasset-Province<strong>to</strong>wn-Cuttyhunk-Nantucket24-quadrangle area of Cape Cod <strong>and</strong> Isl<strong>and</strong>s, southeast Massachusetts: U.S. Geological Survey Open File Report 2006 1260-E.The Cadmus Group, Inc. (2010). <strong>Pleasant</strong> <strong>Bay</strong> Alliance Water Quality Moni<strong>to</strong>ring Program: Statistical Analysis of Multi-year Water QualityMoni<strong>to</strong>ring Data. Prepared by the Cadmus Group, Inc., 57 Water St., Water<strong>to</strong>wn, MA 02472. Prepared for the <strong>Pleasant</strong> <strong>Bay</strong> Alliance.Tiner, R.W. (2010). Wetl<strong>and</strong>s of Cape Cod <strong>and</strong> the Isl<strong>and</strong>s, Massachusetts: Results of the National Wetl<strong>and</strong>s Inven<strong>to</strong>ry <strong>and</strong> L<strong>and</strong>scapelevelFunctional Assessment. National Wetl<strong>and</strong>s Inven<strong>to</strong>ry report. U.S. Fish <strong>and</strong> Wildlife Service, Northeast Region, Hadley, MA. 78 pp.plus appendices.Theiler, Rob. (2009). Planning for Sea Level Rise <strong>and</strong> Shoreline Change at the Local Level. U.S. Geological Survey.University of Massachusetts Dartmouth (School of Marine Science <strong>and</strong> Technology) <strong>and</strong> Massachusetts Department of EnvironmentalProtection (2006). Linked Watershed-Embayment Model <strong>to</strong> Determine Critical Nitrogen Loading Thresholds for the <strong>Pleasant</strong> <strong>Bay</strong> System,<strong>Town</strong>s of Orleans, <strong>Chatham</strong>, Brewster <strong>and</strong> Harwich, Massachusetts. Massachusetts Estuaries Project. Final Report-May 2006.Massachusetts Department of Environmental Protection (2003). Small Docks <strong>and</strong> Piers – A <strong>Guide</strong> <strong>to</strong> Permitting Small, Pile-SupportedDocks <strong>and</strong> Piers.<strong>Pleasant</strong> <strong>Bay</strong> <strong>Resource</strong> Management Alliance (1999). <strong>Guide</strong>lines <strong>and</strong> Performance St<strong>and</strong>ards for Docks & Piers in <strong>Pleasant</strong> <strong>Bay</strong>.<strong>Pleasant</strong> <strong>Bay</strong> <strong>Resource</strong> Management Alliance (2002). <strong>Guide</strong>lines for Private Walkways <strong>and</strong> Stairways in Fresh <strong>and</strong> Marine <strong>Resource</strong>s Areasin <strong>Pleasant</strong> <strong>Bay</strong>.<strong>Pleasant</strong> <strong>Bay</strong> <strong>Resource</strong> Management Plan. <strong>Pleasant</strong> <strong>Bay</strong> Technical <strong>Resource</strong> Committee <strong>and</strong> Ridley & Associates, Inc., 1996.<strong>Pleasant</strong> <strong>Bay</strong> <strong>Resource</strong> Management Plan (2008 Update). <strong>Pleasant</strong> <strong>Bay</strong> <strong>Resource</strong> Management Alliance <strong>and</strong> Ridley & Associates, Inc.,March 2008.Websites:United States Environmental Protection Agencyhttp://water.epa.govNational Oceanic <strong>and</strong> Atmospheric Admininstrationhttp://www.noaa.gov/The <strong>Coastal</strong> Portal Fl<strong>and</strong>ers Marine Institutehttp://www.coastalwiki.orgUnited States Geological Survey (USGS) <strong>Coastal</strong> <strong>and</strong> Marine Geology Programhttp://marine.usgs.govDictionary.comhttp://dictionary.reference.com37<strong>Pleasant</strong> <strong>Bay</strong> Alliance 2011
<strong>Coastal</strong> <strong>Resource</strong> <strong>Guide</strong> for <strong>Pleasant</strong> <strong>Bay</strong> <strong>and</strong> <strong>Chatham</strong> HarborMapsPage 39 Map 1 <strong>Pleasant</strong> <strong>Bay</strong> Region <strong>and</strong> Study AreaShoreline ChangePage 40 Map 2A NorthPage 41 Map 2B WestPage 42 Map 2C MidPage 43 Map 2D SouthSediment MovementPage 44 Map 3A <strong>Bay</strong>widePage 45 Map 3B NorthPage 46 Map 3C WestPage 47 Map 3D MidPage 48 Map 3E SouthShoreline StructuresPage 49 Map 4A NorthPage 50 Map 4B WestPage 51 Map 4C MidPage 52 Map 4D SouthPage 53 Map 5 Docks <strong>and</strong> PiersPage 54 Map 6 His<strong>to</strong>ric Hurricane PathsPage 55 Map 7 FEMA Flood ZonesPage 56 Map 8 Public Access PointsPage 57 Map 9 Surficial Geology<strong>Coastal</strong> Wetl<strong>and</strong> <strong>Resource</strong>sPage 58 Map 10A NorthPage 59 Map 10B WestPage 60 Map 10C MidPage 61 Map 10D SouthPage 62 Map 11 Areas of Critical Marine HabitatPage 63 Map 12 Eelgrass CoveragePage 64 Map 13 Fish <strong>and</strong> WildlifePage 65 Map 14 Rare Species HabitatPage 66 Map 15 Shellfish Suitability AreasPage 67 Map 16 HESP Priority <strong>and</strong> Estimated HabitatBathymetry Data for Navigational ChannelsPage 68 Map 17A <strong>Bay</strong> wide data coveragePage 69 Map 17B Meetinghouse PondPage 70 Map 17C Arey’s PondPage 71 Map 17D Paw Wah PondPage 72 Map 17E Quanset PondPage 73 Map 17F Round CovePage 74 Map 17G Crows PondPage 75 Map 17H Bassing HarborPage 76 Map 17 I Ministers PointPage 77 Map 18 His<strong>to</strong>ric Navigation Channels, Areas of Maintenance Dredging <strong>and</strong> Possible Area of Shoaling38<strong>Pleasant</strong> <strong>Bay</strong> Alliance 2011
<strong>Coastal</strong> <strong>Resource</strong> <strong>Guide</strong> for <strong>Pleasant</strong> <strong>Bay</strong> <strong>and</strong> <strong>Chatham</strong> Harbor39Map 1<strong>Pleasant</strong> <strong>Bay</strong> Alliance 2011
<strong>Coastal</strong> <strong>Resource</strong> <strong>Guide</strong> for <strong>Pleasant</strong> <strong>Bay</strong> <strong>and</strong> <strong>Chatham</strong> Harbor<strong>Pleasant</strong> <strong>Bay</strong> AtlasNorthShoreline ChangeBased on the MarshlineErosionWithin theRange of UncertaintyAccretionµ0 0.125 0.25 0.5Miles0 0.25 0.5 1KilometersThe information depicted on these mapsis for planning purposes only. It is notadequate for legal boundary definition,regula<strong>to</strong>ry interpretation, or parcel levelanalysis. It should not substitute foractual on-site survey, or supersededeed research.<strong>Pleasant</strong> <strong>Bay</strong> Alliance 2011Map 2A40
<strong>Coastal</strong> <strong>Resource</strong> <strong>Guide</strong> for <strong>Pleasant</strong> <strong>Bay</strong> <strong>and</strong> <strong>Chatham</strong> Harbor<strong>Pleasant</strong> <strong>Bay</strong> AtlasWestShoreline ChangeBased on the MarshlineErosionWithin theRange of UncertaintyAccretionµ0 0.125 0.25 0.5Miles0 0.25 0.5 1KilometersThe information depicted on these mapsis for planning purposes only. It is notadequate for legal boundary definition,regula<strong>to</strong>ry interpretation, or parcel levelanalysis. It should not substitute foractual on-site survey, or supersededeed research.41Map 2B<strong>Pleasant</strong> <strong>Bay</strong> Alliance 2011
<strong>Coastal</strong> <strong>Resource</strong> <strong>Guide</strong> for <strong>Pleasant</strong> <strong>Bay</strong> <strong>and</strong> <strong>Chatham</strong> Harbor0 0.250.5 1Miles0 0.25 0.5 1KilometersThe information depicted on these maps is for planning purposes only.It is not adequate for legal boundary definition, regula<strong>to</strong>ryinterpretation, or parcel level analysis. It should not substitute foractual on-site survey, or supersede deed research.µ<strong>Pleasant</strong> <strong>Bay</strong> Alliance 2011<strong>Pleasant</strong> <strong>Bay</strong> Atlas: MidShoreline ChangeBased on the MarshlineErosionWithin the Range of UncertaintyAccretionMap 2C42
<strong>Coastal</strong> <strong>Resource</strong> <strong>Guide</strong> for <strong>Pleasant</strong> <strong>Bay</strong> <strong>and</strong> <strong>Chatham</strong> Harbor<strong>Pleasant</strong> <strong>Bay</strong> AtlasSouthShoreline ChangeBased on the MarshlineErosionWithin theRange of UncertaintyAccretionµ0 0.125 0.25 0.5Miles0 0.25 0.5 1KilometersThe information depicted on these mapsis for planning purposes only. It is notadequate for legal boundary definition,regula<strong>to</strong>ry interpretation, or parcel levelanalysis. It should not substitute foractual on-site survey, or supersededeed research.43Map 2D<strong>Pleasant</strong> <strong>Bay</strong> Alliance 2011
<strong>Coastal</strong> <strong>Resource</strong> <strong>Guide</strong> for <strong>Pleasant</strong> <strong>Bay</strong> <strong>and</strong> <strong>Chatham</strong> Harbor45Map 3B<strong>Pleasant</strong> <strong>Bay</strong> Alliance 2011
<strong>Coastal</strong> <strong>Resource</strong> <strong>Guide</strong> for <strong>Pleasant</strong> <strong>Bay</strong> <strong>and</strong> <strong>Chatham</strong> Harbor<strong>Pleasant</strong> <strong>Bay</strong> Alliance 2011Map 3C46
<strong>Coastal</strong> <strong>Resource</strong> <strong>Guide</strong> for <strong>Pleasant</strong> <strong>Bay</strong> <strong>and</strong> <strong>Chatham</strong> Harbor47Map 3D<strong>Pleasant</strong> <strong>Bay</strong> Alliance 2011
<strong>Coastal</strong> <strong>Resource</strong> <strong>Guide</strong> for <strong>Pleasant</strong> <strong>Bay</strong> <strong>and</strong> <strong>Chatham</strong> Harbor<strong>Pleasant</strong> <strong>Bay</strong> Alliance 2011Map 3E48
<strong>Coastal</strong> <strong>Resource</strong> <strong>Guide</strong> for <strong>Pleasant</strong> <strong>Bay</strong> <strong>and</strong> <strong>Chatham</strong> Harbor49Map 4A<strong>Pleasant</strong> <strong>Bay</strong> Alliance 2011
<strong>Coastal</strong> <strong>Resource</strong> <strong>Guide</strong> for <strong>Pleasant</strong> <strong>Bay</strong> <strong>and</strong> <strong>Chatham</strong> Harbor<strong>Pleasant</strong> <strong>Bay</strong> Alliance 2011Map 4B50
<strong>Coastal</strong> <strong>Resource</strong> <strong>Guide</strong> for <strong>Pleasant</strong> <strong>Bay</strong> <strong>and</strong> <strong>Chatham</strong> Harbor51Map 4C<strong>Pleasant</strong> <strong>Bay</strong> Alliance 2011
<strong>Coastal</strong> <strong>Resource</strong> <strong>Guide</strong> for <strong>Pleasant</strong> <strong>Bay</strong> <strong>and</strong> <strong>Chatham</strong> Harbor<strong>Pleasant</strong> <strong>Bay</strong> Alliance 2011Map 4D52
<strong>Coastal</strong> <strong>Resource</strong> <strong>Guide</strong> for <strong>Pleasant</strong> <strong>Bay</strong> <strong>and</strong> <strong>Chatham</strong> Harbor53Map 5<strong>Pleasant</strong> <strong>Bay</strong> Alliance 2011
<strong>Coastal</strong> <strong>Resource</strong> <strong>Guide</strong> for <strong>Pleasant</strong> <strong>Bay</strong> <strong>and</strong> <strong>Chatham</strong> Harbor<strong>Pleasant</strong> <strong>Bay</strong> Alliance 201154Map 6
<strong>Coastal</strong> <strong>Resource</strong> <strong>Guide</strong> for <strong>Pleasant</strong> <strong>Bay</strong> <strong>and</strong> <strong>Chatham</strong> Harbor55Map 7<strong>Pleasant</strong> <strong>Bay</strong> Alliance 2011
<strong>Coastal</strong> <strong>Resource</strong> <strong>Guide</strong> for <strong>Pleasant</strong> <strong>Bay</strong> <strong>and</strong> <strong>Chatham</strong> Harbor<strong>Pleasant</strong> <strong>Bay</strong> Alliance 2011Map 856
<strong>Coastal</strong> <strong>Resource</strong> <strong>Guide</strong> for <strong>Pleasant</strong> <strong>Bay</strong> <strong>and</strong> <strong>Chatham</strong> Harbor57Map 9<strong>Pleasant</strong> <strong>Bay</strong> Alliance 2011
<strong>Coastal</strong> <strong>Resource</strong> <strong>Guide</strong> for <strong>Pleasant</strong> <strong>Bay</strong> <strong>and</strong> <strong>Chatham</strong> Harbor<strong>Pleasant</strong> <strong>Bay</strong> Alliance 2011Map 10A58
<strong>Coastal</strong> <strong>Resource</strong> <strong>Guide</strong> for <strong>Pleasant</strong> <strong>Bay</strong> <strong>and</strong> <strong>Chatham</strong> Harbor59Map 10B<strong>Pleasant</strong> <strong>Bay</strong> Alliance 2011
<strong>Coastal</strong> <strong>Resource</strong> <strong>Guide</strong> for <strong>Pleasant</strong> <strong>Bay</strong> <strong>and</strong> <strong>Chatham</strong> Harbor<strong>Pleasant</strong> <strong>Bay</strong> Alliance 2011Map 10C60
<strong>Coastal</strong> <strong>Resource</strong> <strong>Guide</strong> for <strong>Pleasant</strong> <strong>Bay</strong> <strong>and</strong> <strong>Chatham</strong> Harbor61Map 10D<strong>Pleasant</strong> <strong>Bay</strong> Alliance 2011
<strong>Coastal</strong> <strong>Resource</strong> <strong>Guide</strong> for <strong>Pleasant</strong> <strong>Bay</strong> <strong>and</strong> <strong>Chatham</strong> HarborSee page 26 for a description ofthe Areas of Critical Marine Habitat<strong>Pleasant</strong> <strong>Bay</strong> Alliance 2011Map 1162
<strong>Coastal</strong> <strong>Resource</strong> <strong>Guide</strong> for <strong>Pleasant</strong> <strong>Bay</strong> <strong>and</strong> <strong>Chatham</strong> Harbor63Map 12<strong>Pleasant</strong> <strong>Bay</strong> Alliance 2011
<strong>Coastal</strong> <strong>Resource</strong> <strong>Guide</strong> for <strong>Pleasant</strong> <strong>Bay</strong> <strong>and</strong> <strong>Chatham</strong> Harbor<strong>Pleasant</strong> <strong>Bay</strong> Alliance 2011Map 1364
<strong>Coastal</strong> <strong>Resource</strong> <strong>Guide</strong> for <strong>Pleasant</strong> <strong>Bay</strong> <strong>and</strong> <strong>Chatham</strong> Harbor65Map 14<strong>Pleasant</strong> <strong>Bay</strong> Alliance 2011
<strong>Coastal</strong> <strong>Resource</strong> <strong>Guide</strong> for <strong>Pleasant</strong> <strong>Bay</strong> <strong>and</strong> <strong>Chatham</strong> Harbor<strong>Pleasant</strong> <strong>Bay</strong> Alliance 2011Map 1566
<strong>Coastal</strong> <strong>Resource</strong> <strong>Guide</strong> for <strong>Pleasant</strong> <strong>Bay</strong> <strong>and</strong> <strong>Chatham</strong> Harbor67Map 16<strong>Pleasant</strong> <strong>Bay</strong> Alliance 2011
<strong>Coastal</strong> <strong>Resource</strong> <strong>Guide</strong> for <strong>Pleasant</strong> <strong>Bay</strong> <strong>and</strong> <strong>Chatham</strong> Harbor<strong>Pleasant</strong> <strong>Bay</strong> Alliance 2011Map 17A68
<strong>Coastal</strong> <strong>Resource</strong> <strong>Guide</strong> for <strong>Pleasant</strong> <strong>Bay</strong> <strong>and</strong> <strong>Chatham</strong> Harbor69Map 17B<strong>Pleasant</strong> <strong>Bay</strong> Alliance 2011
<strong>Coastal</strong> <strong>Resource</strong> <strong>Guide</strong> for <strong>Pleasant</strong> <strong>Bay</strong> <strong>and</strong> <strong>Chatham</strong> Harbor<strong>Pleasant</strong> <strong>Bay</strong> Alliance 2011Map 17C70
<strong>Coastal</strong> <strong>Resource</strong> <strong>Guide</strong> for <strong>Pleasant</strong> <strong>Bay</strong> <strong>and</strong> <strong>Chatham</strong> Harbor71Map 17D<strong>Pleasant</strong> <strong>Bay</strong> Alliance 2011
<strong>Coastal</strong> <strong>Resource</strong> <strong>Guide</strong> for <strong>Pleasant</strong> <strong>Bay</strong> <strong>and</strong> <strong>Chatham</strong> Harbor<strong>Pleasant</strong> <strong>Bay</strong> Alliance 2011Map 17E72
<strong>Coastal</strong> <strong>Resource</strong> <strong>Guide</strong> for <strong>Pleasant</strong> <strong>Bay</strong> <strong>and</strong> <strong>Chatham</strong> Harbor73Map 17F<strong>Pleasant</strong> <strong>Bay</strong> Alliance 2011
<strong>Coastal</strong> <strong>Resource</strong> <strong>Guide</strong> for <strong>Pleasant</strong> <strong>Bay</strong> <strong>and</strong> <strong>Chatham</strong> Harbor<strong>Pleasant</strong> <strong>Bay</strong> Alliance 2011Map 17G74
<strong>Coastal</strong> <strong>Resource</strong> <strong>Guide</strong> for <strong>Pleasant</strong> <strong>Bay</strong> <strong>and</strong> <strong>Chatham</strong> Harbor75Map 17H<strong>Pleasant</strong> <strong>Bay</strong> Alliance 2011
<strong>Coastal</strong> <strong>Resource</strong> <strong>Guide</strong> for <strong>Pleasant</strong> <strong>Bay</strong> <strong>and</strong> <strong>Chatham</strong> Harbor<strong>Pleasant</strong> <strong>Bay</strong> Alliance 2011Map 17 I76
<strong>Coastal</strong> <strong>Resource</strong> <strong>Guide</strong> for <strong>Pleasant</strong> <strong>Bay</strong> <strong>and</strong> <strong>Chatham</strong> Harbor77Map 18<strong>Pleasant</strong> <strong>Bay</strong> Alliance 2011