Coastal Resource Guide Pleasant Bay and ... - Town to Chatham
Coastal Resource Guide Pleasant Bay and ... - Town to Chatham
Coastal Resource Guide Pleasant Bay and ... - Town to Chatham

You also want an ePaper? Increase the reach of your titles
YUMPU automatically turns print PDFs into web optimized ePapers that Google loves.
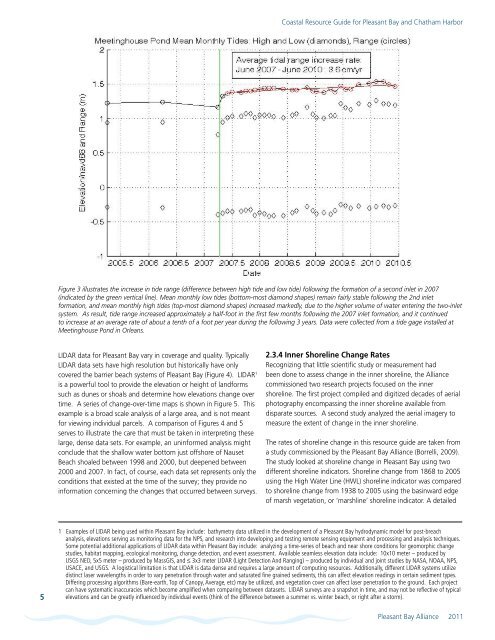
<strong>Coastal</strong> <strong>Resource</strong> <strong>Guide</strong> for <strong>Pleasant</strong> <strong>Bay</strong> <strong>and</strong> <strong>Chatham</strong> HarborFigure 3 illustrates the increase in tide range (difference between high tide <strong>and</strong> low tide) following the formation of a second inlet in 2007(indicated by the green vertical line). Mean monthly low tides (bot<strong>to</strong>m-most diamond shapes) remain fairly stable following the 2nd inletformation, <strong>and</strong> mean monthly high tides (<strong>to</strong>p-most diamond shapes) increased markedly, due <strong>to</strong> the higher volume of water entering the two-inletsystem. As result, tide range increased approximately a half-foot in the first few months following the 2007 inlet formation, <strong>and</strong> it continued<strong>to</strong> increase at an average rate of about a tenth of a foot per year during the following 3 years. Data were collected from a tide gage installed atMeetinghouse Pond in Orleans.LIDAR data for <strong>Pleasant</strong> <strong>Bay</strong> vary in coverage <strong>and</strong> quality. TypicallyLIDAR data sets have high resolution but his<strong>to</strong>rically have onlycovered the barrier beach systems of <strong>Pleasant</strong> <strong>Bay</strong> (Figure 4). LIDAR 1is a powerful <strong>to</strong>ol <strong>to</strong> provide the elevation or height of l<strong>and</strong>formssuch as dunes or shoals <strong>and</strong> determine how elevations change overtime. A series of change-over-time maps is shown in Figure 5. Thisexample is a broad scale analysis of a large area, <strong>and</strong> is not meantfor viewing individual parcels. A comparison of Figures 4 <strong>and</strong> 5serves <strong>to</strong> illustrate the care that must be taken in interpreting theselarge, dense data sets. For example, an uninformed analysis mightconclude that the shallow water bot<strong>to</strong>m just offshore of NausetBeach shoaled between 1998 <strong>and</strong> 2000, but deepened between2000 <strong>and</strong> 2007. In fact, of course, each data set represents only theconditions that existed at the time of the survey; they provide noinformation concerning the changes that occurred between surveys.2.3.4 Inner Shoreline Change RatesRecognizing that little scientific study or measurement hadbeen done <strong>to</strong> assess change in the inner shoreline, the Alliancecommissioned two research projects focused on the innershoreline. The first project compiled <strong>and</strong> digitized decades of aerialpho<strong>to</strong>graphy encompassing the inner shoreline available fromdisparate sources. A second study analyzed the aerial imagery <strong>to</strong>measure the extent of change in the inner shoreline.The rates of shoreline change in this resource guide are taken froma study commissioned by the <strong>Pleasant</strong> <strong>Bay</strong> Alliance (Borrelli, 2009).The study looked at shoreline change in <strong>Pleasant</strong> <strong>Bay</strong> using twodifferent shoreline indica<strong>to</strong>rs. Shoreline change from 1868 <strong>to</strong> 2005using the High Water Line (HWL) shoreline indica<strong>to</strong>r was compared<strong>to</strong> shoreline change from 1938 <strong>to</strong> 2005 using the basinward edgeof marsh vegetation, or ‘marshline’ shoreline indica<strong>to</strong>r. A detailed51 Examples of LIDAR being used within <strong>Pleasant</strong> <strong>Bay</strong> include: bathymetry data utilized in the development of a <strong>Pleasant</strong> <strong>Bay</strong> hydrodynamic model for post-breachanalysis, elevations serving as moni<strong>to</strong>ring data for the NPS, <strong>and</strong> research in<strong>to</strong> developing <strong>and</strong> testing remote sensing equipment <strong>and</strong> processing <strong>and</strong> analysis techniques.Some potential additional applications of LIDAR data within <strong>Pleasant</strong> <strong>Bay</strong> include: analyzing a time-series of beach <strong>and</strong> near shore conditions for geomorphic changestudies, habitat mapping, ecological moni<strong>to</strong>ring, change detection, <strong>and</strong> event assessment. Available seamless elevation data include: 10x10 meter – produced byUSGS NED, 5x5 meter – produced by MassGIS, <strong>and</strong> ≤ 3x3 meter LIDAR (Light Detection And Ranging) – produced by individual <strong>and</strong> joint studies by NASA, NOAA, NPS,USACE, <strong>and</strong> USGS. A logistical limitation is that LIDAR is data dense <strong>and</strong> requires a large amount of computing resources. Additionally, different LIDAR systems utilizedistinct laser wavelengths in order <strong>to</strong> vary penetration through water <strong>and</strong> saturated fine grained sediments, this can affect elevation readings in certain sediment types.Differing processing algorithms (Bare-earth, Top of Canopy, Average, etc) may be utilized, <strong>and</strong> vegetation cover can affect laser penetration <strong>to</strong> the ground. Each projectcan have systematic inaccuracies which become amplified when comparing between datasets. LIDAR surveys are a snapshot in time, <strong>and</strong> may not be reflective of typicalelevations <strong>and</strong> can be greatly influenced by individual events (think of the difference between a summer vs. winter beach, or right after a s<strong>to</strong>rm).<strong>Pleasant</strong> <strong>Bay</strong> Alliance 2011