Understanding the Cost Factors of Wastewater Treatment & Disposal
Understanding the Cost Factors of Wastewater Treatment & Disposal
Understanding the Cost Factors of Wastewater Treatment & Disposal

You also want an ePaper? Increase the reach of your titles
YUMPU automatically turns print PDFs into web optimized ePapers that Google loves.
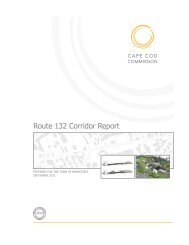
CAPE COD<br />
Regional <strong>Wastewater</strong> Management Plan<br />
<strong>Understanding</strong> <strong>the</strong> <strong>Cost</strong> <strong>Factors</strong> <strong>of</strong><br />
<strong>Wastewater</strong> <strong>Treatment</strong> and <strong>Disposal</strong><br />
MARCH 2013
Table <strong>of</strong> Contents<br />
INTRODUCTION......................................................................1<br />
COST COMPARISON OF ON-SITE, CLUSTER, SATELLITE, AND<br />
CENTRALIZED TREATMENT......................................................3<br />
COSTS OF ON-SITE SEPTIC SYSTEMS...............................3<br />
COMPARATIVE COSTS OF CLUSTER, SATELLITE, AND<br />
CENTRALIZED FACILITIES .........................................5<br />
COLLECTION COSTS........................................................6<br />
COSTS PER POUND OF NITROGEN REMOVED AND<br />
SENSITIVITY ANALYSIS..............................................6<br />
GUIDANCE ON SELECTING DIFFERENT-SIZED SOLUTIONS........9<br />
APPLICABILITY OF INDIVIDUAL NITROGEN-REMOVING<br />
SYSTEMS...................................................................9<br />
APPLICABILITY OF CLUSTER SYSTEMS...........................10<br />
APPLICABILITY OF SATELLITE SYSTEMS.........................11<br />
APPLICABILITY OF CENTRALIZED SYSTEMS....................12
Introduction<br />
In most areas <strong>of</strong> <strong>the</strong> United States, including most <strong>of</strong> Massachusetts,<br />
centralized wastewater treatment plants and sewers—most <strong>of</strong>ten organized<br />
and managed on a regional basis—are used to treat and dispose <strong>of</strong><br />
wastewater. Until <strong>the</strong> early 1980s, <strong>the</strong> federal government covered much<br />
<strong>of</strong> <strong>the</strong> capital cost <strong>of</strong> construction <strong>of</strong> that wastewater infrastructure, with<br />
homeowners covering operation and maintenance (O&M) costs through<br />
taxes and betterments.<br />
In contrast, <strong>the</strong> vast majority <strong>of</strong> all properties on Cape Cod rely on on-site<br />
wastewater disposal, with <strong>the</strong> typical costs being a one-time expense for<br />
installation <strong>of</strong> an on-site septic system (if new construction) and periodic<br />
pumping <strong>of</strong> <strong>the</strong> system. Towns manage <strong>the</strong> few larger, <strong>of</strong>f-site facilities,<br />
and treatment covers only small areas <strong>of</strong> those towns.<br />
The Regional <strong>Wastewater</strong> Management Plan’s Technology Assessment<br />
sections (Conventional and Green Infrastructure and Alternative<br />
Approaches) explored <strong>the</strong> suite <strong>of</strong> options available to treat and dispose<br />
<strong>of</strong> wastewater. For many <strong>of</strong> <strong>the</strong> more innovative options, it is difficult to<br />
estimate <strong>the</strong> costs because <strong>the</strong>y are specific to <strong>the</strong> location or are undetermined.<br />
For example, <strong>the</strong> cost <strong>of</strong> widening an inlet or dredging to increase<br />
tidal flushing depends on <strong>the</strong> physics and morphology <strong>of</strong> <strong>the</strong> particular<br />
estuarine system. The use <strong>of</strong> eco-toilets may require multiple installations<br />
in a single dwelling, a contract for removal <strong>of</strong> <strong>the</strong> waste materials, and, if<br />
to be used extensively in <strong>the</strong> region, <strong>the</strong> creation <strong>of</strong> an industry to collect<br />
and process <strong>the</strong> waste materials as fertilizer.<br />
Much more information is available about <strong>the</strong> costs <strong>of</strong> conventional treatment<br />
technologies from individual on-site septic systems to large centralized<br />
wastewater treatment facilities. This information can be used to<br />
provide guidance on three overarching questions:<br />
• What is <strong>the</strong> difference in cost between using a number <strong>of</strong><br />
smaller treatment systems instead <strong>of</strong> larger centralized wastewater<br />
treatment plants?<br />
• Are <strong>the</strong>re potential cost savings from regionalization?<br />
• What are <strong>the</strong> ramifications <strong>of</strong> additional growth on <strong>the</strong> cost <strong>of</strong><br />
wastewater infrastructure?<br />
REGIONAL WASTEWATER MANAGEMENT PLAN | UNDERSTANDING COST FACTORS 1
This document explores <strong>the</strong>se questions. Information from <strong>the</strong> 2010<br />
Barnstable County <strong>Wastewater</strong> <strong>Cost</strong> Task Force study is used to answer<br />
<strong>the</strong> first question. Information from <strong>the</strong> Regional <strong>Wastewater</strong> Management<br />
Plan: Cape-wide <strong>Cost</strong> Estimates is used to answer <strong>the</strong> last two.<br />
Many terms have been used to describe different sizes and kinds <strong>of</strong> traditional<br />
wastewater treatment facilities, including centralized, satellite, cluster,<br />
and individual on-site. These terms will be used in this document as well, and<br />
<strong>the</strong> amount <strong>of</strong> flow will determine <strong>the</strong> terminology used. Figure UCF-1 illustrates<br />
<strong>the</strong> different sizes and kinds <strong>of</strong> wastewater treatment facilities.<br />
• Centralized systems provide for most or all <strong>of</strong> a town’s wastewater<br />
management needs and might serve portions <strong>of</strong> neighboring<br />
towns (wastewater flows in excess <strong>of</strong> 300,000 gallons<br />
per day; require a groundwater discharge permit).<br />
• Satellite systems serve from 30 to 1,000 homes and are intended<br />
to treat and dispose <strong>of</strong> wastewater from one area (wastewater<br />
flows between 10,000 gallons per day and 300,000 gallons per<br />
day; require a groundwater discharge permit).<br />
• Cluster systems serve up to approximately 30 homes with<br />
aggregate wastewater flows less than 10,000 gallons per day,<br />
regulated under Title 5.<br />
• Individual on-site systems serve one property and are located<br />
on <strong>the</strong> parcel where <strong>the</strong> wastewater is generated, regulated<br />
under Title 5.<br />
<strong>Cost</strong>s <strong>of</strong> alternative and innovative systems are discussed later in this<br />
document.<br />
FIGURE UCF-1: Sizes and Kinds <strong>of</strong> <strong>Wastewater</strong> <strong>Treatment</strong><br />
2<br />
UNDERSTANDING COST FACTORS | REGIONAL WASTEWATER MANAGEMENT PLAN
<strong>Cost</strong> Comparison <strong>of</strong> On-Site, Cluster,<br />
Satellite, and Centralized <strong>Treatment</strong><br />
The Barnstable County <strong>Wastewater</strong> <strong>Cost</strong> Task Force summarized data<br />
on current costs to build and operate wastewater treatment systems <strong>of</strong><br />
different sizes on Cape Cod. Information for <strong>the</strong> analysis <strong>of</strong> satellite and<br />
centralized systems came from 24 treatment facilities, <strong>the</strong> majority <strong>of</strong><br />
which are located on Cape Cod and in sou<strong>the</strong>astern Massachusetts in<br />
areas with similar soil types and conditions. Information about individual<br />
on-site wastewater systems and cluster systems came from interviews<br />
with suppliers, contractors, and developers; data from <strong>the</strong> Massachusetts<br />
Alternative Septic System Center, which is administered by <strong>the</strong> Barnstable<br />
County Department <strong>of</strong> Health and Environment and is located at <strong>the</strong> Massachusetts<br />
Military Reservation; and reports from <strong>the</strong> New Jersey Pinelands<br />
Commission.<br />
COSTS OF ON-SITE SEPTIC SYSTEMS<br />
CONVENTIONAL TITLE 5 SYSTEMS<br />
<strong>Cost</strong>s <strong>of</strong> treating wastewater on site vary depending on <strong>the</strong> technology used and<br />
site conditions. Based on a mix <strong>of</strong> 3-bedroom (80%) and 4-bedroom (20%)<br />
homes consistent with an average <strong>of</strong> 3.2 bedrooms per dwelling unit, this study<br />
showed that <strong>the</strong> average replacement cost for a Title 5 system ranges from<br />
$8,000 to $15,000, and a mounded system could cost as much as $30,000.<br />
Massachusetts law allows a tax credit equal to 40% <strong>of</strong> <strong>the</strong> cost <strong>of</strong> design<br />
and construction <strong>of</strong> <strong>the</strong> repair or replacement <strong>of</strong> a failed septic system up<br />
to $15,000 for total expenses. The credit, up to $6,000, may be taken at a<br />
rate <strong>of</strong> no more than $1,500 per year over four years.<br />
REGIONAL WASTEWATER MANAGEMENT PLAN | UNDERSTANDING COST FACTORS 3
The Barnstable County Community Septic Management Program provides<br />
loans for <strong>the</strong> replacement <strong>of</strong> failed septic systems at 5% interest over<br />
20 years. Conditions include:<br />
• The loan is secured by a lien against <strong>the</strong> property.<br />
• The loan must be paid in full at <strong>the</strong> time <strong>of</strong> sale.<br />
• The program is restricted to residential properties.<br />
• There are income limitations.<br />
ADVANCED ON-SITE DENITRIFYING SEPTIC SYSTEMS<br />
Estimates <strong>of</strong> <strong>the</strong> cost <strong>of</strong> advanced denitrifying systems vary depending<br />
on <strong>the</strong> type <strong>of</strong> system and degree <strong>of</strong> nitrogen attenuation. The cost study<br />
referenced above estimated that an innovative/alternative (I/A) system that<br />
achieved an effluent nitrogen concentration <strong>of</strong> 19 milligrams per liter would<br />
cost an average <strong>of</strong> $24,000 with about $1,250 in annual operation and<br />
maintenance (O&M) costs. Individual advanced systems that achieved an<br />
effluent nitrogen concentration <strong>of</strong> 13 milligrams per liter were estimated to<br />
cost about $26,000, with $2,000 in annual maintenance expenses.<br />
COSTS OF ZERO-DISCHARGE SYSTEMS<br />
The cost <strong>of</strong> conventional on-site systems is based on <strong>the</strong> cost <strong>of</strong> <strong>the</strong><br />
effluent capture, discharge, and soil absorption components <strong>of</strong> <strong>the</strong> system—components<br />
that are located outside <strong>of</strong> <strong>the</strong> building. Composting<br />
and urine-diverting toilets, tight tanks, and incinerating toilets include<br />
those components for gray water only. <strong>Cost</strong>s for zero-discharge systems<br />
vary widely, depending on <strong>the</strong> kind <strong>of</strong> system installed and <strong>the</strong> number<br />
<strong>of</strong> systems installed. A single unit may cost less than $1,000, but <strong>the</strong> cost<br />
<strong>of</strong> retr<strong>of</strong>itting <strong>the</strong>m to an existing dwelling unit varies. For example, a<br />
two-story home with bathrooms on each floor but on opposite sides <strong>of</strong> <strong>the</strong><br />
home may require two units.<br />
4<br />
UNDERSTANDING COST FACTORS | REGIONAL WASTEWATER MANAGEMENT PLAN
COMPARATIVE COSTS OF CLUSTER, SATELLITE, AND<br />
CENTRALIZED FACILITIES<br />
To compare <strong>the</strong> costs <strong>of</strong> different sizes <strong>of</strong> wastewater treatment facilities,<br />
<strong>the</strong> capital costs <strong>of</strong> 24 wastewater treatment facilities and <strong>the</strong> O&M costs<br />
from 21 facilities were analyzed. The capital costs <strong>of</strong> each wastewater<br />
treatment facility was calculated as <strong>the</strong> sum <strong>of</strong>:<br />
• Basic construction costs for collection, transport to <strong>the</strong> treatment<br />
facility, treatment, transport to disposal, and disposal;<br />
• <strong>Cost</strong> <strong>of</strong> engineering, planning, design, permitting, legal<br />
expenses, and a contingency for unexpected construction items;<br />
and<br />
• Land costs, based on <strong>the</strong> nature and extent <strong>of</strong> <strong>the</strong> facilities.<br />
The costs <strong>of</strong> O&M included labor, electricity, chemicals, laboratory analysis,<br />
repairs, equipment replacement, and administrative costs, including<br />
insurance and sludge disposal. Unit costs were computed by dividing<br />
construction costs and O&M by <strong>the</strong> associated wastewater flow.<br />
The results, shown in Table UCF-1, clearly demonstrate that construction<br />
and O&M costs decline significantly as <strong>the</strong> system wastewater capacity<br />
increases. For more detailed information, see Figures 3 and 4 in <strong>the</strong> Barnstable<br />
County <strong>Cost</strong> Report.<br />
TABLE UCF-1: Unit Construction and O&M <strong>Cost</strong>s by Capacity (in gallons<br />
per day; gpd)<br />
CAPACITY UNIT CONSTRUCTION COST UNIT O&M COSTS<br />
10,000 gpd $70 per gpd <strong>of</strong> capacity $13 per gpd <strong>of</strong> average flow<br />
100,000 gpd $35 per gpd <strong>of</strong> capacity $5 per gpd <strong>of</strong> average flow<br />
1,000,000 gpd $17 per gpd <strong>of</strong> capacity $2 per gpd <strong>of</strong> average flow<br />
SOURCE: Barnstable County <strong>Wastewater</strong> <strong>Cost</strong> Task Force, “Comparison <strong>of</strong> <strong>Cost</strong>s for <strong>Wastewater</strong><br />
Management Systems Applicable to Cape Cod,” April 2010.<br />
REGIONAL WASTEWATER MANAGEMENT PLAN | UNDERSTANDING COST FACTORS 5
COLLECTION COSTS<br />
To estimate <strong>the</strong> cost <strong>of</strong> collection, data on <strong>the</strong> costs for gravity pipes,<br />
pressure pipes, grinder pumps, and pumping stations <strong>of</strong> various sizes<br />
were analyzed. It was assumed that 5% <strong>of</strong> <strong>the</strong> properties would require<br />
grinder pumps and that one pump station would be necessary for every<br />
100 properties. For more details, see Figure 5 in <strong>the</strong> Barnstable County<br />
<strong>Cost</strong> Report, which illustrates <strong>the</strong> relationship between density (distance<br />
between properties) and <strong>the</strong> cost <strong>of</strong> a collection system, shows that cost<br />
vary directly with density <strong>of</strong> development.<br />
COSTS PER POUND OF NITROGEN REMOVED AND<br />
SENSITIVITY ANALYSIS<br />
Based on a set <strong>of</strong> underlying assumptions (e.g., land costs, wastewater<br />
flows, transport distances, and disposal location, among o<strong>the</strong>rs), costs<br />
were estimated for 14 hypo<strong>the</strong>tical scenarios <strong>of</strong> different-sized systems.<br />
Capital costs for collection, transport, treatment, and disposal and O&M<br />
costs were calculated as was <strong>the</strong> equivalent annual cost (amortized capital<br />
cost plus O&M). Based on <strong>the</strong> efficacy <strong>of</strong> nitrogen removal <strong>of</strong> <strong>the</strong> different<br />
kinds <strong>of</strong> systems, an equivalent annual cost per pound <strong>of</strong> nitrogen<br />
removed was calculated.<br />
As shown in Table UCF-2, individual denitrifying systems have <strong>the</strong> lowest<br />
capital costs, primarily because <strong>the</strong>y do not require a collection system.<br />
Centralized systems and large satellite systems have <strong>the</strong> lowest O&M<br />
costs. Combining both capital and O&M costs into an equivalent annual<br />
cost per property, centralized systems are <strong>the</strong> least expensive, especially<br />
when nitrogen-removal capability is factored into <strong>the</strong> calculation.<br />
A sensitivity analysis was <strong>the</strong>n undertaken in which <strong>the</strong> underlying<br />
assumptions were changed for each <strong>of</strong> <strong>the</strong> 14 scenarios. As noted above,<br />
a very significant cost driver for wastewater infrastructure o<strong>the</strong>r than onsite<br />
systems is <strong>the</strong> cost <strong>of</strong> collection. Therefore <strong>the</strong> sensitivity analysis held<br />
collection costs constant across all scenarios.<br />
6<br />
UNDERSTANDING COST FACTORS | REGIONAL WASTEWATER MANAGEMENT PLAN
TABLE UCF-2: <strong>Cost</strong> per Pound <strong>of</strong> Nitrogen Removed Using Different Kinds<br />
<strong>of</strong> <strong>Wastewater</strong> <strong>Treatment</strong><br />
TYPE OF TREATMENT<br />
Individual Systems<br />
CAPITAL<br />
COST<br />
ESTIMATED COST<br />
PER PROPERTY SERVED<br />
ANNUAL<br />
O&M<br />
EQUIVALENT<br />
ANNUAL<br />
COST<br />
EQUIVALENT ANNUAL COST*<br />
PER POUND OF NITROGEN REMOVED<br />
DOLLARS ($)<br />
PER POUND<br />
OF NITROGEN<br />
PERCENT (%)<br />
PREMIUM OVER 3.0<br />
MILLION GALLONS-<br />
PER-DAY (MGD)<br />
CENTRALIZED SYSTEM<br />
Title 5 $13,000 $110 $1,150 Not applicable Not applicable<br />
Nitrogen-removing:<br />
Current Practice<br />
Nitrogen-removing:<br />
Enhanced Current Practice<br />
Nitrogen-removing:<br />
For TMDL Compliance<br />
Cluster Systems<br />
$24,000 $1,250 $3,180 $820 187%<br />
$26,000 $2,000 $4,090 $580 102%<br />
$28,000 $3,200 $5,450 $770 169%<br />
Current Practice $48,300 $1,050 $4,920 $820 186%<br />
For TMDL Compliance $52,000 $2,800 $6,940 $710 149%<br />
Satellite Systems<br />
50,000 gpd $55,100 $1,670 $6,080 $680 138%<br />
100,000 gpd $51,300 $1,360 $5,480 $590 109%<br />
200,000 gpd $47,700 $1,030 $4,860 $510 79%<br />
300,000 gpd $46,300 $860 $4,570 $470 64%<br />
Centralized Systems<br />
1.5 mgd $42,900 $500 $3,940 $305 7%<br />
3.0 mgd $40,900 $400 $3,680 $285 ——<br />
*NOTES:<br />
Equivalent annual costs are based on 5%, 20-year financing.<br />
Watershed-wide costs must consider <strong>the</strong> number <strong>of</strong> properties served and <strong>the</strong> average cost per property.<br />
SOURCE: Barnstable County <strong>Wastewater</strong> <strong>Cost</strong> Task Force, “Comparison <strong>of</strong> <strong>Cost</strong>s for <strong>Wastewater</strong> Management Systems<br />
Applicable to Cape Cod,” April 2010.<br />
REGIONAL WASTEWATER MANAGEMENT PLAN | UNDERSTANDING COST FACTORS 7
TABLE UCF-3: <strong>Cost</strong> per Pound <strong>of</strong> Nitrogen Removed, by System<br />
TREATMENT SYSTEM LOW BASE CASE HIGH<br />
Individual N-removing Systems $550 $770 $830<br />
Cluster Systems – 8,800 gpd $500 $710 $790<br />
Satellite Systems – 50,000 gpd $480 $680 $720<br />
Satellite Systems – 200,000 gpd $380 $510 $550<br />
Centralized Systems – 1.5 mgd $250 $305 $319<br />
Centralized Systems – 3.0 mgd $230 $285 $295<br />
SOURCE: Barnstable County <strong>Wastewater</strong> <strong>Cost</strong> Task Force, “Comparison <strong>of</strong> <strong>Cost</strong>s for <strong>Wastewater</strong><br />
Management Systems Applicable to Cape Cod,” April 2010.<br />
The results (Table UCF-3) showed that larger systems were significantly<br />
less expensive per gallon <strong>of</strong> wastewater flow treated.<br />
The sensitivity analysis revealed <strong>the</strong> effects <strong>of</strong> different assumptions on<br />
overall system costs. The most important factors were:<br />
• Economies <strong>of</strong> Scale: Many cost components do not increase<br />
directly as flow increases.<br />
• Density <strong>of</strong> Development: Collection is <strong>the</strong> most expensive<br />
component <strong>of</strong> wastewater infrastructure; <strong>the</strong>refore densely<br />
developed areas are <strong>the</strong> most cost effective as sewer length is<br />
minimized.<br />
• Location <strong>of</strong> Effluent <strong>Disposal</strong> Sites: <strong>Disposal</strong> in a watershed<br />
that requires nitrogen removal will be more expensive because<br />
more properties will require sewering to remove enough additional<br />
nitrogen that o<strong>the</strong>rwise would be returned in <strong>the</strong> effluent.<br />
<strong>Disposal</strong> in Zone IIs requires an increased level <strong>of</strong> treatment,<br />
and <strong>the</strong> associated cost <strong>of</strong>ten discourages disposal in<br />
<strong>the</strong>se areas.<br />
• Land <strong>Cost</strong>s: Suitable land is scarce and expensive. Town-owned<br />
land or dual use <strong>of</strong> sites such as golf courses and ball fields can<br />
reduce costs. Town-owned land is especially important if a<br />
number <strong>of</strong> small systems are built, each with its own setbacks<br />
and buffer zones.<br />
8<br />
UNDERSTANDING COST FACTORS | REGIONAL WASTEWATER MANAGEMENT PLAN
Guidance on Selecting<br />
Different-sized Solutions<br />
The report also suggested <strong>the</strong> conditions most favorable for or least favorable<br />
for individual denitrifying, cluster, satellite, or centralized systems.<br />
APPLICABILITY OF INDIVIDUAL NITROGEN-REMOVING<br />
SYSTEMS<br />
Individual denitrifying septic systems cannot provide <strong>the</strong> sole means <strong>of</strong><br />
Total Maximum Daily Load (TMDL) compliance for a number <strong>of</strong> reasons.<br />
The capability <strong>of</strong> <strong>the</strong>se systems to provide significant nitrogen removal<br />
restricts <strong>the</strong>ir applicability to watersheds where <strong>the</strong> necessary septic nitrogen<br />
removal is less than about 50%. Very large numbers <strong>of</strong> such systems<br />
would need to be built, at a very high cost, to contribute to a meaningful<br />
reduction in <strong>the</strong> nitrogen load <strong>of</strong> a watershed. The municipality would also<br />
need to undertake costly long-term monitoring to ensure <strong>the</strong> systems meet<br />
nitrogen-removal requirements and that systems are properly maintained.<br />
CONDITIONS MOST FAVORABLE<br />
The greatest benefit <strong>of</strong> individual denitrifying systems is <strong>the</strong> avoidance<br />
<strong>of</strong> a collection system because wastewater is treated and disposed on <strong>the</strong><br />
same parcel where it is generated. In areas where <strong>the</strong> average length <strong>of</strong><br />
collection pipe per property served would exceed 200 feet—and <strong>the</strong>refore<br />
be very costly to install—individual denitrifying systems should be evaluated,<br />
considering all costs as well as <strong>the</strong> administrative issues related to<br />
property access and TMDL compliance.<br />
CONDITIONS LEAST FAVORABLE<br />
On-site denitrifying systems are not applicable where septic nitrogencontrol<br />
needs exceed 50%. Even in watersheds where smaller percentages<br />
REGIONAL WASTEWATER MANAGEMENT PLAN | UNDERSTANDING COST FACTORS 9
<strong>of</strong> nitrogen removal are needed, <strong>the</strong> very high cost—greater than $550 per<br />
pound <strong>of</strong> nitrogen removed—should preclude <strong>the</strong>ir consideration unless<br />
<strong>the</strong> collection system requires more than 150 feet per connection.<br />
Unless larger-scale systems include very long transport distances to available<br />
treatment/disposal sites and effluent disposal must occur in very sensitive<br />
watersheds or in water supply Zone IIs, <strong>the</strong>se systems need not be<br />
evaluated in detail except for serving less densely developed areas where<br />
not more than 50% <strong>of</strong> septic nitrogen must be removed.<br />
APPLICABILITY OF CLUSTER SYSTEMS<br />
<strong>Wastewater</strong> treatment systems with flows less than 10,000 gallons per<br />
day are significantly more expensive to build and operate than larger systems,<br />
but <strong>the</strong>re are circumstances where <strong>the</strong>y can be applicable. Although<br />
<strong>the</strong> Massachusetts Department <strong>of</strong> Environmental Protection (MassDEP)<br />
is not inclined to allow a series <strong>of</strong> cluster systems as <strong>the</strong> primary means<br />
<strong>of</strong> TMDL compliance (for many reasons similar to <strong>the</strong> issues related to<br />
individual systems), developing cluster systems under <strong>the</strong> Groundwater<br />
Discharge Permit Program may address MassDEP’s concerns.<br />
CONDITIONS MOST FAVORABLE<br />
Cluster systems may be favorable in:<br />
• Existing neighborhoods where small lots would have low wastewater<br />
collection costs, that are remote from proposed sewered<br />
areas, and that have nearby publicly owned vacant land;<br />
• New cluster developments where a developer installs an alternative<br />
collection system and later turns <strong>the</strong> wastewater infrastructure<br />
over to <strong>the</strong> town;<br />
• Shore-front areas near small, poorly flushed embayments<br />
where a cluster system can provide an early benefit <strong>of</strong> nitrogen<br />
control and later be converted to a pumping station in future<br />
phases <strong>of</strong> a centralized system.<br />
10<br />
UNDERSTANDING COST FACTORS | REGIONAL WASTEWATER MANAGEMENT PLAN
Non-cost factors should also be considered, such as <strong>the</strong> need to maintain<br />
water balance within watersheds.<br />
CONDITIONS LEAST FAVORABLE<br />
Given <strong>the</strong>ir high cost—greater than $500 per pound <strong>of</strong> nitrogen<br />
removed—cluster systems do not warrant detailed consideration unless<br />
larger scale systems include very large transport distances to available<br />
treatment/disposal sites and effluent disposal occurs in very sensitive<br />
watersheds or in water supply Zone IIs.<br />
APPLICABILITY OF SATELLITE SYSTEMS<br />
Satellite systems are designed to serve portions <strong>of</strong> a town or large individual<br />
developments. (There are more than 50 satellite systems on Cape Cod,<br />
most <strong>of</strong> which are privately developed. Most <strong>of</strong> <strong>the</strong> publicly owned satellite<br />
plants serve schools, but <strong>the</strong> New Silver Beach facility in Falmouth is a<br />
good example <strong>of</strong> a municipal system serving a specific portion <strong>of</strong> a town.)<br />
CONDITIONS MOST FAVORABLE<br />
Satellite systems may be favorable in:<br />
• A watershed in need <strong>of</strong> nitrogen control that is more than five<br />
miles from <strong>the</strong> existing sewer system or o<strong>the</strong>r areas or need and<br />
that has nearby publicly owned vacant land;<br />
• New large-scale residential or commercial developments where<br />
<strong>the</strong> developer can install collection, treatment, and disposal<br />
facilities and later turn <strong>the</strong> infrastructure over to <strong>the</strong> town;<br />
• An existing or proposed private facility that can be taken over<br />
by <strong>the</strong> town and expanded to provide wastewater service to<br />
existing nearby properties currently on septic systems, particularly<br />
if <strong>the</strong> town-wide system may be available for many years<br />
and <strong>the</strong> developer is prepared to proceed in <strong>the</strong> near future.<br />
REGIONAL WASTEWATER MANAGEMENT PLAN | UNDERSTANDING COST FACTORS 11
Satellite systems <strong>of</strong> 150,000 gpd or larger have a distinct cost advantage<br />
over those 50,000 gpd and smaller.<br />
CONDITIONS LEAST FAVORABLE<br />
Satellite systems smaller than 100,000 gallons per day have limited<br />
applicability given <strong>the</strong>ir high cost—greater than $500 per pound <strong>of</strong> nitrogen<br />
removed. If centralized facilities exist or can be developed within<br />
five miles, satellite facilities do not warrant detailed consideration. If<br />
regionalization is possible and desirable, satellite options have an added<br />
disadvantage.<br />
APPLICABILITY OF CENTRALIZED SYSTEMS<br />
Centralizing wastewater infrastructure has both advantages and disadvantages<br />
from a cost perspective.<br />
CONDITIONS MOST FAVORABLE<br />
Centralized systems are likely to be <strong>the</strong> most viable wastewater systems<br />
where:<br />
• Dense development exists in nitrogen-sensitive watersheds,<br />
especially if <strong>the</strong>se areas are within three miles <strong>of</strong> suitable<br />
effluent treatment and disposal sites;<br />
• Suitable treatment and disposal sites (outside sensitive<br />
watersheds and Zone IIs) are available at no or low cost.<br />
• A high degree <strong>of</strong> nitrogen control is required, placing a cost<br />
premium on small-scale systems that discharge in sensitive<br />
watersheds.<br />
• Opportunities are available for cost reductions through<br />
regionalization (see <strong>the</strong> Cape-wide cost estimate for more<br />
information about cost savings).<br />
12<br />
UNDERSTANDING COST FACTORS | REGIONAL WASTEWATER MANAGEMENT PLAN
CONDITIONS LEAST FAVORABLE<br />
Centralized systems are generally not favorable where:<br />
• Development in nitrogen-sensitive watersheds is relatively sparse.<br />
• Effluent disposal sites are remote, costly, and in water supply<br />
Zone IIs or nitrogen-sensitive watersheds.<br />
• Only small amounts <strong>of</strong> nitrogen must be removed, allowing<br />
individual denitrifying systems to be applicable.<br />
• Water balance considerations favor local disposal.<br />
• Presence <strong>of</strong> nearby development or unacceptable impacts on<br />
natural resources preclude <strong>the</strong> use <strong>of</strong> o<strong>the</strong>rwise favorable sites.<br />
REGIONAL WASTEWATER MANAGEMENT PLAN | UNDERSTANDING COST FACTORS 13
CAPE COD REGIONAL WASTEWATER MANAGEMENT PLAN | UNDERSTANDING COST FACTORS<br />
MARCH 2013