Understanding the Cost Factors of Wastewater Treatment & Disposal
Understanding the Cost Factors of Wastewater Treatment & Disposal
Understanding the Cost Factors of Wastewater Treatment & Disposal

Create successful ePaper yourself
Turn your PDF publications into a flip-book with our unique Google optimized e-Paper software.
COMPARATIVE COSTS OF CLUSTER, SATELLITE, AND<br />
CENTRALIZED FACILITIES<br />
To compare <strong>the</strong> costs <strong>of</strong> different sizes <strong>of</strong> wastewater treatment facilities,<br />
<strong>the</strong> capital costs <strong>of</strong> 24 wastewater treatment facilities and <strong>the</strong> O&M costs<br />
from 21 facilities were analyzed. The capital costs <strong>of</strong> each wastewater<br />
treatment facility was calculated as <strong>the</strong> sum <strong>of</strong>:<br />
• Basic construction costs for collection, transport to <strong>the</strong> treatment<br />
facility, treatment, transport to disposal, and disposal;<br />
• <strong>Cost</strong> <strong>of</strong> engineering, planning, design, permitting, legal<br />
expenses, and a contingency for unexpected construction items;<br />
and<br />
• Land costs, based on <strong>the</strong> nature and extent <strong>of</strong> <strong>the</strong> facilities.<br />
The costs <strong>of</strong> O&M included labor, electricity, chemicals, laboratory analysis,<br />
repairs, equipment replacement, and administrative costs, including<br />
insurance and sludge disposal. Unit costs were computed by dividing<br />
construction costs and O&M by <strong>the</strong> associated wastewater flow.<br />
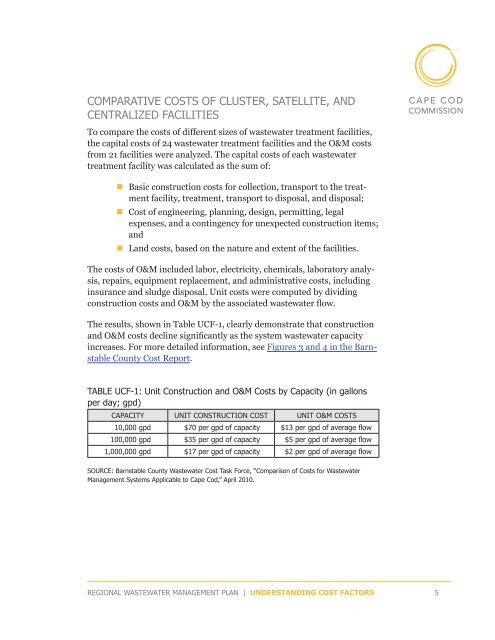
The results, shown in Table UCF-1, clearly demonstrate that construction<br />
and O&M costs decline significantly as <strong>the</strong> system wastewater capacity<br />
increases. For more detailed information, see Figures 3 and 4 in <strong>the</strong> Barnstable<br />
County <strong>Cost</strong> Report.<br />
TABLE UCF-1: Unit Construction and O&M <strong>Cost</strong>s by Capacity (in gallons<br />
per day; gpd)<br />
CAPACITY UNIT CONSTRUCTION COST UNIT O&M COSTS<br />
10,000 gpd $70 per gpd <strong>of</strong> capacity $13 per gpd <strong>of</strong> average flow<br />
100,000 gpd $35 per gpd <strong>of</strong> capacity $5 per gpd <strong>of</strong> average flow<br />
1,000,000 gpd $17 per gpd <strong>of</strong> capacity $2 per gpd <strong>of</strong> average flow<br />
SOURCE: Barnstable County <strong>Wastewater</strong> <strong>Cost</strong> Task Force, “Comparison <strong>of</strong> <strong>Cost</strong>s for <strong>Wastewater</strong><br />
Management Systems Applicable to Cape Cod,” April 2010.<br />
REGIONAL WASTEWATER MANAGEMENT PLAN | UNDERSTANDING COST FACTORS 5