PDF - Royal and Sun Alliance
PDF - Royal and Sun Alliance
PDF - Royal and Sun Alliance

Create successful ePaper yourself
Turn your PDF publications into a flip-book with our unique Google optimized e-Paper software.
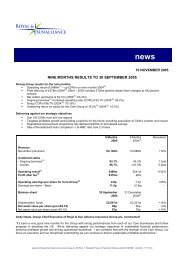
YEAR END RESULTS 2008<br />
26 February 2009<br />
Strong Group performance<br />
• Net written premiums of £6.5bn, up 11%<br />
• Combined operating ratio of 94.5%<br />
• Operating result of £867m, up 7%<br />
• Profit before tax of £759m, up 13%<br />
• Shareholders’ funds of £3.8bn, up 25%<br />
• IGD surplus up 13% to £1.7bn, representing coverage of 2.5x<br />
Delivery against strategic objectives<br />
• Strong results in challenging trading <strong>and</strong> economic conditions<br />
• Continuing to take the right action on rate <strong>and</strong> expenses<br />
• New UK expense savings target of £70m to be delivered by mid 2010, at a cost of £80m<br />
• Maintaining tight financial management<br />
• Strong balance sheet <strong>and</strong> capital position<br />
Outlook<br />
• Final dividend increased 10% to 4.98p, giving a full year dividend increase of 10%<br />
• Combined operating ratio for 2009 expected to be around 95%<br />
12 Months 12 Months Movement*<br />
2008 2007<br />
Net written premiums £6,462m £5,837m +11%<br />
Underwriting result £384m £278m +38%<br />
Combined operating ratio 94.5% 94.9% 0.4pts<br />
Operating result (1) £867m £814m +7%<br />
Profit before tax (1) £759m £670m +13%<br />
Profit after tax (1) £586m £628m** -7%<br />
31 December 31 December<br />
2008 2007<br />
Balance sheet<br />
Shareholders' funds £3,839m £3,077m +25%<br />
Net asset value per share 112p 91p +23%<br />
Net asset value per share excluding IAS19 101p 88p +15%<br />
Dividend for the year per ordinary share 7.71p 7.01p +10%<br />
* Reported exchange rate<br />
** Includes the release of £103m of deferred tax provisions in Codan<br />
Andy Haste, Group CEO of RSA, commented:<br />
“In a year of challenging trading conditions <strong>and</strong> volatile investment markets, we have once again delivered strong results<br />
<strong>and</strong> have strengthened the Group’s net asset <strong>and</strong> regulatory capital position. These results continue to demonstrate the<br />
positive impact of our tight operational <strong>and</strong> financial management <strong>and</strong> the benefit of the Group’s strong <strong>and</strong> diversified<br />
portfolio.<br />
We expect to continue to face challenging conditions going forward. However, with our ongoing actions <strong>and</strong> the strength<br />
of our portfolio <strong>and</strong> balance sheet, we remain confident of continuing to deliver sustainable profitable performance <strong>and</strong> we<br />
are well positioned to take advantage of market opportunities. As it st<strong>and</strong>s today, we expect to achieve a combined<br />
operating ratio for 2009 of around 95%. Given the strong performance in 2008, <strong>and</strong> our positive outlook for the Group, we<br />
have increased the final dividend by 10% to 4.98p (2007: 4.53p).”<br />
Issued by RSA Insurance Group plc, 9th Floor, One Plantation Place, 30 Fenchurch Street, London EC3M 3BD<br />
Telephone +44 (0)20 7111 7134, Facsimile +44 (0)20 7111 7451
For further information:<br />
Analysts<br />
Press<br />
Shona Cotterill<br />
Thomas Coops<br />
Tel: +44 (0) 20 7111 7212 Tel: +44 (0) 20 7111 7047<br />
Mobile: +44 (0) 7894 938600 Mobile: +44 (0) 7834 005605<br />
Claire Cordell<br />
Simon Kutner<br />
Tel: +44 (0) 20 7111 7138 Tel: +44 (0) 20 7111 7327<br />
Mobile: +44 (0) 7834 944204 Mobile: +44 (0) 7795 445656<br />
Suzannah Seddon<br />
Faeth Birch (Finsbury)<br />
Tel: +44 (0) 20 7111 7140 Tel: +44 (0) 20 7251 3801<br />
Mobile: +44 (0) 7779 298477 Mobile: +44 (0) 7810 505473<br />
CONTENTS<br />
PAGE<br />
Management report 3<br />
CEO review 3<br />
Operations review 5<br />
Summary consolidated income statement – management basis 10<br />
Summary consolidated balance sheet – management basis 11<br />
Other information – management basis 12<br />
Regional analysis of insurance operations 15<br />
Estimation techniques, risks, uncertainties <strong>and</strong> contingencies 17<br />
Condensed financial statements 21<br />
Responsibility statement 29<br />
Important disclaimer<br />
Visit www.rsagroup.com for more information.<br />
This press release (together with the Annual Report <strong>and</strong> Accounts referred to herein) has been prepared in accordance with the requirements of<br />
English Company Law <strong>and</strong> the liabilities of the directors in connection with this press release (together with the Annual Report <strong>and</strong> Accounts<br />
referred to herein) shall be subject to the limitations <strong>and</strong> restrictions provided by such law. This document may contain “forward-looking statements”<br />
(as defined in the US Private Securities Litigation Reform Act of 1995) with respect to certain of the Company’s plans <strong>and</strong> its current goals <strong>and</strong><br />
expectations relating to its future financial condition, performance <strong>and</strong> results. By their nature, all forward-looking statements involve risk <strong>and</strong><br />
uncertainty because they relate to future events <strong>and</strong> circumstances which are beyond the Company’s control, including amongst other things, UK<br />
domestic <strong>and</strong> global economic business conditions, market-related risks such as fluctuations in interest rates <strong>and</strong> exchange rates, the policies <strong>and</strong><br />
actions of regulatory authorities, the impact of competition, inflation, deflation, the timing impact <strong>and</strong> other uncertainties of future acquisitions or<br />
combinations within the relevant industries, as well as the impact of tax <strong>and</strong> other legislation <strong>and</strong> other regulations in the jurisdictions in which the<br />
Company <strong>and</strong> its affiliates operate. As a result, the Company’s actual future financial condition, performance <strong>and</strong> results may differ materially from<br />
the plans, goals <strong>and</strong> expectations set forth in the Company’s forward-looking statements. The Company undertakes no obligation to update any<br />
forward-looking statements, save in respect of any requirement under applicable law or regulation. Nothing in this press release (together with the<br />
Annual Report <strong>and</strong> Accounts referred to herein) should be construed as a profit forecast.<br />
(1)<br />
For a reconciliation of operating result to profit after tax see page 10.<br />
2 Ι RSA Ι 2008 Year End Results Ι 26 February 2009
MANAGEMENT REPORT<br />
CEO REVIEW<br />
The Group has delivered strong results in challenging trading, investment <strong>and</strong> economic conditions. Net written premiums<br />
are up 11% to £6.5bn (4% on constant exchange), with good underlying growth <strong>and</strong> the benefits of foreign exchange in<br />
International <strong>and</strong> Emerging Markets, <strong>and</strong> a disciplined approach in the UK. The underwriting result is up by 38% to<br />
£384m, reflecting the impact of management actions, while improved weather was partially offset by higher large losses.<br />
As expected, International contributed the majority of the Group’s underwriting result, with continued profitable<br />
performance in the UK <strong>and</strong> Emerging Markets. The combined operating ratio (COR) improved 0.4 points to 94.5% (2007:<br />
94.9%).<br />
The investment result is £594m (2007: £629m) <strong>and</strong> includes an 11% increase in investment income to £654m, offset by a<br />
lower level of total gains (£32m compared with £119m in 2007). The operating result is up 7% to £867m <strong>and</strong> profit before<br />
tax has increased by 13% to £759m. The 2008 tax charge is £173m compared with £29m in 2007, which included the<br />
release of £103m of deferred tax provisions in respect of the Sc<strong>and</strong>inavian security funds. Profit after tax is £586m (2007:<br />
£628m) <strong>and</strong> the underlying ROE is strong at 18.5%, compared with 21.3% in 2007, reflecting higher opening net assets.<br />
Shareholders’ funds have increased by 25% to £3.8bn, primarily reflecting after tax profits, foreign exchange, <strong>and</strong> the<br />
increase in the pension fund surplus. The capital position also remains strong, with the IGD surplus increasing by 13% to<br />
£1.7bn, representing coverage of 2.5 times the requirement.<br />
Business Overview<br />
Set out below are the net written premiums <strong>and</strong> combined operating ratios for our regions:<br />
Net written premiums<br />
Combined operating ratio<br />
12 Months 12 Months Movement Movement at 12 Months 12 Months Movement<br />
2008 2007 as reported constant 2008 2007<br />
exchange<br />
£m £m % % % % Points<br />
International 2,998 2,513 19 6 91.2 91.3 0.1<br />
UK 2,711 2,688 1 1 97.6 97.6 -<br />
Emerging Markets 738 615 20 7 96.4 95.3 (1.1)<br />
Group Re 15 21 (29) (29) - - -<br />
Total Group 6,462 5,837 11 4 94.5 94.9 0.4<br />
In International, net written premiums are up 19% to £3.0bn (6% on constant exchange), driven by organic growth, the<br />
impact of acquisitions <strong>and</strong> foreign exchange. In Sc<strong>and</strong>inavia, premiums are up by 16% to £1.6bn (3% on constant<br />
exchange), with good growth in Commercial, particularly in Denmark <strong>and</strong> Norway. In Canada, premiums have increased<br />
by 26% to around £0.9bn (15% on constant exchange), reflecting good organic growth <strong>and</strong> the strong performance of<br />
CNS, which we acquired in December 2007. Johnson continues to perform strongly, increasing premiums by 24% (14%<br />
on constant exchange). In Other Europe, premiums are up by 19% to £0.5bn (2% on constant exchange) with continued<br />
above market growth in Italy offset by a disciplined approach in Irel<strong>and</strong> where we are continuing to take action on rate <strong>and</strong><br />
capacity.<br />
In the UK, we are maintaining our strategy of targeting profitable growth, taking the right action on rate <strong>and</strong> selective<br />
capacity withdrawal. Total premiums are up 1% to £2.7bn. In Personal, premiums are up by 2% at £1.1bn, reflecting a<br />
good performance from MORE TH>N, with 2% premium growth, while, as expected, Affinity volumes continue to be<br />
impacted by lower new car sales <strong>and</strong> mortgage originations. In Commercial, premiums are in line with last year at £1.6bn,<br />
with strong growth in specialty lines offsetting the withdrawal of capacity in lines of business where we cannot achieve our<br />
target returns. We have continued to take action on rate, increasing Personal Motor rates by 6% <strong>and</strong> Household by 5%,<br />
<strong>and</strong> achieving increases in Commercial of 6% in Liability, 7% in Property <strong>and</strong> 8% in Motor. Overall retention remains<br />
strong at around 80%.<br />
In Emerging Markets, premiums are up by 20% to over £0.7bn (7% on constant exchange) <strong>and</strong> increased by 26% (12%<br />
on constant exchange) after excluding Venezuela, which we sold in December 2007. As noted in our interim results, we<br />
are seeing the impact of economic downturn <strong>and</strong> in response, we have taken a number of actions to protect profitability,<br />
including reducing headcount by around 400 (around 10% of the total workforce) across the region. In the Baltics,<br />
premiums are up by 21% (4% on constant exchange) <strong>and</strong> while growth has slowed as a result of economic conditions, we<br />
have taken a number of actions to protect profitability. In Asia <strong>and</strong> the Middle East, premiums are up by 43% (30% on<br />
constant exchange) with strong growth in UAE Motor <strong>and</strong> Construction <strong>and</strong> Engineering. In Latin America, premiums are<br />
up 22% (10% on constant exchange), after adjusting for the sale of Venezuela, reflecting double digit growth across Chile,<br />
Brazil, Argentina <strong>and</strong> Colombia. Across Emerging Markets, we are successfully implementing our Affinity strategy,<br />
signing 47 new deals in 2008.<br />
3 Ι RSA Ι 2008 Year End Results Ι 26 February 2009
Our associates in India <strong>and</strong> Intouch in Central <strong>and</strong> Eastern Europe continue to build momentum <strong>and</strong> premiums are up by<br />
37% to £140m (25% on constant exchange). Intouch has market leading direct operations in Pol<strong>and</strong>, the Czech Republic<br />
<strong>and</strong> Russia <strong>and</strong> in February 2009, we signed an agreement to acquire the remaining 50% of the business.<br />
The Emerging Markets region remains attractive with good long term potential, <strong>and</strong> we are on track to meet our target of<br />
increasing net written premiums to £1bn by the end of 2010.<br />
Across the Group, our objective is to continue delivering sustainable profitable performance <strong>and</strong> each of our regions has<br />
again delivered a strong underwriting result. International delivered a 27% increase in underwriting profit to £262m <strong>and</strong> a<br />
COR of 91.2%, primarily reflecting a strong performance in Sc<strong>and</strong>inavia, where underwriting profits were up 64% to<br />
£190m. In the UK, we have maintained good profitability, with an underwriting profit of £99m <strong>and</strong> a COR of 97.6%.<br />
Emerging Markets has delivered an underwriting result of £23m <strong>and</strong> a COR of 96.4%.<br />
We remain focused on improving operational efficiency <strong>and</strong> reducing costs. In the year, we achieved our 2008 expense<br />
savings target of £200m, <strong>and</strong> in Sc<strong>and</strong>inavia we are on track to deliver the additional £25m of expense savings<br />
announced at our Investor Day in May. In addition, today we have announced a new £70m expense savings target for the<br />
UK to be delivered by mid 2010, primarily through a reduction in headcount of 1,200. There will be a one off cost in 2009<br />
of £80m to deliver this, which will be treated as a reorganisation cost <strong>and</strong> will not be included in the Operating Result (as<br />
reported on the management basis). With these <strong>and</strong> other actions, we are targeting an expense ratio of around 14% by<br />
the end of 2012.<br />
Outlook<br />
We have again delivered strong results in challenging conditions. With our strong balance sheet, our management<br />
actions <strong>and</strong> diversified portfolio, we are delivering sustainable profitable performance.<br />
In 2009, we will continue to operate a high quality, low risk investment strategy. The investment result will be impacted by<br />
lower interest rates <strong>and</strong> continued investment market volatility, however, we will continue to take action to mitigate this<br />
impact. These actions <strong>and</strong> the geographic diversification of the portfolio will limit the full impact of falling yields, <strong>and</strong> in<br />
2009 we expect investment income to be around 2007 levels. Total gains will continue to be impacted by any further<br />
negative market movements in commercial property values as well as financial market volatility, <strong>and</strong> we are not<br />
anticipating a positive contribution from total gains in 2009.<br />
We will maintain our focus on underwriting discipline <strong>and</strong> targeted profitable growth. We are seeing signs of economic<br />
downturn across the Group, however, we are also seeing rates beginning to harden in a number of our key markets <strong>and</strong><br />
we continue to take action on rate <strong>and</strong> expenses. As it st<strong>and</strong>s today, we expect to deliver a combined operating ratio of<br />
around 95% in 2009.<br />
We remain confident about the outlook for the Group <strong>and</strong> we are well positioned to take advantage of market<br />
opportunities. Given the strong performance in 2008 <strong>and</strong> as a reflection of the Board’s confidence in the future<br />
performance of the Group, we are increasing the final dividend by 10% to 4.98p (2007: 4.53p).<br />
Andy Haste, Group CEO, RSA<br />
4 Ι RSA Ι 2008 Year End Results Ι 26 February 2009
OPERATIONS REVIEW<br />
Operating Result<br />
The operating result is up 7% to £867m (2007: £814m) <strong>and</strong> reflects an improved underwriting result, partially offset by a<br />
lower investment result due to the expected reduced level of total gains. The underwriting result of £384m (2007: £278m)<br />
represents another strong performance, with a current year underwriting profit of £93m (2007: underwriting loss £70m)<br />
<strong>and</strong> a prior year profit of £291m (2007: £348m). The improvement in the current year result reflects the continued benefits<br />
of management actions, while improved weather (£155m better than 2007) was offset by adverse large loss experience<br />
(£110m worse than 2007), primarily in the UK. The strong prior year result reflects continued positive run off from all three<br />
regions.<br />
The Group continues to adopt a prudent reserving policy for both current year <strong>and</strong> overall reserves. At 31 December<br />
2008, reserves remain significantly to the right side of best estimate.<br />
- International<br />
International continues to drive the Group forward <strong>and</strong> has again delivered a strong top <strong>and</strong> bottom line performance. Net<br />
written premiums are up 19% to £3.0bn (6% on constant exchange). This reflects 26% growth in Canada (15% on<br />
constant exchange), 16% growth in Sc<strong>and</strong>inavia (3% on constant exchange) <strong>and</strong> 19% growth in Other Europe (2% on<br />
constant exchange). As expected, International contributed the majority of the Group’s underwriting result, with a 27%<br />
increase in underwriting profit to £262m.<br />
In Sc<strong>and</strong>inavia, Commercial performed strongly, delivering a 19% increase in net written premiums to £727m (5% on<br />
constant exchange). This reflects good growth in Norway, <strong>and</strong> in SME, Marine <strong>and</strong> Renewable Energy in Denmark. In<br />
Personal lines, premiums are up 14% to £875m (1% on constant exchange) reflecting continued growth from WLI in<br />
Norway <strong>and</strong> good retention across the region.<br />
In Canada, Commercial net written premiums increased by 19% to £217m (9% on constant exchange) reflecting the CNS<br />
acquisition in December 2007 <strong>and</strong> continued strong retention. The integration of CNS is on track <strong>and</strong> the business is<br />
performing well with 80% of business retained. Personal net written premiums increased by 28% to £667m (18% on<br />
constant exchange). Growth in Personal Intermediated reflects positive rate, strong retention <strong>and</strong> CNS. Johnson, our<br />
direct personal business, continued to perform strongly, delivering 24% growth (14% on constant exchange), reflecting the<br />
acquisition of TJV in 2007 <strong>and</strong> the signing of 35 new sponsorship groups.<br />
In Other Europe, premiums are up by 19% to £512m (2% on constant exchange). In Italy, we continue to grow ahead of<br />
the market with premiums up 3% on constant exchange reflecting growth in Personal Motor <strong>and</strong> increased distribution,<br />
with 37 new agents signed this year. In Irel<strong>and</strong>, the market remains competitive <strong>and</strong> we are continuing to act on rate.<br />
Premiums are in line with last year, with growth in our Affinity business <strong>and</strong> recent acquisitions, offsetting the withdrawal<br />
of capacity in areas such as Fleet <strong>and</strong> Solicitors’ PI. We also completed the domestication of our Irish business,<br />
establishing it as a separate legal entity. This company started writing Group business in 2009, taking advantage of<br />
Irel<strong>and</strong>’s lower tax regime.<br />
The International COR was 91.2% (2007: 91.3%). The Sc<strong>and</strong>inavian COR improved by 3.1 points to 88.3% driven<br />
primarily by a strong performance in Sweden, particularly in Personal lines. In Canada, profitability remains strong with a<br />
COR of 92.9% (2007: 92.4%), despite adverse weather, with some of the worst winter storms in Ontario for almost 70<br />
years. The COR for Other Europe was 97.1% (2007: 89.1%) reflecting the impact of the floods in Irel<strong>and</strong> as well as the<br />
exceptional level of prior year development in 2007.<br />
The result has been underpinned by our continued focus on operational excellence. In May 2008, we announced a<br />
further £25m expense savings target for Sc<strong>and</strong>inavia, to be achieved by mid 2010, <strong>and</strong> we are on track to deliver this.<br />
- UK<br />
The UK market remains competitive <strong>and</strong> we are maintaining our strategy of targeting profitable growth, taking the right<br />
action on rate <strong>and</strong> selective capacity withdrawal. Premiums are up by 1% to £2.7bn, with a COR of 97.6% (2007: 97.6%).<br />
In Personal, premiums are up 2% to £1.1bn. MORE TH>N continues to perform well, with premium growth of 2%, <strong>and</strong><br />
new business sales up by 10%, while lower mortgage originations <strong>and</strong> new car sales continue to impact Affinity volumes.<br />
In Commercial, overall premiums are in line with last year at £1.6bn, with strong growth in specialty lines, including Risk<br />
Solutions which is up 9%, Marine up 13%, <strong>and</strong> targeted growth in Commercial Fleet offsetting the withdrawal of capacity<br />
in lines of business such as Liability <strong>and</strong> small <strong>and</strong> mid corporate Property, where we cannot achieve our target returns.<br />
Overall retention remains strong at around 80%. We have continued to take action on rate, increasing Personal Motor<br />
rates by 6% <strong>and</strong> Household by 5%, <strong>and</strong> Commercial rates by 6% in Liability, 7% in Property <strong>and</strong> 8% in Motor. Across the<br />
market we are starting to see more consistent rating action from major competitors.<br />
The underwriting result is £99m (2007: £65m), with the expected lower level of prior year development <strong>and</strong> increased<br />
large losses partially offsetting the benefits of improved weather. In Commercial lines, adverse large loss experience <strong>and</strong><br />
5 Ι RSA Ι 2008 Year End Results Ι 26 February 2009
lower prior year development have reduced the Property <strong>and</strong> Casualty underwriting results, however, this has been offset<br />
by good profitability in Marine <strong>and</strong> in our Legacy operations, which are included in Other.<br />
The UK expense ratio including commissions is 33.3%, compared with 34.5% in 2007, with a 0.2 point decrease in the<br />
commission ratio (due to lower Affinity sales offset by a one off profit commission payment in 2008) <strong>and</strong> a 1 point<br />
improvement in the expense ratio. Today we have announced a further £70m expense savings target for the UK, to be<br />
delivered by mid 2010. There will be a one off cost of £80m to deliver this, which will be incurred in 2009 <strong>and</strong> treated as a<br />
reorganisation cost <strong>and</strong> will not be included in the Operating Result. With these <strong>and</strong> other actions, we are targeting an<br />
expense ratio of around 14% by the end of 2012.<br />
- Emerging Markets<br />
In Emerging Markets, premiums are up by 20% to over £0.7bn (7% on constant exchange) <strong>and</strong> up by 26% (12% on<br />
constant exchange) after excluding Venezuela, which we sold in December 2007. The underwriting result increased by<br />
28% to £23m <strong>and</strong> the COR was 96.4% (2007: 95.3%). As noted in our interim results, we are seeing the impact of the<br />
economic downturn across a number of our markets. We have taken action on expenses to protect profitability, including<br />
reducing headcount by around 400 (around 10% of the total workforce) across the region.<br />
In the Baltics, premiums are up by 21% (4% on constant exchange) <strong>and</strong> while growth has slowed as a result of economic<br />
conditions, we have taken action to protect profitability. In Asia <strong>and</strong> the Middle East, premiums are up by 43% (30% on<br />
constant exchange) with strong growth in UAE Motor <strong>and</strong> Construction <strong>and</strong> Engineering. In Latin America, premiums are<br />
up 22% (10% on constant exchange), after adjusting for the sale of Venezuela, reflecting double digit growth across Chile,<br />
Brazil, Argentina <strong>and</strong> Colombia.<br />
Our associates in India <strong>and</strong> Intouch in Central <strong>and</strong> Eastern Europe continue to build momentum <strong>and</strong> premiums are up by<br />
37% to £140m (25% increase on constant exchange). In India, our business performed strongly, delivering above market<br />
growth <strong>and</strong> increasing the agent network by around 2,700. Intouch has market leading direct operations in Pol<strong>and</strong>, the<br />
Czech Republic <strong>and</strong> Russia <strong>and</strong> in February 2009, we signed an agreement to acquire the remaining 50% of the<br />
business.<br />
The Emerging Markets’ expense ratio including commission has increased by 3.4 points to 40.7% (2007: 37.3%) reflecting<br />
action taken to reduce headcount, higher commission as a result of increased levels of Affinity business, <strong>and</strong> a one off<br />
receipt of a profit commission in 2007.<br />
These markets remain attractive with good long term potential, <strong>and</strong> we are on track to meet our target of increasing<br />
Emerging Markets’ net written premiums to £1bn by the end of 2010.<br />
- Rating movements<br />
Rate movements achieved for risks renewing in December 2008 versus comparable risks renewing in December 2007 are<br />
set out in the table below. Our action on rating demonstrates our commitment to maintaining pricing discipline <strong>and</strong> to<br />
delivering sustainable profitable performance.<br />
Personal<br />
Commercial<br />
Motor Household Motor Liability Property<br />
% % % % %<br />
UK 6 5 8 6 7<br />
Sc<strong>and</strong>inavia 1 4 2 5 3<br />
Canada 4 7 2 (1) -<br />
- Other activities<br />
The analysis of the other activities result is as follows:<br />
12 Months 12 Months Movement<br />
2008 2007<br />
£m £m<br />
Central expenses (61) (60) -2%<br />
Investment expenses <strong>and</strong> charges (26) (21) -24%<br />
Other operating activities (24) (12) -100%<br />
Other activities (111) (93) -19%<br />
Expenses from other activities for 2008 have increased by £18m to £111m. Other operating activities of £24m include<br />
business development expenses for the Emerging Markets’ region, as well as investment in our associates in India <strong>and</strong><br />
Central <strong>and</strong> Eastern Europe of £19m (2007: £4m).<br />
6 Ι RSA Ι 2008 Year End Results Ι 26 February 2009
- Investment result<br />
The analysis of the investment results is as follows:<br />
12 Months 12 Months Movement<br />
2008 2007<br />
£m £m<br />
Bonds 478 391 +22%<br />
Equities 50 48 +4%<br />
Cash <strong>and</strong> cash equivalents 57 83 -31%<br />
L<strong>and</strong> <strong>and</strong> buildings 16 17 -6%<br />
Other 53 52 +2%<br />
Investment income 654 591 +11%<br />
Realised gains 150 174 -14%<br />
Unrealised gains/(losses), impairments <strong>and</strong> foreign exchange (118) (55) -115%<br />
Total gains 32 119 -73%<br />
Unwind of discount including ADC (92) (81) -14%<br />
Investment result 594 629 -6%<br />
The Group continues to maintain a low risk investment strategy with the portfolio dominated by high quality fixed income<br />
<strong>and</strong> cash assets. The investment result is £594m (2007: £629m), <strong>and</strong> reflects increased investment income offset by the<br />
expected decrease in total gains from £119m in 2007 to £32m.<br />
Investment income is up 11% to £654m, reflecting action taken to lock in higher bond yields as well as foreign exchange<br />
gains of £40m. The average underlying yield on the portfolio (excluding the yield on the ADC funds withheld account) was<br />
4.6% (2007: 4.4%).<br />
Total gains were £32m (2007: £119m) <strong>and</strong> comprise gains on the equity hedges of £141m, on equity <strong>and</strong> bond sales of<br />
£68m, offset by mark to market movements on commercial property of £98m, on CDO’s of £12m <strong>and</strong> on other assets of<br />
£10m. Impairments totalled £61m <strong>and</strong> include £43m on equities <strong>and</strong> £18m on bonds.<br />
In 2008, we took a number of actions to enhance yield on the bond portfolio, including selling low yielding government<br />
bonds <strong>and</strong> reinvesting at longer duration to take advantage of higher yields. In addition, we purchased a net £600m of high<br />
quality, well diversified non government securities. The net purchases of non government bonds were at an average credit<br />
rating of AA-, well diversified by sector <strong>and</strong> were spread over more than 100 names. These actions are consistent with our<br />
high quality, low risk investment strategy, <strong>and</strong> we have maintained the overall high credit quality of the portfolio. In 2009,<br />
we will continue to be a cautious purchaser of high quality non government credit <strong>and</strong> selectively extend duration.<br />
In addition, the portfolio benefits from being well diversified geographically, with over 70% of the bond portfolio invested in<br />
currencies other than Sterling. While most of these markets are also seeing interest rate reductions, this has been offset<br />
by foreign exchange gains.<br />
Going forward, investment income will be impacted by lower interest rates, however, with the actions we are taking to lock<br />
in higher yields <strong>and</strong> the geographic diversification of the portfolio we expect to limit this, <strong>and</strong> in 2009, we expect investment<br />
income to be around 2007 levels.<br />
Total gains will continue to be impacted by any further negative market movements in commercial property values as well<br />
as financial market volatility. If the FTSE 100 remains at around 4,000 throughout 2009, the value of the equity hedges is<br />
estimated to be approximately £40m, while total impairments are estimated to be between £40m <strong>and</strong> £60m. The value of<br />
commercial property is expected to broadly track the IPD index, <strong>and</strong> as it st<strong>and</strong>s today, we are not anticipating a positive<br />
contribution from total gains in 2009.<br />
7 Ι RSA Ι 2008 Year End Results Ι 26 February 2009
The table below sets out the key movements in the investment portfolio over 2008:<br />
Value Foreign Mark to Other Value<br />
31/12/2007 Exchange Market Movements 31/12/08<br />
£m £m £m £m £m<br />
Government Bonds 5,333 743 261 (326) 6,011<br />
Non Government Bonds 4,248 604 43 736 5,631<br />
Cash 1,509 167 - (62) 1,614<br />
Equities 1,132 32 (363) (21) 780<br />
Property 429 27 (98) 7 365<br />
Prefs & CIVs 355 21 (78) (138) 160<br />
Other 272 17 2 (125) 166<br />
Total 13,278 1,611 (233) 71 14,727<br />
The investment portfolio increased by 11% to £14,727m over the year, with foreign exchange gains of £1,611m <strong>and</strong> other<br />
positive movements of £71m offset by mark to market movements of £233m. The foreign exchange benefit reflects the<br />
appreciation of the Canadian Dollar, the Euro, the Danish Krone <strong>and</strong> the Swedish Krona against Sterling. The mark to<br />
market movement on the bond portfolio is a positive £304m, <strong>and</strong> the movement on equities a negative £363m. The<br />
movement on equities is partially offset by the £141m gain on the equity hedges, which is recognised in total gains.<br />
90% of the total investment portfolio is invested in high quality fixed income <strong>and</strong> cash assets. The fixed interest portfolio<br />
remains concentrated on high quality short dated assets, with 99% of the bond portfolio investment grade, <strong>and</strong> 83% rated<br />
AA or above. The bond holdings are well diversified, with 74% invested in currencies other than Sterling, <strong>and</strong> 48%<br />
invested in non government bonds (2007: 45% invested in non government bonds). The average duration is 2.7 years for<br />
the Group, <strong>and</strong> 2.0 years in the UK.<br />
The non government bond portfolio of £5.6bn comprises £1.8bn of Sc<strong>and</strong>inavian Mortgage Bonds, £2.2bn of other<br />
financials <strong>and</strong> £1.6bn of non financials. The Sc<strong>and</strong>inavian Mortgage Bonds portfolio comprises £1.2bn of Swedish bonds,<br />
which are all rated AAA, <strong>and</strong> £0.6bn of Danish bonds, which are principally rated Aaa. The average duration on the<br />
Sc<strong>and</strong>inavian Mortgage Bond portfolio is 2.6 years with an average LTV of 50-60%. Total holdings have increased by<br />
£0.4bn since 30 September 2008, primarily reflecting foreign exchange <strong>and</strong> positive valuation movements. Within the<br />
£2.2bn of other financial exposure, £0.6bn is in supranational <strong>and</strong> sovereign backed entities, £0.3bn in other non bank<br />
financials <strong>and</strong> £1.3bn in banks. Of the £1.3bn in banks, just £320m of this is subordinated debt <strong>and</strong> only £90m is Tier 1,<br />
the vast majority of which is in Canadian banks, with only £10m in the UK.<br />
At the year end, equities (excluding preference shares <strong>and</strong> Collective Investment Vehicles backed by fixed income <strong>and</strong><br />
cash) comprised 5% of the portfolio. We have hedged our equity exposure for the past 4 years <strong>and</strong> around 75% of this<br />
exposure remains hedged with a rolling programme of put <strong>and</strong> call options, providing protection down to a FTSE level of<br />
2825.<br />
The commercial property portfolio is only 2% of investment assets <strong>and</strong> comprises high quality commercial properties <strong>and</strong><br />
does not include any development properties. The Group’s CDO exposure is £81m, <strong>and</strong> includes £76m of CLOs which<br />
have experienced no downgrades.<br />
At 31 December 2008, unrealised gains on the balance sheet were £263m (31 December 2007: £461m).<br />
OTHER INFORMATION<br />
Capital position<br />
The regulatory capital position of the Group under the Insurance Groups Directive (IGD) is set out below:<br />
31 December 31 December 31 December<br />
2008 2008 2007<br />
Requirement Surplus Surplus<br />
£bn £bn £bn<br />
Insurance Groups Directive 1.1 1.7 1.5<br />
The IGD surplus was £1.7bn compared with £1.5bn at 31 December 2007 <strong>and</strong> coverage over the IGD requirement is 2.5<br />
times (31 December 2007: 2.5 times). The improvement in IGD surplus is mainly attributable to the profits for the year<br />
<strong>and</strong> positive foreign exchange movements, offset by the dividend, unrealised investment losses <strong>and</strong> an increase in the<br />
capital requirement in line with business growth. A 30% fall in the FTSE from the year end level of around 4,400 would<br />
reduce the IGD surplus by an estimated £0.2bn.<br />
8 Ι RSA Ι 2008 Year End Results Ι 26 February 2009
At 31 December 2008, the Group had surplus economic capital of around £1.8bn, based on a risk tolerance consistent<br />
with St<strong>and</strong>ard & Poor’s long term A rated bond default curve. This is equivalent to a probability of solvency over 1 year of<br />
99.94%. The Group calculates its economic capital position using a global multi year stochastic economic capital model<br />
<strong>and</strong> the 2008 surplus has been calculated to fully reflect current lower asset values <strong>and</strong> lower current <strong>and</strong> future<br />
investment returns. The model is a key decision making tool <strong>and</strong> is used for a range of strategic, operational <strong>and</strong> financial<br />
management purposes throughout the Group, <strong>and</strong> has also been the basis for the Group’s Individual Capital Assessment<br />
submissions to the FSA since the 2004 year end.<br />
The Group is currently rated A stable outlook by St<strong>and</strong>ard & Poor’s <strong>and</strong> A- positive outlook by AM Best. The Group was<br />
upgraded by Moody’s to A2 stable outlook in December 2008.<br />
Our financing <strong>and</strong> liquidity position is strong. Our committed £455m senior facility remains undrawn <strong>and</strong> matures in 2013.<br />
The next call on any external financing is on the €500m subordinated guaranteed bonds in October 2009, <strong>and</strong> we will be<br />
reviewing options over the next few months.<br />
Combined operating ratio<br />
The combined operating ratio represents the sum of expense <strong>and</strong> commission costs expressed in relation to net written<br />
premiums <strong>and</strong> claim costs expressed in relation to net earned premiums. The calculation of the COR of 94.5% was<br />
based on net written premiums of £6,462m <strong>and</strong> net earned premiums of £6,358m.<br />
Net asset value per share<br />
The net asset value per share at 31 December 2008 was 112p (31 December 2007: 91p), <strong>and</strong> 101p excluding IAS 19<br />
(2007: 88p). At 20 February 2009, the net asset value per share was estimated at 105p.<br />
The net asset value per share at 31 December 2008 was based on total shareholders’ funds of £3,839m, adjusted by<br />
£125m for preference shares, <strong>and</strong> shares in issue at the period end of 3,317,539,143 (excluding those held in the ESOP<br />
trusts).<br />
Dividend<br />
The directors will recommend at the Annual General Meeting, to be held on 18 May 2009, that a final ordinary dividend of<br />
4.98p (2007: 4.53p) per share be paid. This, together with the interim dividend of 2.73p paid on 28 November 2008, will<br />
make a total distribution for the year of 7.71p (2007: 7.01p).<br />
The final dividend will be payable on 5 June 2009 to shareholders on the register at the close of business on 6 March<br />
2009. Shareholders will be offered a scrip dividend alternative. Scrip dividend m<strong>and</strong>ates need to be received by Equiniti<br />
Limited before 7 May 2009. The first preference share dividend for 2009 will be payable on 1 April 2009 to holders of<br />
such shares on the register at the close of business on 6 March 2009.<br />
Related party transactions<br />
In 2008, there have been no related party transactions that have materially affected the financial position of the Group.<br />
FURTHER INFORMATION<br />
The full text of the above is available to the public at 1 Leadenhall Street, London EC3V 1PP. The text is also available<br />
online at www.rsagroup.com. A live audiocast of the analyst presentation, including the question <strong>and</strong> answer session, will<br />
be broadcast on the website at 10.00am today <strong>and</strong> available via a listen only conference call by dialling UK Freephone<br />
0800 358 5256 or International dial in: + 44 (0) 207 190 1232. An indexed version of the audiocast will be available on the<br />
website by the end of the day. Copies of the slides to be presented at the analyst meeting will be available on the site<br />
from 9.30am today.<br />
A Q1 interim management statement will be released on 7 May 2009.<br />
The half yearly 2009 results will be announced on 6 August 2009.<br />
MANAGEMENT BASIS OF REPORTING<br />
The following analysis on pages 10 to 13 has been prepared on a non statutory basis as management believe that this is<br />
the most appropriate method of assessing the financial performance of the Group. The management basis reflects the<br />
way management monitor the business. The underwriting result includes insurance premiums, claims <strong>and</strong> commissions<br />
<strong>and</strong> underwriting expenses. In addition, the management basis also discloses a number of items separately such as<br />
investment result, interest costs <strong>and</strong> other activities. Estimation techniques, risks, uncertainties <strong>and</strong> contingencies are<br />
included on pages 17 to 20. Financial information on a statutory basis is included on pages 21 to 28.<br />
9 Ι RSA Ι 2008 Year End Results Ι 26 February 2009
SUMMARY CONSOLIDATED INCOME STATEMENT<br />
MANAGEMENT BASIS<br />
12 Months 12 Months<br />
2008 2007<br />
£m £m<br />
Continuing operations<br />
Net written premiums 6,462 5,837<br />
Underwriting result 384 278<br />
Investment income 654 591<br />
Realised gains 150 174<br />
Unrealised gains/(losses), impairments <strong>and</strong> foreign exchange (118) (55)<br />
Unwind of discount including ADC (92) (81)<br />
Investment result 594 629<br />
Insurance result 978 907<br />
Other activities (111) (93)<br />
Operating result 867 814<br />
Interest costs (108) (104)<br />
Amortisation (18) (18)<br />
Profit before disposals 741 692<br />
Profit/(loss) on disposals 18 (22)<br />
Profit before tax 759 670<br />
Taxation (173) (29)<br />
Profit after tax from continuing operations 586 641<br />
Discontinued operations<br />
Loss after tax from discontinued operations - (13)<br />
Profit after tax 586 628<br />
Earnings per share on profit from continuing operations attributable to the ordinary shareholders of the Company:<br />
Basic 17.3p 19.3p<br />
Diluted 17.0p 19.0p<br />
Earnings per share on profit attributable to the ordinary shareholders of the Company:<br />
Basic 17.3p 18.9p<br />
Diluted 17.0p 18.6p<br />
10 Ι RSA Ι 2008 Year End Results Ι 26 February 2009
SUMMARY CONSOLIDATED BALANCE SHEET<br />
MANAGEMENT BASIS<br />
31 December 31 December<br />
2008 2007<br />
£m £m<br />
Assets<br />
Goodwill <strong>and</strong> other intangible assets 744 663<br />
Property <strong>and</strong> equipment 309 377<br />
Associated undertakings 123 105<br />
Investments<br />
Investment property 365 429<br />
Equity securities 940 1,487<br />
Debt <strong>and</strong> fixed income securities 11,642 9,581<br />
Other 166 272<br />
Total investments - management basis 13,113 11,769<br />
Reinsurers' share of insurance contract liabilities 1,759 1,872<br />
Insurance <strong>and</strong> reinsurance debtors 2,890 2,579<br />
Deferred acquisition costs 653 542<br />
Other debtors <strong>and</strong> other assets 1,659 1,069<br />
Cash <strong>and</strong> cash equivalents 1,614 1,509<br />
Assets associated with continuing operations 22,864 20,485<br />
Assets associated with discontinued operations* 3 108<br />
Total assets 22,867 20,593<br />
Equity, reserves <strong>and</strong> liabilities<br />
Equity <strong>and</strong> reserves<br />
Shareholders' funds 3,839 3,077<br />
Minority interests 81 67<br />
Total equity <strong>and</strong> reserves 3,920 3,144<br />
Loan capital 1,311 1,194<br />
Total equity, reserves <strong>and</strong> loan capital 5,231 4,338<br />
Liabilities (excluding loan capital)<br />
Insurance contract liabilities 15,055 13,727<br />
Insurance <strong>and</strong> reinsurance liabilities 545 426<br />
Borrowings 300 303<br />
Provisions <strong>and</strong> other liabilities 1,736 1,734<br />
Liabilities associated with continuing operations 17,636 16,190<br />
Liabilities associated with discontinued operations* - 65<br />
Total liabilities (excluding loan capital) 17,636 16,255<br />
Total equity, reserves <strong>and</strong> liabilities 22,867 20,593<br />
These summary consolidated financial statements have been approved for issue by the Board of Directors on 25<br />
February 2009.<br />
∗ Assets <strong>and</strong> liabilities associated with discontinued operations in 2008 relate to property held for sale <strong>and</strong> in 2007 to a UK subsidiary <strong>and</strong> property held for<br />
sale.<br />
11 Ι RSA Ι 2008 Year End Results Ι 26 February 2009
OTHER INFORMATION<br />
MANAGEMENT BASIS<br />
Movement in net assets<br />
Shareholders'<br />
funds<br />
Minority<br />
interest<br />
Loan<br />
capital<br />
Net<br />
assets<br />
£m £m £m £m<br />
Balance at 1 January 2008 3,077 67 1,194 4,338<br />
Profit after tax 574 12 - 586<br />
Exchange gains net of tax 314 12 119 445<br />
Fair value losses net of tax (191) (2) - (193)<br />
Pension fund actuarial gains net of tax 204 - - 204<br />
Amortisation of loan capital - - (2) (2)<br />
Share issue 84 - - 84<br />
Changes in shareholders’ interests in subsidiaries (2) - - (2)<br />
Share options 25 - - 25<br />
Prior year final dividend (147) (8) - (155)<br />
Current year interim dividend (90) - - (90)<br />
Preference dividend (9) - - (9)<br />
Balance at 31 December 2008 3,839 81 1,311 5,231<br />
Net assets have increased by £893m to £5,231m. This increase primarily reflects the profit after tax for the period of<br />
£586m, exchange gains of £445m <strong>and</strong> pension fund actuarial gains of £204m, offset by fair value losses of £193m <strong>and</strong><br />
dividends paid in 2008 of £254m.<br />
Pension fund surplus<br />
The table below provides a reconciliation of the Group pension fund surplus (net of tax) from 1 January 2008 to 31<br />
December 2008.<br />
UK Other Group<br />
£m £m £m<br />
Pension fund at 1 January 2008 154 (38) 116<br />
Actuarial gains/(losses) 211 (7) 204<br />
Asset reallocation funding 30 - 30<br />
Other movements 17 (4) 13<br />
Pension fund at 31 December 2008 412 (49) 363<br />
The surplus on the pension scheme as at 31 December 2008 is £363m compared with £116m at the start of the year.<br />
The movement is due to the increase in discount rate for the UK schemes from 5.6% to 6.2% (which includes an<br />
allowance for current pricing of financial corporate bonds) <strong>and</strong> the change in the inflation assumption from 3.2% to 2.8%.<br />
The assets in the pension funds performed strongly over the year, reflecting the defensive asset mix, with only 22% of the<br />
assets invested in equities.<br />
The Group uses medium cohort assumptions for mortality, using PFA92 <strong>and</strong> PMA92 tables. The life expectancy of a<br />
male pensioner aged 60 is assumed to be 25.8 years, <strong>and</strong> 27.0 years for a female pensioner.<br />
12 Ι RSA Ι 2008 Year End Results Ι 26 February 2009
Cashflow – management basis<br />
12 Months 12 Months<br />
2008 2007<br />
£m £m<br />
Operating cashflow 780 652<br />
Tax paid (101) (127)<br />
Interest paid (107) (92)<br />
Group dividends (181) (111)<br />
Dividend to minorities (8) (31)<br />
Net cashflow 383 291<br />
Issue of share capital 19 304<br />
Pension asset reallocation funding (37) (86)<br />
Net movement of debt (2) 223<br />
Corporate activity (101) (888)<br />
Cash movement 262 (156)<br />
Represented by:<br />
Decrease in cash <strong>and</strong> cash equivalents (91) (352)<br />
Purchase of other investments 353 196<br />
262 (156)<br />
The Group’s operating cashflow has increased by 20% to £780m, benefitting from strong operational cash flows <strong>and</strong> the<br />
disposal of Group occupied properties. Tax paid of £101m is £26m lower than 2007, primarily due to the timing of<br />
statutory instalments in Sc<strong>and</strong>inavia <strong>and</strong> Canada. Interest paid of £107m is £15m up on 2007, reflecting repo activity <strong>and</strong><br />
the foreign exchange impact on Euro bonds. Group dividends have increased by £70m to £181m, due to the dividend<br />
increase <strong>and</strong> the lower take up of scrip dividend in 2008. The pension funding payment of £37m is part of our pension<br />
scheme asset reallocation strategy. The issue of share capital <strong>and</strong> corporate activity in 2007 primarily related to the<br />
purchase of the Codan minority. Corporate activity in 2008 of £101m includes a number of small acquisitions in the UK<br />
<strong>and</strong> International, further capital investment in our associates <strong>and</strong> the disposal of run off books in the UK <strong>and</strong><br />
Sc<strong>and</strong>inavia.<br />
13 Ι RSA Ι 2008 Year End Results Ι 26 February 2009
Loss development tables<br />
The table below presents the general insurance claims provisions net of reinsurance for the accident years 2001 <strong>and</strong><br />
prior, through to 2008. The top half of the table shows the estimate of cumulative claims at the end of the initial accident<br />
year <strong>and</strong> how these have developed over time. The bottom half of the table shows the value of claims paid for each<br />
accident year in each subsequent year. The current year provision for each accident year is calculated as the estimate of<br />
cumulative claims at the end of the current year less the cumulative claims paid.<br />
The loss development table is presented on an undiscounted basis. Prior year development in 2008 showed favourable<br />
experience across all accident years <strong>and</strong> regions, <strong>and</strong> totalled £369m, net of reinsurance. The total discounting at the<br />
end of 2008 was £671m representing an increase of £70m in the year, due to the impact of foreign exchange. In<br />
Sc<strong>and</strong>inavia certain long tail liabilities are settled by an annuity <strong>and</strong> the discounted value of these annuities is shown<br />
separately. At the year end, the annuity reserves were £437m (2007: £327m) with the increase in the year driven<br />
primarily by foreign exchange <strong>and</strong> growth in the business.<br />
2001<br />
<strong>and</strong><br />
prior 2002 2003 2004 2005 2006 2007 2008 Total<br />
£m £m £m £m £m £m £m £m £m<br />
Estimate of cumulative claims<br />
At end of accident year 7,380 2,534 2,314 2,139 2,321 2,332 2,399 2,343<br />
1 year later 7,660 2,479 2,317 2,014 2,178 2,300 2,394<br />
2 years later 7,788 2,481 2,235 1,836 2,098 2,221<br />
3 years later 8,181 2,462 2,129 1,768 2,030<br />
4 years later 8,229 2,382 2,072 1,712<br />
5 years later 8,699 2,353 2,027<br />
6 years later 8,637 2,322<br />
7 years later 8,552<br />
Claims paid<br />
1 year later 2,372 1,036 835 675 887 929 1,068<br />
2 years later 1,213 347 286 247 280 332<br />
3 years later 1,063 254 200 178 161<br />
4 years later 557 166 104 134<br />
5 years later 395 90 88<br />
6 years later 259 72<br />
7 years later 254<br />
Cumulative claims paid 6,113 1,965 1,513 1,234 1,328 1,261 1,068<br />
Current year provision before discounting 2,439 357 514 478 702 960 1,326 2,343 9,119<br />
Exchange adjustment to closing rates 835<br />
Discounting (671)<br />
Annuity reserves 437<br />
Present value recognised in the<br />
balance sheet 9,720<br />
Asbestos reserves<br />
The technical provisions include £915m for asbestos in the UK. These provisions can be analysed by survival ratio.<br />
Survival ratio is an industry st<strong>and</strong>ard measure of a company’s reserves, expressing the number of years that carried<br />
reserves will be available if the recent year payment or notification levels continue. The following table outlines the<br />
asbestos provisions as at 31 December 2008 analysed by risk <strong>and</strong> survival ratio:<br />
Total UK risks written US risks written<br />
in the UK in the UK<br />
Provisions in £m<br />
Net of reinsurance 915 824 91<br />
Net of discount 484 419 65<br />
Survival ratios (Gross of discount) - On payment<br />
One year 39 40 36<br />
Three year average 44 49 23<br />
Survival ratios (Gross of discount) - On notifications<br />
One year 40 42 30<br />
Three year average 41 46 21<br />
14 Ι RSA Ι 2008 Year End Results Ι 26 February 2009
REGIONAL ANALYSIS OF INSURANCE OPERATIONS<br />
12 MONTHS TO 31 DECEMBER<br />
Net written premiums<br />
Increase<br />
as<br />
Increase at<br />
constant<br />
2008 2007 reported exchange<br />
£m £m % %<br />
United Kingdom 2,711 2,688 1 1<br />
International 2,998 2,513 19 6<br />
Emerging Markets 738 615 20 7<br />
Group Re 15 21 (29) (29)<br />
Total Group 6,462 5,837 11 4<br />
Underwriting result Investment result Insurance result<br />
2008 2007 2008 2007 2008 2007<br />
£m £m £m £m £m £m<br />
United Kingdom 99 65 317 372 416 437<br />
International 262 206 237 212 499 418<br />
Emerging Markets 23 18 40 42 63 60<br />
Group Re - (11) - 3 - (8)<br />
Total Group 384 278 594 629 978 907<br />
Operating ratios<br />
2008 2007<br />
Claims Expenses Combined Claims Expenses Combined<br />
% % % % % %<br />
United Kingdom 64.3 33.3 97.6 63.1 34.5 97.6<br />
International 68.3 22.9 91.2 68.5 22.8 91.3<br />
Emerging Markets 55.7 40.7 96.4 58.0 37.3 95.3<br />
Total Group 65.1 29.4 94.5 65.2 29.7 94.9<br />
INVESTMENT RESULT BY REGION<br />
12 MONTHS TO 31 DECEMBER 2008<br />
UK International Emerging<br />
Markets<br />
Group<br />
Re<br />
Group<br />
£m £m £m £m £m<br />
Investment income 325 259 38 32 654<br />
Realised gains 77 61 9 3 150<br />
Unrealised gains/(losses), impairments <strong>and</strong> foreign exchange (61) (48) (7) (2) (118)<br />
Unwind of discount including ADC (24) (35) - (33) (92)<br />
Investment result 317 237 40 - 594<br />
The total investment income is allocated to the regions based on economic capital requirements. Realised gains,<br />
unrealised gains <strong>and</strong> impairment losses are allocated with reference to the above amounts. The unwind of discount is<br />
attributed on an actual basis.<br />
15 Ι RSA Ι 2008 Year End Results Ι 26 February 2009
UNITED KINGDOM INSURANCE OPERATIONS<br />
12 MONTHS TO 31 DECEMBER<br />
Net written premiums Underwriting result Operating ratio<br />
2008 2007 2008 2007 2008 2007<br />
£m £m £m £m % %<br />
Personal<br />
Household 557 591 31 (15) 92.4 102.6<br />
Motor 469 436 7 4 98.3 98.7<br />
Other 70 47 (1) 7 98.9 80.7<br />
Total UK Personal 1,096 1,074 37 (4) 95.0 100.6<br />
Commercial<br />
Property 594 634 (38) (22) 112.7 104.4<br />
Casualty 315 331 19 36 97.4 89.5<br />
Motor 494 465 38 42 92.4 90.8<br />
Other 212 184 43 13 80.2 91.4<br />
Total UK Commercial 1,615 1,614 62 69 99.3 95.9<br />
Total UK 2,711 2,688 99 65 97.6 97.6<br />
INTERNATIONAL INSURANCE OPERATIONS<br />
12 MONTHS TO 31 DECEMBER<br />
Net written premiums Underwriting result Operating ratio<br />
2008 2007 2008 2007 2008 2007<br />
£m £m £m £m % %<br />
Personal<br />
Sc<strong>and</strong>inavia 875 768 146 70 83.8 90.5<br />
Canada 667 520 39 32 93.2 93.3<br />
Other Europe 299 245 1 36 99.7 83.1<br />
Total Personal 1,841 1,533 186 138 89.8 90.4<br />
Commercial<br />
Sc<strong>and</strong>inavia 727 611 44 46 93.5 92.4<br />
Canada 217 183 18 18 92.2 90.3<br />
Other Europe 213 186 14 4 94.5 97.2<br />
Total Commercial 1,157 980 76 68 93.3 93.0<br />
Total<br />
Sc<strong>and</strong>inavia 1,602 1,379 190 116 88.3 91.4<br />
Canada 884 703 57 50 92.9 92.4<br />
Other Europe 512 431 15 40 97.1 89.1<br />
Total International 2,998 2,513 262 206 91.2 91.3<br />
16 Ι RSA Ι 2008 Year End Results Ι 26 February 2009
ESTIMATION TECHNIQUES, RISKS, UNCERTAINTIES AND CONTINGENCIES<br />
Introduction<br />
One of the purposes of insurance is to enable policyholders to protect themselves against uncertain future events.<br />
Insurance companies accept the transfer of uncertainty from policyholders <strong>and</strong> seek to add value through the aggregation<br />
<strong>and</strong> management of these risks.<br />
The uncertainty inherent in insurance is inevitably reflected in the financial statements of insurance companies.<br />
The uncertainty in the financial statements principally arises in respect of the insurance liabilities of the company.<br />
The insurance liabilities of an insurance company include the provision for unearned premiums <strong>and</strong> unexpired risks <strong>and</strong><br />
the provision for outst<strong>and</strong>ing claims. Unearned premiums <strong>and</strong> unexpired risks represent the amount of income set aside<br />
by the company to cover the cost of claims that may arise during the unexpired period of risk of insurance policies in force<br />
at the balance sheet date. Outst<strong>and</strong>ing claims represent the company’s estimate of the cost of settlement of claims that<br />
have occurred by the balance sheet date but have not yet been finally settled.<br />
In addition to the inherent uncertainty of having to make provision for future events, there is also considerable uncertainty<br />
as regards the eventual outcome of the claims that have occurred by the balance sheet date but remain unsettled. This<br />
includes claims that may have occurred but have not yet been notified to the company <strong>and</strong> those that are not yet apparent<br />
to the insured.<br />
As a consequence of this uncertainty, the insurance company needs to apply sophisticated estimation techniques to<br />
determine the appropriate provisions.<br />
Estimation techniques<br />
Claims <strong>and</strong> unexpired risks provisions are determined based upon previous claims experience, knowledge of events <strong>and</strong><br />
the terms <strong>and</strong> conditions of the relevant policies <strong>and</strong> on interpretation of circumstances. Particularly relevant is<br />
experience with similar cases <strong>and</strong> historical claims payment trends. The approach also includes the consideration of the<br />
development of loss payment trends, the potential longer term significance of large events, the levels of unpaid claims,<br />
legislative changes, judicial decisions <strong>and</strong> economic <strong>and</strong> political conditions.<br />
Where possible, the Group adopts multiple techniques to estimate the required level of provisions. This assists in giving<br />
greater underst<strong>and</strong>ing of the trends inherent in the data being projected. The Group’s estimates of losses <strong>and</strong> loss<br />
expenses are reached after a review of several commonly accepted actuarial projection methodologies <strong>and</strong> a number of<br />
different bases to determine these provisions. These include methods based upon the following:<br />
• the development of previously settled claims, where payments to date are extrapolated for each prior year;<br />
• estimates based upon a projection of claims numbers <strong>and</strong> average cost;<br />
• notified claims development, where notified claims to date for each year are extrapolated based upon observed<br />
development of earlier years; <strong>and</strong><br />
• expected loss ratios.<br />
In addition, the Group uses other methods such as the Bornhuetter-Ferguson method, which combines features of the<br />
above methods. The Group also uses bespoke methods for specialist classes of business. In selecting its best estimate,<br />
the Group considers the appropriateness of the methods <strong>and</strong> bases to the individual circumstances of the provision class<br />
<strong>and</strong> underwriting year. The process is designed to select the most appropriate best estimate.<br />
Large claims impacting each relevant business class are generally assessed separately, being measured either at the<br />
face value of the loss adjusters’ estimates or projected separately in order to allow for the future development of large<br />
claims.<br />
Provisions are calculated gross of any reinsurance recoveries. A separate estimate is made of the amounts that will be<br />
recoverable from reinsurers based upon the gross provisions <strong>and</strong> having due regard to collectability.<br />
The claims provisions are subject to close scrutiny both within the Group’s business units <strong>and</strong> at Group Corporate Centre.<br />
In addition, for major classes where the risks <strong>and</strong> uncertainties inherent in the provisions are greatest, regular <strong>and</strong> ad hoc<br />
detailed reviews are undertaken by advisers who are able to draw upon their specialist expertise <strong>and</strong> a broader<br />
knowledge of current industry trends in claims development. As an example, the Group’s exposure to asbestos <strong>and</strong><br />
environmental pollution is examined on this basis. The results of these reviews are considered when establishing the<br />
appropriate levels of provisions for outst<strong>and</strong>ing claims <strong>and</strong> unexpired periods of risk.<br />
It should be emphasised that the estimation techniques for the determination of insurance liabilities involve obtaining<br />
corroborative evidence from as wide a range of sources as possible <strong>and</strong> combining these to form the overall estimate.<br />
This technique means that the estimate is inevitably deterministic rather than stochastic. A stochastic valuation approach,<br />
whereby a range of possible outcomes is estimated <strong>and</strong> probabilities assigned thereto, is only possible in a limited<br />
number of situations.<br />
17 Ι RSA Ι 2008 Year End Results Ι 26 February 2009
The pension assets <strong>and</strong> pension <strong>and</strong> post retirement liabilities are calculated in accordance with International Accounting<br />
St<strong>and</strong>ard 19 (IAS 19). The assets, liabilities <strong>and</strong> income statement charge, calculated in accordance with IAS 19, are<br />
sensitive to the assumptions made from time to time, including inflation, interest rate, investment return <strong>and</strong> mortality. IAS<br />
19 compares, at a given date, the current market value of a pension fund’s assets with its long term liabilities, which are<br />
calculated using a discount rate in line with yields on ‘AA’ rated bonds of suitable duration <strong>and</strong> currency. As such, the<br />
financial position of a pension fund on this basis is highly sensitive to changes in bond rates <strong>and</strong> will also be impacted by<br />
changes in equity markets.<br />
Uncertainties <strong>and</strong> contingencies<br />
The uncertainty arising under insurance contracts may be characterised under a number of specific headings, such as:<br />
• uncertainty as to whether an event has occurred which would give rise to a policyholder suffering an insured loss;<br />
• uncertainty as to the extent of policy coverage <strong>and</strong> limits applicable;<br />
• uncertainty as to the amount of insured loss suffered by a policyholder as a result of the event occurring; <strong>and</strong><br />
• uncertainty over the timing of a settlement to a policyholder for a loss suffered.<br />
The degree of uncertainty will vary by policy class according to the characteristics of the insured risks <strong>and</strong> the cost of a<br />
claim will be determined by the actual loss suffered by the policyholder.<br />
There may be significant reporting lags between the occurrence of the insured event <strong>and</strong> the time it is actually reported to<br />
the Group. Following the identification <strong>and</strong> notification of an insured loss, there may still be uncertainty as to the<br />
magnitude <strong>and</strong> timing of the settlement of the claim. There are many factors that will determine the level of uncertainty<br />
such as inflation, inconsistent judicial interpretations <strong>and</strong> court judgments that broaden policy coverage beyond the intent<br />
of the original insurance, legislative changes <strong>and</strong> claims h<strong>and</strong>ling procedures.<br />
The establishment of insurance liabilities is an inherently uncertain process <strong>and</strong>, as a consequence of this uncertainty, the<br />
eventual cost of settlement of outst<strong>and</strong>ing claims <strong>and</strong> unexpired risks can vary substantially from the initial estimates,<br />
particularly for the Group’s long tail lines of business. The Group seeks to provide appropriate levels of claims provision<br />
<strong>and</strong> provision for unexpired risks taking the known facts <strong>and</strong> experience into account.<br />
The Group has exposures to risks in each class of business within each operating segment that may develop <strong>and</strong> that<br />
could have a material impact upon the Group’s financial position. The geographic <strong>and</strong> insurance risk diversity within the<br />
Group’s portfolio of issued insurance policies make it not possible to predict whether material development will occur <strong>and</strong>,<br />
if it does occur, the location <strong>and</strong> the timing of such an occurrence. The estimation of insurance liabilities involves the use<br />
of judgments <strong>and</strong> assumptions that are specific to the insurance risks within each territory <strong>and</strong> the particular type of<br />
insurance risk covered. The diversity of the insurance risks results in it not being possible to identify individual judgments<br />
<strong>and</strong> assumptions that are more likely than others to have a material impact on the future development of the insurance<br />
liabilities.<br />
The sections below identify a number of specific risks relating to asbestos <strong>and</strong> environmental claims. There may be other<br />
classes of risk which could develop in the future <strong>and</strong> that could have a material impact on the Group’s financial position.<br />
The Group evaluates the concentration of exposures to individual <strong>and</strong> cumulative insurance risk <strong>and</strong> establishes its<br />
reinsurance policy to reduce such exposure to levels acceptable to the Group.<br />
Asbestos <strong>and</strong> environmental claims<br />
The estimation of the provisions for the ultimate cost of claims for asbestos <strong>and</strong> environmental pollution is subject to a<br />
range of uncertainties that is generally greater than those encountered for other classes of insurance business. As a<br />
result it is not possible to determine the future development of asbestos <strong>and</strong> environmental claims with the same degree<br />
of reliability as with other types of claims, particularly in periods when theories of law are in flux. Consequently, traditional<br />
techniques for estimating claims provisions cannot wholly be relied upon <strong>and</strong> the Group employs specialised techniques<br />
to determine provisions using the extensive knowledge of both internal asbestos <strong>and</strong> environmental pollution experts <strong>and</strong><br />
external legal <strong>and</strong> professional advisors.<br />
Factors contributing to this higher degree of uncertainty include:<br />
• the long delay in reporting claims from the date of exposure (for example, cases of mesothelioma can have a latent<br />
period of up to 40 years). This makes estimating the ultimate number of claims we will receive particularly difficult;<br />
• issues of allocation of responsibility among potentially responsible parties <strong>and</strong> insurers;<br />
• emerging court decisions <strong>and</strong> the possibility of retrospective legislative changes increasing or decreasing insurer<br />
liability;<br />
• the tendency for social trends <strong>and</strong> factors to influence court awards;<br />
• developments pertaining to the Group’s ability to recover reinsurance for claims of this nature; <strong>and</strong><br />
• for US liabilities from our London market business, developments in the tactics of US plaintiff lawyers <strong>and</strong> court<br />
decisions <strong>and</strong> awards.<br />
18 Ι RSA Ι 2008 Year End Results Ι 26 February 2009
Acquisitions <strong>and</strong> disposals<br />
The Group makes acquisitions <strong>and</strong> disposals of businesses as part of its normal operations. All acquisitions are made<br />
after due diligence, which will include, amongst other matters, assessment of the adequacy of claims reserves,<br />
assessment of the recoverability of reinsurance balances, inquiries with regard to outst<strong>and</strong>ing litigation <strong>and</strong> inquiries of<br />
local regulators <strong>and</strong> taxation authorities. Consideration is also given to potential costs, risks <strong>and</strong> issues in relation to the<br />
integration of any proposed acquisitions with existing RSA operations. The Group will seek to receive the benefit of<br />
appropriate contractual representations <strong>and</strong> warranties in connection with any acquisition <strong>and</strong>, where necessary,<br />
additional indemnifications in relation to specific risks although there can be no guarantee that such protection will be<br />
adequate in all circumstances. The Group may also provide relevant representations, warranties <strong>and</strong> indemnities to<br />
counterparties on any disposal. While such representations, warranties <strong>and</strong> indemnities are essential components of<br />
many contractual relationships, they do not represent the underlying purpose for the transaction.<br />
These clauses are customary in such contracts <strong>and</strong> may from time to time lead to us receiving claims from counterparties.<br />
Contracts with third parties<br />
The Group enters into joint ventures, outsourcing contracts <strong>and</strong> distribution arrangements with third parties in the normal<br />
course of its business <strong>and</strong> is reliant upon those third parties being willing <strong>and</strong> able to perform their obligations in<br />
accordance with the terms <strong>and</strong> conditions of the contracts.<br />
Litigation, disputes <strong>and</strong> investigations<br />
The Group, in common with the insurance industry in general, is subject to litigation, mediation <strong>and</strong> arbitration, <strong>and</strong><br />
regulatory, governmental <strong>and</strong> other sectoral inquiries <strong>and</strong> investigations in the normal course of its business. In addition<br />
the Group is exposed to the risk of litigation in connection with its former ownership of the US operation. The directors do<br />
not believe that any current mediation, arbitration, regulatory, governmental or sectoral inquiries <strong>and</strong> investigations <strong>and</strong><br />
pending or threatened litigation or dispute will have a material adverse effect on the Group’s financial position, although<br />
there can be no assurance that losses or financial penalties resulting from any current mediation, arbitration, regulatory,<br />
governmental or sectoral inquiries <strong>and</strong> investigations <strong>and</strong> pending or threatened litigation or dispute will not materially<br />
affect the Group’s financial position or cash flows for any period.<br />
Reinsurance<br />
The Group is exposed to disputes on, <strong>and</strong> defects in, contracts with its reinsurers <strong>and</strong> the possibility of default by<br />
its reinsurers. The Group is also exposed to the credit risk assumed in fronting arrangements <strong>and</strong> to potential reinsurance<br />
capacity constraints. In selecting the reinsurers with whom we do business our strategy is to seek reinsurers with the best<br />
combination of financial strength, price <strong>and</strong> capacity. We publish internally a list of authorised reinsurers who pass our<br />
selection process <strong>and</strong> which our operations may use for new transactions.<br />
The Group monitors the financial strength of its reinsurers, including those to whom risks are no longer ceded. Allowance<br />
is made in the financial position for non recoverability due to reinsurer default by requiring operations to provide, in line<br />
with Group st<strong>and</strong>ards, having regard to companies on the Group’s ‘Watch List’. The ‘Watch List’ is the list of companies<br />
whom the directors believe will not be able to pay amounts due to the Group in full.<br />
Investment risk<br />
The Group is exposed to market risk <strong>and</strong> credit risk on its invested assets. Market risk includes the risk of potential losses<br />
from adverse movements in market rates <strong>and</strong> prices including interest rates, equity prices, property prices <strong>and</strong> foreign<br />
currency exchange rates. The Group’s exposure to market risks is controlled by the setting of investment limits in line<br />
with the Group’s risk appetite. From time to time the Group also makes use of derivative financial instruments to reduce<br />
exposure to adverse fluctuations in interest rates, foreign exchange rates <strong>and</strong> equity markets. The Group has strict<br />
controls over the use of derivative instruments.<br />
Credit risk includes the non performance of contractual payment obligations on invested assets <strong>and</strong> adverse changes in<br />
the credit worthiness of invested assets including exposures to issuers or counterparties for bonds, equities, deposits <strong>and</strong><br />
derivatives. Limits are set at both a portfolio <strong>and</strong> counterparty level based on likelihood of default to manage the Group’s<br />
overall credit profile <strong>and</strong> specific concentrations within risk appetite.<br />
Our insurance investment portfolios are concentrated in listed securities with very low levels of exposure to assets without<br />
quoted market prices. We use model based analysis to verify asset values when market values are not readily available.<br />
Rating environment<br />
The ability of the Group to write certain types of insurance business is dependent on the maintenance of the appropriate<br />
credit ratings from the rating agencies. The Group has the objective of maintaining single ‘A’ ratings. At the present time<br />
the ratings are ‘A’ (stable) from S&P upgraded from ‘A-’ in December 2007, ‘A-’ (positive outlook) from AM Best <strong>and</strong> ‘A2’<br />
(stable) from Moody’s upgraded from ‘A3’ in December 2008. Any worsening in the ratings could have an adverse impact<br />
on the ability of the Group to write certain types of general insurance business.<br />
In assessing credit risk in relation to reinsurance <strong>and</strong> investments, the Group takes into account a variety of factors,<br />
including credit rating. If any such rating changes, or is otherwise reassessed, this has potential implications for the<br />
related exposures.<br />
19 Ι RSA Ι 2008 Year End Results Ι 26 February 2009
Changes in foreign exchange rates may impact our results<br />
We publish our consolidated financial statements in Pounds Sterling. Therefore, fluctuations in exchange rates used to<br />
translate other currencies, particularly other European currencies <strong>and</strong> the US dollar, into Pounds Sterling will impact our<br />
reported consolidated financial condition, results of operations <strong>and</strong> cash flows from period to period. These fluctuations in<br />
exchange rates will also impact the Pound Sterling value of our investments <strong>and</strong> the return on our investments.<br />
Income <strong>and</strong> expenses for each income statement item are translated at average exchange rates. Balance sheet assets<br />
<strong>and</strong> liabilities are translated at the closing exchange rates at the balance sheet date.<br />
Regulatory environment<br />
The legal, regulatory <strong>and</strong> accounting environment is subject to significant change in many of the jurisdictions in which we<br />
operate, including developments in response to changes in the economic <strong>and</strong> political environment. We continue to<br />
monitor the developments <strong>and</strong> react accordingly.<br />
In particular the Group is continuing to monitor <strong>and</strong> respond to developments relating to the Solvency II Framework<br />
Directive, which is intended, in the medium term, to achieve greater harmonisation of approach across European member<br />
states to assessing capital resources <strong>and</strong> requirements. The directors are confident that the Group will continue to meet<br />
all future regulatory capital requirements.<br />
20 Ι RSA Ι 2008 Year End Results Ι 26 February 2009
Condensed Financial Statements<br />
Condensed consolidated income statement 22<br />
Condensed statement of recognised income <strong>and</strong> expense 23<br />
Condensed consolidated balance sheet 24<br />
Condensed cashflow statement 25<br />
Explanatory notes to the condensed consolidated financial statements 26<br />
21 Ι RSA Ι 2008 Year End Results Ι 26 February 2009
CONDENSED CONSOLIDATED INCOME STATEMENT<br />
STATUTORY BASIS<br />
Continuing operations<br />
12 Months 12 Months<br />
2008 2007<br />
(audited)<br />
(audited)<br />
£m £m<br />
Income<br />
Gross written premiums 7,273 6,596<br />
Less: reinsurance premiums (811) (759)<br />
Net written premiums 6,462 5,837<br />
Change in the gross provision for unearned premiums (112) (235)<br />
Less: change in provision for unearned premiums, reinsurers' share 8 5<br />
Change in provision for unearned premiums (104) (230)<br />
Net earned premiums 6,358 5,607<br />
Net investment return 681 709<br />
Other operating income 104 113<br />
Total income 7,143 6,429<br />
Expenses<br />
Gross claims incurred (4,205) (4,044)<br />
Less: claims recoveries from reinsurers 63 387<br />
Net claims <strong>and</strong> benefits (4,142) (3,657)<br />
Underwriting <strong>and</strong> policy acquisition costs (1,925) (1,776)<br />
Unwind of discount including ADC (92) (81)<br />
Other operating expenses (117) (119)<br />
Total expenses (6,276) (5,633)<br />
Results of operating activities 867 796<br />
Finance costs (108) (104)<br />
Profit/(loss) on disposals 18 (22)<br />
Net share of loss after tax of associates (18) -<br />
Profit before tax 759 670<br />
Income tax expense (173) (29)<br />
Profit after tax from continuing operations 586 641<br />
Discontinued operations<br />
Loss after tax from discontinued operations - (13)<br />
Profit after tax 586 628<br />
Attributable to:<br />
Equity holders of the Company 574 596<br />
Minority interests 12 32<br />
Profit after tax 586 628<br />
Earnings per share for profit from continuing operations attributable to the ordinary shareholders of the Company:<br />
Basic 17.3 19.3<br />
Diluted 17.0 19.0<br />
Earnings per share on profit attributable to the ordinary shareholders of the Company:<br />
Basic 17.3 18.9<br />
Diluted 17.0 18.6<br />
The attached notes are an integral part of these condensed consolidated financial statements. For dividend information<br />
refer to note 8.<br />
22 Ι RSA Ι 2008 Year End Results Ι 26 February 2009
CONDENSED STATEMENT OF RECOGNISED INCOME AND EXPENSE<br />
STATUTORY BASIS<br />
12 Months 12 Months<br />
2008 2007<br />
(audited)<br />
(audited)<br />
£m £m<br />
Exchange gains net of tax 326 140<br />
Fair value losses net of tax (193) (67)<br />
Pension fund actuarial gains/(losses) net of tax 204 (16)<br />
Net gains recognised in equity 337 57<br />
Profit after tax 586 628<br />
Total recognised income for the year 923 685<br />
Attributable to:<br />
Equity holders of the Company 901 670<br />
Minority interests 22 15<br />
923 685<br />
The attached notes are an integral part of these condensed consolidated financial statements.<br />
23 Ι RSA Ι 2008 Year End Results Ι 26 February 2009
CONDENSED CONSOLIDATED BALANCE SHEET<br />
STATUTORY BASIS<br />
31 December 31 December<br />
2008 2007<br />
(audited)<br />
(audited)<br />
£m £m<br />
Assets<br />
Goodwill <strong>and</strong> other intangible assets 744 663<br />
Property <strong>and</strong> equipment 309 377<br />
Investment property 365 429<br />
Investment in associates 123 105<br />
Financial assets 12,748 11,340<br />
Total investments 13,236 11,874<br />
Reinsurers' share of insurance contract liabilities 1,759 1,872<br />
Insurance <strong>and</strong> reinsurance debtors 2,890 2,579<br />
Deferred acquisition costs 653 542<br />
Current tax assets 40 19<br />
Deferred tax assets 142 87<br />
Other debtors <strong>and</strong> other assets 1,477 963<br />
1,659 1,069<br />
Cash <strong>and</strong> cash equivalents 1,614 1,509<br />
22,864 20,485<br />
Non current <strong>and</strong> disposal group assets held for sale* 3 108<br />
Total assets 22,867 20,593<br />
Equity, reserves <strong>and</strong> liabilities<br />
Equity <strong>and</strong> reserves<br />
Shareholders' funds 3,839 3,077<br />
Minority interests 81 67<br />
Total equity <strong>and</strong> reserves 3,920 3,144<br />
Liabilities<br />
Loan capital 1,311 1,194<br />
Insurance contract liabilities 15,055 13,727<br />
Insurance <strong>and</strong> reinsurance liabilities 545 426<br />
Borrowings 300 303<br />
Current tax liabilities 215 92<br />
Deferred tax liabilities 238 224<br />
Provisions 240 331<br />
Other liabilities 1,043 1,087<br />
Provisions <strong>and</strong> other liabilities 1,736 1,734<br />
18,947 17,384<br />
Non current <strong>and</strong> disposal group liabilities held for sale* - 65<br />
Total liabilities 18,947 17,449<br />
Total equity, reserves <strong>and</strong> liabilities 22,867 20,593<br />
These condensed consolidated financial statements have been approved for issue by the Board of Directors on 25<br />
February 2009.<br />
The attached notes are an integral part of these condensed consolidated financial statements.<br />
* Non current <strong>and</strong> disposal group assets <strong>and</strong> liabilities held for sale in 2008 relate to property <strong>and</strong> in 2007 relate to a UK subsidiary <strong>and</strong> property.<br />
24 Ι RSA Ι 2008 Year End Results Ι 26 February 2009
CONDENSED CASHFLOW STATEMENT<br />
STATUTORY BASIS<br />
12 Months 12 Months<br />
2008 2007<br />
(audited)<br />
(audited)<br />
£m £m<br />
Cash generated from continuing operations 137 66<br />
Tax paid (101) (127)<br />
Interest received 632 587<br />
Interest paid (107) (101)<br />
Dividends received 3 1<br />
Pension asset reallocation funding (37) (86)<br />
Cashflows from discontinued operations - (37)<br />
Net cashflows from operating activities 527 303<br />
Proceeds from sales or maturities of:<br />
Investment contracts 5,184 8,672<br />
Investment property 3 18<br />
Property <strong>and</strong> equipment 20 26<br />
Intangible assets - 1<br />
Investments in subsidiaries (net of cash disposed of) 78 (407)<br />
Investments in associates - 22<br />
Purchase or settlement of:<br />
Investment contracts (5,528) (8,878)<br />
Investment property (10) (8)<br />
Property <strong>and</strong> equipment (64) (28)<br />
Intangible assets (72) (66)<br />
Investments in subsidiaries (net of cash acquired) (25) (52)<br />
Investments in associates (32) (64)<br />
Cashflows from discontinued operations - 83<br />
Net cashflows from investing activities (446) (681)<br />
Proceeds from issue of share capital 19 304<br />
Purchase of shares from minorities - (616)<br />
Dividends paid to ordinary shareholders (172) (102)<br />
Dividends paid to preference shareholders (9) (9)<br />
Dividends paid to minority interests (8) (31)<br />
Net movement in long term borrowings - (25)<br />
Net movement in other borrowings (2) 293<br />
Net cashflows from financing activities (172) (186)<br />
Net decrease in cash <strong>and</strong> cash equivalents <strong>and</strong> bank overdrafts (91) (564)<br />
Cash <strong>and</strong> cash equivalents <strong>and</strong> bank overdrafts at beginning of the year 1,538 2,040<br />
Effect of exchange rate changes on cash <strong>and</strong> cash equivalents 167 62<br />
Cash <strong>and</strong> cash equivalents <strong>and</strong> bank overdrafts at end of the year 1,614 1,538<br />
A reconciliation of cash <strong>and</strong> cash equivalents <strong>and</strong> bank overdrafts at the end of the period to the condensed consolidated<br />
balance sheet is included in note 7.<br />
The attached notes are an integral part of these condensed consolidated financial statements.<br />
25 Ι RSA Ι 2008 Year End Results Ι 26 February 2009
EXPLANATORY NOTES TO THE CONDENSED CONSOLIDATED FINANCIAL STATEMENTS<br />
1. Changes in significant accounting policies<br />
The annual financial statements are prepared in accordance with International Financial Reporting St<strong>and</strong>ards (IFRSs) as<br />
adopted by the European Union, <strong>and</strong> under the historical cost convention as modified by the revaluation of available for<br />
sale assets, investment property, Group occupied property <strong>and</strong> financial assets <strong>and</strong> financial liabilities held for trading<br />
(which include all derivative contracts). The condensed consolidated financial statements in this report have been<br />
prepared according to the same recognition <strong>and</strong> measurement criteria.<br />
There have been no significant changes in accounting policy <strong>and</strong> methods of computation in the twelve months to 31<br />
December 2008. A full list of accounting policies can be found in the 2008 Annual Report <strong>and</strong> Accounts (see note 10<br />
below).<br />
In considering the appropriateness of the going concern basis the Board have reviewed the Group's ongoing financial<br />
commitments for the next twelve months <strong>and</strong> beyond. The Board's review included consideration of the Group's<br />
underwriting plans, strong regulatory capital surplus, diverse insurance risk profile, considerable undrawn financing<br />
facilities <strong>and</strong> highly liquid investment portfolio. As a result of this review the Directors have satisfied themselves that it is<br />
appropriate to prepare these financial statements on a Going Concern basis.<br />
2. Operating segments<br />
12 months ended 31 December 2008<br />
UK International Emerging<br />
Markets<br />
Group<br />
Re<br />
Group<br />
£m £m £m £m £m<br />
Net written premiums 2,711 2,998 738 15 6,462<br />
Underwriting result 99 262 23 - 384<br />
Investment result 317 237 40 - 594<br />
Insurance result 416 499 63 - 978<br />
Other activities 1 (6) (29) (77) (111)<br />
Operating result (management basis) 417 493 34 (77) 867<br />
Amortisation (18)<br />
Less net share of loss after tax of associates 18<br />
Results of operating activities<br />
(per condensed consolidated income statement) 867<br />
Combined operating ratio (%) 97.6 91.2 96.4 - 94.5<br />
Segment assets (£m) 8,903 11,003 1,938 897 22,741<br />
12 months ended 31 December 2007<br />
UK International Emerging<br />
Markets<br />
Group<br />
Re<br />
Group<br />
£m £m £m £m £m<br />
Net written premiums 2,688 2,513 615 21 5,837<br />
Underwriting result 65 206 18 (11) 278<br />
Investment result 372 212 42 3 629<br />
Insurance result 437 418 60 (8) 907<br />
Other activities (1) (8) (6) (78) (93)<br />
Operating result (management basis) 436 410 54 (86) 814<br />
Amortisation (18)<br />
Results of operating activities<br />
(per condensed consolidated income statement) 796<br />
Combined operating ratio (%) 97.6 91.3 95.3 - 94.9<br />
Segment assets (£m) 8,716 8,977 1,474 1,213 20,380<br />
26 Ι RSA Ι 2008 Year End Results Ι 26 February 2009
The Group’s results are not subject to any significant impact arising from the seasonality or cyclicality of operations,<br />
although there is some seasonality in the regions within which the Group operates.<br />
The information above (including the 2007 comparative data) has been prepared on the same basis as reported in the<br />
2008 Annual Report <strong>and</strong> Accounts. The segment assets exclude investment in associates <strong>and</strong> non current <strong>and</strong> disposal<br />
group assets held for sale.<br />
3. Earnings per share<br />
The earnings per share is calculated by reference to the result attributable to the equity shareholders <strong>and</strong> the weighted<br />
average number of shares in issue during the period. On a basic <strong>and</strong> diluted basis this was 3,273,492,014 <strong>and</strong><br />
3,328,303,198 respectively (excluding those held in ESOP trusts). The number of shares in issue at 31 December 2008 was<br />
3,317,539,143 (excluding those held in ESOP trusts).<br />
4. Changes in estimates of amounts reported in prior financial years<br />
During 2008, changes to claims reserve estimates made in prior years as a result of reserve development is included in<br />
the prior year profit of £291m (2007: £348m).<br />
The Group pension fund surplus net of tax as at 31 December 2008 is £363m (31 December 2007: £116m). Further<br />
information on the pension fund surplus is included on page 12.<br />
5. Business combination <strong>and</strong> other changes in the structure of the Group<br />
On 11 February 2008, the Group acquired 100% of the share capital of Fyfe Group Limited in the UK. On 31 March 2008,<br />
the Group acquired 100% of the share capital of Sertus Underwriting Limited in Irel<strong>and</strong>. The Group also made small<br />
acquisitions in Canada <strong>and</strong> Sc<strong>and</strong>inavia. The total consideration was £28m <strong>and</strong> goodwill of £25m arose on acquisitions.<br />
The acquisitions do not have a material impact on the Group’s results for 2008.<br />
On 29 February 2008 the Group obtained regulatory approval for the disposal of Guildhall Insurance Company Limited.<br />
The disposal generated a £1m pre tax profit. The net assets were classified as held for sale at 31 December 2007. On<br />
18 May 2008 the Group dissolved a French subsidiary, <strong>Royal</strong> & <strong>Sun</strong> <strong>Alliance</strong> SA that generated a £17m pre tax profit.<br />
The profits on disposal represent foreign exchange, which is recycled from shareholders' funds <strong>and</strong> does not impact total<br />
equity.<br />
6. Changes in total equity <strong>and</strong> reserves for the period to 31 December<br />
Total<br />
Shareholders' Minority equity <strong>and</strong><br />
funds interest reserves<br />
£m £m £m<br />
Balance at 1 January 2008 3,077 67 3,144<br />
Total recognised income for the year 901 22 923<br />
Share issue 84 - 84<br />
Changes in shareholders' interests in subsidiaries (2) - (2)<br />
Share options 25 - 25<br />
Prior year final dividend (147) (8) (155)<br />
Current year interim dividend (90) - (90)<br />
Preference dividend (9) - (9)<br />
Balance at 31 December 2008 3,839 81 3,920<br />
27 Ι RSA Ι 2008 Year End Results Ι 26 February 2009
6. Changes in total equity <strong>and</strong> reserves for the period to 31 December (continued)<br />
28 Ι RSA Ι 2008 Year End Results Ι 26 February 2009<br />
Total<br />
Shareholders' Minority equity <strong>and</strong><br />
funds interest reserves<br />
£m £m £m<br />
Balance at 1 January 2007 2,561 331 2,892<br />
Total recognised income for the year 670 15 685<br />
Share issue 404 - 404<br />
Changes in shareholders' interests in subsidiaries (368) (248) (616)<br />
Share options 21 - 21<br />
Prior year final dividend (123) (31) (154)<br />
Current year interim dividend (79) - (79)<br />
Preference dividend (9) - (9)<br />
Balance at 31 December 2007 3,077 67 3,144<br />
During the twelve months to 31 December 2008, 24,707,235 (2007: 12,448,823) ordinary shares were issued on the exercise<br />
of employee share options. The Company also issued 51,770,891 (2007: 66,632,200) ordinary shares under the scrip<br />
scheme approved by the shareholders at the 2008 Annual General Meeting. During 2007, the Company issued 186,350,000<br />
ordinary shares in a placing to fund the acquisition of Codan A/S.<br />
7. Cashflow<br />
12 Months 12 Months<br />
2008 2007<br />
£m £m<br />
Cash <strong>and</strong> cash equivalents <strong>and</strong> bank overdrafts (as reported within the condensed<br />
cashflow statement) 1,614 1,538<br />
Add: bank overdrafts - 3<br />
Transfer to non current <strong>and</strong> disposal group assets held for sale - (32)<br />
Total cash <strong>and</strong> cash equivalents 1,614 1,509<br />
8. Dividends<br />
31 December 2008 31 December 2007<br />
Per share Total Per share Total<br />
p £m p £m<br />
Ordinary dividend<br />
Final paid in respect of prior year 4.53 147 4.12 123<br />
Interim paid in respect of current year 2.73 90 2.48 79<br />
7.26 237 6.60 202<br />
Preference dividend 9 9<br />
246 211<br />
9. Exchange rates<br />
Local currency/£ 12 Months 2008 12 Months 2007<br />
Average Closing Average Closing<br />
Canadian Dollar 1.96 1.77 2.14 1.96<br />
Danish Kroner 9.39 7.70 10.88 10.15<br />
Euro 1.26 1.03 1.46 1.36<br />
10. Results for 2008<br />
The financial information set out in the announcement does not constitute the company’s statutory accounts for the years<br />
ended 31 December 2008 or 2007. The financial information for the year ended 31 December 2007 is derived from the<br />
statutory accounts for that year which have been delivered to the Registrar of Companies. The statutory Group financial<br />
statement of RSA Insurance Group plc for the year ended 31 December 2008 will be delivered to the Registrar of<br />
Companies following the Annual General Meeting to be held on 18 May 2009. The independent auditors’ reports on the<br />
Group accounts for the years ended 31 December 2007 <strong>and</strong> 2008 were unqualified, did not draw attention to any matters<br />
by way of emphasis <strong>and</strong> did not include a statement under section 237(2) or (3) of the Companies Act 1985.
RESPONSIBILITY STATEMENT<br />
We confirm that to the best of our knowledge:<br />
a) The financial statements within the full Annual Report & Accounts, from which the financial information within this<br />
preliminary announcement has been extracted, are prepared in accordance with International Financial Reporting<br />
St<strong>and</strong>ards as adopted by the EU, give a fair view of the assets, liabilities, financial position <strong>and</strong> profit or loss of the<br />
Group,<br />
b) The Management Report within this preliminary announcement includes a fair review of the development <strong>and</strong><br />
performance of the business <strong>and</strong> the position of the Group, <strong>and</strong><br />
c) The Estimation Techniques, risks, uncertainties <strong>and</strong> contingencies section within this preliminary announcement<br />
includes a description of the principal risks <strong>and</strong> uncertainties faced by the Group.<br />
Signed on behalf of the Board<br />
Andy Haste<br />
Chief Executive Officer<br />
George Culmer<br />
Chief Financial Officer<br />
25 February 2009 25 February 2009<br />
29 Ι RSA Ι 2008 Year End Results Ι 26 February 2009
30 Ι RSA Ι 2008 Year End Results Ι 26 February 2009<br />
THIS PAGE INTENTIONALLY LEFT BLANK