AWB Limited - 2004 Annual Report
AWB Limited - 2004 Annual Report
AWB Limited - 2004 Annual Report

Create successful ePaper yourself
Turn your PDF publications into a flip-book with our unique Google optimized e-Paper software.
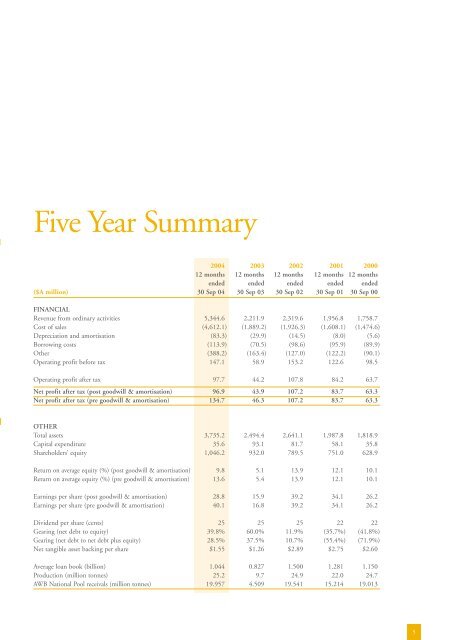
Five Year Summary<br />
<strong>2004</strong> 2003 2002 2001 2000<br />
12 months 12 months 12 months 12 months 12 months<br />
ended ended ended ended ended<br />
($A million) 30 Sep 04 30 Sep 03 30 Sep 02 30 Sep 01 30 Sep 00<br />
FINANCIAL<br />
Revenue from ordinary activities<br />
Cost of sales<br />
Depreciation and amortisation<br />
Borrowing costs<br />
Other<br />
Operating profit before tax<br />
5,344.6<br />
(4,612.1)<br />
(83.3)<br />
(113.9)<br />
(388.2)<br />
147.1<br />
2,211.9<br />
(1,889.2)<br />
(29.9)<br />
(70.5)<br />
(163.4)<br />
58.9<br />
2,319.6 1,956.8 1,758.7<br />
(1,926.3) (1,608.1) (1,474.6)<br />
(14.5) (8.0) (5.6)<br />
(98.6) (95.9) (89.9)<br />
(127.0) (122.2) (90.1)<br />
153.2 122.6 98.5<br />
Operating profit after tax<br />
97.7<br />
44.2<br />
107.8 84.2 63.7<br />
Net profit after tax (post goodwill & amortisation)<br />
Net profit after tax (pre goodwill & amortisation)<br />
96.9<br />
134.7<br />
43.9<br />
46.3<br />
107.2 83.7 63.3<br />
107.2 83.7 63.3<br />
OTHER<br />
Total assets<br />
Capital expenditure<br />
Shareholders’ equity<br />
3,735.2<br />
35.6<br />
1,046.2<br />
2,494.4<br />
93.1<br />
932.0<br />
2,641.1<br />
81.7<br />
789.5<br />
1,987.8 1,818.9<br />
58.1 35.8<br />
751.0 628.9<br />
Return on average equity (%) (post goodwill & amortisation)<br />
Return on average equity (%) (pre goodwill & amortisation)<br />
9.8<br />
13.6<br />
5.1<br />
5.4<br />
13.9<br />
13.9<br />
12.1 10.1<br />
12.1 10.1<br />
Earnings per share (post goodwill & amortisation)<br />
Earnings per share (pre goodwill & amortisation)<br />
28.8<br />
40.1<br />
15.9<br />
16.8<br />
39.2<br />
39.2<br />
34.1 26.2<br />
34.1 26.2<br />
Dividend per share (cents)<br />
Gearing (net debt to equity)<br />
Gearing (net debt to net debt plus equity)<br />
Net tangible asset backing per share<br />
25<br />
39.8%<br />
28.5%<br />
$1.55<br />
25<br />
60.0%<br />
37.5%<br />
$1.26<br />
25<br />
11.9%<br />
10.7%<br />
$2.89<br />
22 22<br />
(35.7%) (41.8%)<br />
(55.4%) (71.9%)<br />
$2.75 $2.60<br />
Average loan book (billion)<br />
Production (million tonnes)<br />
<strong>AWB</strong> National Pool receivals (million tonnes)<br />
1.044<br />
25.2<br />
19.957<br />
0.827<br />
9.7<br />
4.509<br />
1.500<br />
24.9<br />
19.541<br />
1.281 1.150<br />
22.0 24.7<br />
15.214 19.013<br />
5