Transportation Master Plan - Ottawa Confederation Line
Transportation Master Plan - Ottawa Confederation Line
Transportation Master Plan - Ottawa Confederation Line

Create successful ePaper yourself
Turn your PDF publications into a flip-book with our unique Google optimized e-Paper software.
2.3 Current Travel Patterns and Trends<br />
Results of the 2005 Origin-Destination (OD) survey of over 24,000 households in the National<br />
Capital Region provide a snapshot of weekday personal travel patterns by persons aged 11 years<br />
or more. These results can also be compared to those of previous surveys in 1986 and 1995 to<br />
illustrate changes in transportation activity that have occurred in <strong>Ottawa</strong>. The OD survey did not<br />
capture weekend travel, commercial trips or trips generated outside the National Capital Region.<br />
Within this section, data are for the National Capital Region unless otherwise noted.<br />
2.3.1 Individual and Household Characteristics<br />
Occupation. The 2005 survey found that (rounded figures) 74% of persons aged 11 or older were<br />
employed individuals or students, seniors accounted for a further 17%, homemakers 5% and<br />
others 5% (e.g. unemployed).<br />
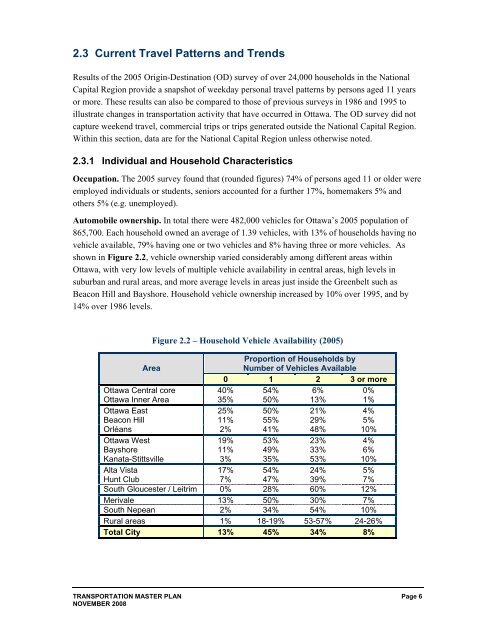
Automobile ownership. In total there were 482,000 vehicles for <strong>Ottawa</strong>’s 2005 population of<br />
865,700. Each household owned an average of 1.39 vehicles, with 13% of households having no<br />
vehicle available, 79% having one or two vehicles and 8% having three or more vehicles. As<br />
shown in Figure 2.2, vehicle ownership varied considerably among different areas within<br />
<strong>Ottawa</strong>, with very low levels of multiple vehicle availability in central areas, high levels in<br />
suburban and rural areas, and more average levels in areas just inside the Greenbelt such as<br />
Beacon Hill and Bayshore. Household vehicle ownership increased by 10% over 1995, and by<br />
14% over 1986 levels.<br />
Figure 2.2 – Household Vehicle Availability (2005)<br />
Proportion of Households by<br />
Area<br />
Number of Vehicles Available<br />
0 1 2 3 or more<br />
<strong>Ottawa</strong> Central core 40% 54% 6% 0%<br />
<strong>Ottawa</strong> Inner Area 35% 50% 13% 1%<br />
<strong>Ottawa</strong> East 25% 50% 21% 4%<br />
Beacon Hill 11% 55% 29% 5%<br />
Orléans 2% 41% 48% 10%<br />
<strong>Ottawa</strong> West 19% 53% 23% 4%<br />
Bayshore 11% 49% 33% 6%<br />
Kanata-Stittsville 3% 35% 53% 10%<br />
Alta Vista 17% 54% 24% 5%<br />
Hunt Club 7% 47% 39% 7%<br />
South Gloucester / Leitrim 0% 28% 60% 12%<br />
Merivale 13% 50% 30% 7%<br />
South Nepean 2% 34% 54% 10%<br />
Rural areas 1% 18-19% 53-57% 24-26%<br />
Total City 13% 45% 34% 8%<br />
TRANSPORTATION MASTER PLAN Page 6<br />
NOVEMBER 2008