Transportation Master Plan - Ottawa Confederation Line
Transportation Master Plan - Ottawa Confederation Line
Transportation Master Plan - Ottawa Confederation Line

You also want an ePaper? Increase the reach of your titles
YUMPU automatically turns print PDFs into web optimized ePapers that Google loves.
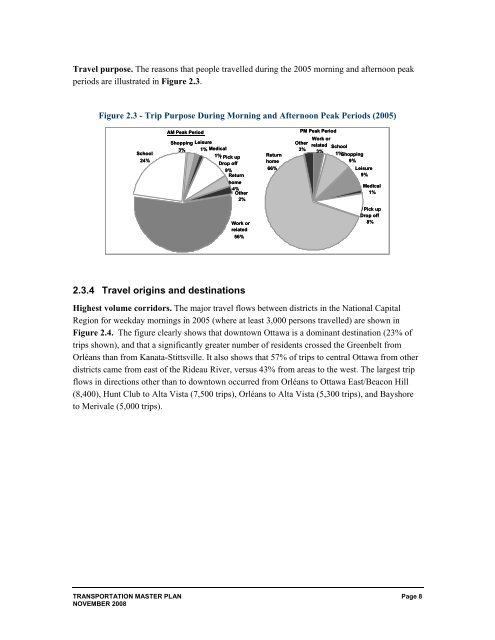
Travel purpose. The reasons that people travelled during the 2005 morning and afternoon peak<br />
periods are illustrated in Figure 2.3.<br />
Figure 2.3 - Trip Purpose During Morning and Afternoon Peak Periods (2005)<br />
School<br />
24%<br />
AM Peak Period<br />
Shopping<br />
Leisure<br />
3%<br />
1%<br />
Medical<br />
1% / Pick up<br />
Drop off<br />
9%<br />
Return<br />
home<br />
4%<br />
Other<br />
2%<br />
Return<br />
home<br />
66%<br />
PM Peak Period<br />
Work or<br />
Other<br />
related<br />
School<br />
3%<br />
3%<br />
1%<br />
Shopping<br />
9%<br />
Leisure<br />
9%<br />
Medical<br />
1%<br />
Work or<br />
related<br />
56%<br />
/ Pick up<br />
Drop off<br />
8%<br />
2.3.4 Travel origins and destinations<br />
Highest volume corridors. The major travel flows between districts in the National Capital<br />
Region for weekday mornings in 2005 (where at least 3,000 persons travelled) are shown in<br />
Figure 2.4. The figure clearly shows that downtown <strong>Ottawa</strong> is a dominant destination (23% of<br />
trips shown), and that a significantly greater number of residents crossed the Greenbelt from<br />
Orléans than from Kanata-Stittsville. It also shows that 57% of trips to central <strong>Ottawa</strong> from other<br />
districts came from east of the Rideau River, versus 43% from areas to the west. The largest trip<br />
flows in directions other than to downtown occurred from Orléans to <strong>Ottawa</strong> East/Beacon Hill<br />
(8,400), Hunt Club to Alta Vista (7,500 trips), Orléans to Alta Vista (5,300 trips), and Bayshore<br />
to Merivale (5,000 trips).<br />
TRANSPORTATION MASTER PLAN Page 8<br />
NOVEMBER 2008