Transportation Master Plan - Ottawa Confederation Line
Transportation Master Plan - Ottawa Confederation Line
Transportation Master Plan - Ottawa Confederation Line

You also want an ePaper? Increase the reach of your titles
YUMPU automatically turns print PDFs into web optimized ePapers that Google loves.
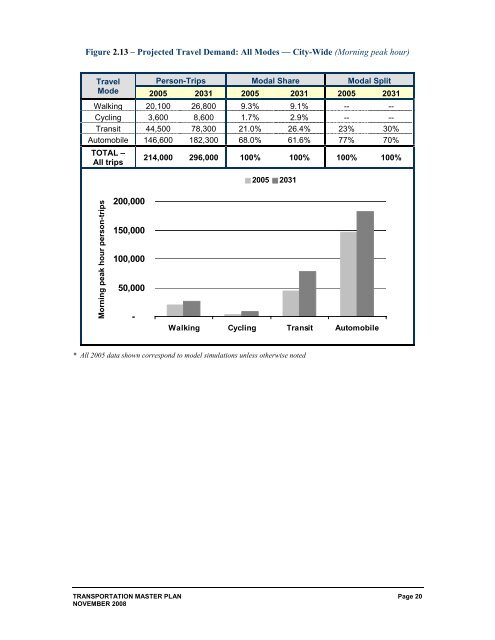
Figure 2.13 – Projected Travel Demand: All Modes — City-Wide (Morning peak hour)<br />
Travel Person-Trips Modal Share Modal Split<br />
Mode 2005 2031 2005 2031 2005 2031<br />
Walking 20,100 26,800 9.3% 9.1% -- --<br />
Cycling 3,600 8,600 1.7% 2.9% -- --<br />
Transit 44,500 78,300 21.0% 26.4% 23% 30%<br />
Automobile 146,600 182,300 68.0% 61.6% 77% 70%<br />
TOTAL –<br />
All trips<br />
214,000 296,000 100% 100% 100% 100%<br />
2005 2031<br />
Morning peak hour person-trips<br />
200,000<br />
150,000<br />
100,000<br />
50,000<br />
-<br />
Walking Cycling Transit Automobile<br />
* All 2005 data shown correspond to model simulations unless otherwise noted<br />
TRANSPORTATION MASTER PLAN Page 20<br />
NOVEMBER 2008