A N N U A L R E P O R T 1 9 9 9
A N N U A L R E P O R T 1 9 9 9
A N N U A L R E P O R T 1 9 9 9

You also want an ePaper? Increase the reach of your titles
YUMPU automatically turns print PDFs into web optimized ePapers that Google loves.
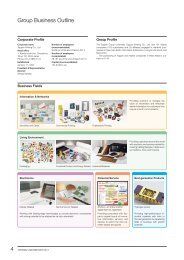
Toppan Printing Co., Ltd. and Subsidiaries<br />
CONSOLIDATED FIVE-YEAR FINANCIAL SUMMARY<br />
Toppan Printing Co., Ltd. and Subsidiaries<br />
For the years ended March 31<br />
Millions of yen except per share data<br />
Thousands of dollars*<br />
1995 1996 1997 1998 1999 1999<br />
For the Year:<br />
Net sales ¥1,130,569 ¥1,186,592 ¥1,274,339 ¥1,284,145 ¥1,223,439 $10,111,066<br />
Cost of sales 933,587 990,642 1,054,486 1,059,558 1,030,295 8,514,835<br />
% of net sales 82.6% 83.5% 82.7% 82.5% 84.2% —<br />
SG&A expenses 115,145 125,129 131,711 130,262 127,927 1,057,248<br />
% of net sales 10.2% 10.5% 10.3% 10.1% 10.5% —<br />
Operating income 81,837 70,821 88,142 94,325 65,217 538,983<br />
% of net sales 7.2% 6.0% 6.9% 7.3% 5.3% —<br />
Income before income taxes 54,894 79,513 69,792 105,714 57,515 475,331<br />
Net income 15,881 39,705 21,621 47,381 26,700 220,661<br />
% of net sales 1.40% 3.35% 1.70% 3.69% 2.18% —<br />
% of average assets 1.49% 3.62% 1.90% 3.86% 2.08% —<br />
% of average equity 2.88% 6.78% 3.57% 7.40% 3.95% —<br />
Per share of common stock (yen and dollars):<br />
Net income ¥22.87 ¥54.57 ¥30.25 ¥65.50 ¥37.29 $0.31<br />
Cash dividends 13.00 13.00 14.00 15.00 15.00 0.12<br />
R&D expenses ¥15,090 ¥15,426 ¥15,874 ¥17,131 ¥18,875 $155,992<br />
Capital expenditures 64,096 69,878 83,104 123,515 93,513 772,835<br />
Depreciation and amortization 49,680 50,654 53,724 57,824 60,274 498,132<br />
At Year-End:<br />
Current assets ¥ 578,760 ¥ 621,280 ¥ 628,598 ¥ 711,977 ¥ 643,415 $5,317,479<br />
Current Iiabilities 387,526 429,845 449,186 462,817 409,995 3,388,388<br />
Working capital 191,234 191,435 179,412 249,160 233,420 1,929,091<br />
Cash and cash equivalents 160,376 179,466 164,214 239,308 179,678 1,484,942<br />
Property, plant and equipment,<br />
net of depreciation 340,198 357,436 385,535 445,916 476,649 3,939,248<br />
Long-term indebtedness 83,864 66,616 64,279 113,050 114,242 944,149<br />
Total assets 1,069,042 1,126,303 1,151,883 1,300,649 1,267,357 10,474,025<br />
Shareholders’ investment 570,276 600,424 612,265 667,464 683,906 5,652,116<br />
Equity ratio 53.3% 53.3% 53.2% 51.3% 54.0% —<br />
Debt-equity ratio 19.7% 18.9% 16.4% 21.5% 20.7% —<br />
Other Statistics:<br />
Number of employees 32,953 33,479 33,719 34,402 33,464<br />
Number of common shares<br />
outstanding 699,246 699,282 699,300 699,411 699,411<br />
* U.S. dollar amounts are translated from yen at the rate of ¥121=U.S.$1, as at March 31, 1999.<br />
Note 1: The consolidated results for the year ended March 31, 1995, reflect the ¥18,223 million ($150,603 thousand) write-off pertaining to the acquisition of Toppan Moore Co.,<br />
Ltd.’s goodwill.<br />
Note 2: The consolidated results for the year ended March 31, 1996, include the ¥10,362 million ($85,636 thousand) proceeds from the sale of Toppan Printing Co. (H.K.) Ltd.’s land.<br />
Note 3: The consolidated results for the year ended March 31, 1997, reflect the ¥9,015 million ($74,504 thousand) write-off pertaining to the acquisitions of Toppan Moore Co.,<br />
Ltd.’s and Avery Toppan Co., Ltd.’s goodwill.<br />
Note 4: The consolidated results for the year ended March 31, 1998, reflect the ¥20,868 million ($172,463 thousand) gain on sale of investment in Toppan Forms Co., Ltd.<br />
(Toppan Moore Co., Ltd. changed its name to Toppan Forms Co., Ltd. on April 1, 1997.)<br />
23