Raman and Luminescence Images Applied to Study Internal
Raman and Luminescence Images Applied to Study Internal
Raman and Luminescence Images Applied to Study Internal

You also want an ePaper? Increase the reach of your titles
YUMPU automatically turns print PDFs into web optimized ePapers that Google loves.
CORALS II Conference (2011)<br />
RAMAN AND LUMINESCENCE IMAGING APPLIED TO STUDY THE INTERNAL TEXTURES OF<br />
MINERALS AND GEOLOGICAL SAMPLES. L. Nasdala, Institute for Mineralogy <strong>and</strong> Crystallography, University<br />
of Vienna, Althanstr. 14, A–1090 Wien, Austria (lutz.nasdala@univie.ac.at).<br />
Minerals are typically characterized by deviations<br />
from their perfect structural state <strong>and</strong> ideal chemical<br />
composition. Such deviations from perfectness, which<br />
are commonly described as real structure, include not<br />
only point defects (i.e., substitutions of an a<strong>to</strong>mic species<br />
by another element, vacancies, or interstitials) but<br />
also domain or twin boundaries, dislocations, stacking<br />
faults, inclusions of other phases, strain, <strong>and</strong> many<br />
more. For an overview see [1].<br />
If such real-structure properties show a marked<br />
heterogeneity pattern within a mineral, this is referred<br />
<strong>to</strong> as internal texture. Note that, in view of the definitions<br />
of the terms, the formerly more common description<br />
as “internal structures” should better be avoided<br />
(cf. [2]). Common internal textures of minerals include,<br />
among others, primary growth <strong>and</strong> sec<strong>to</strong>r zoning,<br />
diffusion zoning, patchy or other alteration patterns,<br />
stress textures, <strong>and</strong> exsolution patterns.<br />
The investigation of such patterns of heterogeneity<br />
may provide detailed information on the primary formation<br />
<strong>and</strong> post-growth alteration of crystals <strong>and</strong> minerals.<br />
An increasing number of analytical techniques is<br />
therefore applied <strong>to</strong> visualize internal textures of minerals<br />
<strong>and</strong> other geological samples. Recent needs,<br />
however, are in many cases not met anymore by the<br />
mere visualization of internal distribution patterns, but<br />
require (i) a more quantitative evaluation of the variable<br />
parameter under discussion, <strong>and</strong> (ii) better underst<strong>and</strong>ing<br />
of what exactly is visualized. To give an example<br />
for the latter, SEM–CL imaging of zircon grains<br />
has become a routine technique prior <strong>to</strong> U–Pb iso<strong>to</strong>pic<br />
measureements in a SHRIMP or LA–ICP–MS system.<br />
Here, the mere knowledge of the extension of interior<br />
regions <strong>and</strong> zones <strong>and</strong> the location of their boundaries<br />
is sufficient for placing carefully single measurements<br />
within zones, <strong>and</strong> hence <strong>to</strong> avoid biased results. For<br />
sound conclusions on the sample’s his<strong>to</strong>ry, however,<br />
knowledge of the causes of the variations in CL emission<br />
among zones would be most useful.<br />
There are two principally different ways <strong>to</strong> generate<br />
images from luminescence or <strong>Raman</strong> scattered<br />
light (the same is true for the application of other analytical<br />
techniques). First, images can be obtained directly:<br />
The detec<strong>to</strong>r of the analytical system collects an<br />
either panchromatic or monochromatic image of the<br />
area <strong>to</strong> be studied. This technique is used commonly <strong>to</strong><br />
obtain CL or PL images whereas direct <strong>Raman</strong> imaging<br />
is rarely applied in the Earth sciences. To obtain a<br />
direct image, the area of interest is either illumi-<br />
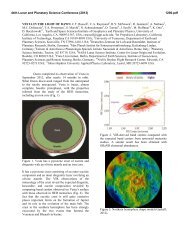
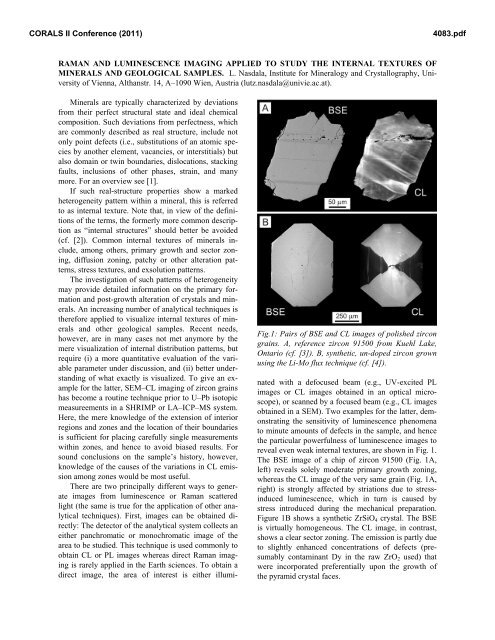
Fig.1: Pairs of BSE <strong>and</strong> CL images of polished zircon<br />
grains. A, reference zircon 91500 from Kuehl Lake,<br />
Ontario (cf. [3]). B, synthetic, un-doped zircon grown<br />
using the Li-Mo flux technique (cf. [4]).<br />
nated with a defocused beam (e.g., UV-excited PL<br />
images or CL images obtained in an optical microscope),<br />
or scanned by a focused beam (e.g., CL images<br />
obtained in a SEM). Two examples for the latter, demonstrating<br />
the sensitivity of luminescence phenomena<br />
<strong>to</strong> minute amounts of defects in the sample, <strong>and</strong> hence<br />
the particular powerfulness of luminescence images <strong>to</strong><br />
reveal even weak internal textures, are shown in Fig. 1.<br />
The BSE image of a chip of zircon 91500 (Fig. 1A,<br />
left) reveals solely moderate primary growth zoning,<br />
whereas the CL image of the very same grain (Fig. 1A,<br />
right) is strongly affected by striations due <strong>to</strong> stressinduced<br />
luminescence, which in turn is caused by<br />
stress introduced during the mechanical preparation.<br />
Figure 1B shows a synthetic ZrSiO4 crystal. The BSE<br />
is virtually homogeneous. The CL image, in contrast,<br />
shows a clear sec<strong>to</strong>r zoning. The emission is partly due<br />
<strong>to</strong> slightly enhanced concentrations of defects (presumably<br />
contaminant Dy in the raw ZrO2 used) that<br />
were incorporated preferentially upon the growth of<br />
the pyramid crystal faces.<br />
4083.pdf
CORALS II Conference (2011)<br />
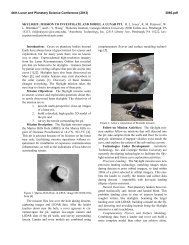
Fig. 2: Color-coded <strong>Raman</strong> map of a polished agate<br />
from Saxony, Germany, generated from 54,096 single<br />
analyses (step width 2.5 �m). Strong zoning of the intensity<br />
ratio of the main b<strong>and</strong>s of moganite (502 cm �1 )<br />
<strong>and</strong> �-quartz (464 cm �1 ) indicates a strongly rhythmic<br />
growth.<br />
Second, images can be generated mathematically<br />
from hyperspectral data sets: A full emission or <strong>Raman</strong><br />
spectrum is recorded per individual sampling point<br />
(i.e., per pixel of the future image). The whole data set<br />
is then processed (i.e., background correction <strong>and</strong> b<strong>and</strong><br />
fitting), <strong>and</strong> colour-coded images visualizing the lateral<br />
distribution of virtually any user-defined spectral<br />
parameter across the mapped area can be produced.<br />
In contrast <strong>to</strong> luminescence imaging, the hyperspectral<br />
mapping technique is applied comparably<br />
rarely in the study of luminescence emissions. Mapping<br />
is applied mostly in cases where more detailed<br />
spectral information is needed [5,6], or if the information<br />
cannot be obtained in direct images. For instance,<br />
FLIM (fluorescence lifetime imaging microscopy)<br />
images show color-coded the distribution of luminescence<br />
decay times across the area visualized [7].<br />
During the past few years, the hyperspectral <strong>Raman</strong><br />
mapping technique has been applied successfully<br />
in virtually all sub-disciplines of the Earth sciences.<br />
The primary zoning of crystals is detectable in <strong>Raman</strong><br />
maps because the inhomogeneous incorporation of<br />
non-formula elements during primary growth causes<br />
heterogeneous lattice strain [8,9]. At least as informative,<br />
for the underst<strong>and</strong>ing of secondary processes in a<br />
sample’s post-growth his<strong>to</strong>ry, is the application of<br />
highly-ressolved <strong>Raman</strong> maps in the study of altera-<br />
tion textures in naturally formed minerals [10] or<br />
technical products [11]. <strong>Raman</strong> mapping is increasingly<br />
used <strong>to</strong> investigate non-destructively gem mate-<br />
rials <strong>and</strong> precious art objects, <strong>and</strong> in the study of geological<br />
samples of extraterrestrial origin, such as star<br />
dust <strong>and</strong> meteorites [12,13]. Another increasing field<br />
of application are studies dealing with mineral formation<br />
at high pressure, both in the Earth’s interior (i.e.,<br />
primary growth <strong>and</strong> metamorphism) <strong>and</strong> near the<br />
Earth’s surface (i.e., due <strong>to</strong> impact events) [14,15].<br />
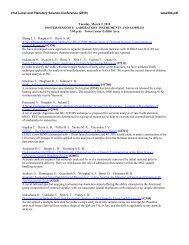
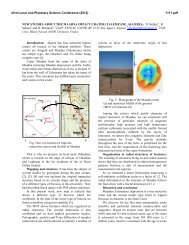
An example for the latter is presented in Fig. 3:<br />
The <strong>Raman</strong> map of this diamond crystal containing a<br />
graphite inclusion, showing the distribution of the<br />
width of the main LO=TO b<strong>and</strong> of diamond near 1332<br />
cm –1 , is affected by two features. First, there are minute<br />
but still well-detectable variations among primary<br />
growth zones, perhaps due <strong>to</strong> small variations in trace<br />
elements <strong>and</strong>/or structural defects. The map shows that<br />
the graphite is located in the center of the diamond<br />
zoning. This led <strong>to</strong> the conclusion that the graphite<br />
inclusion must be pro<strong>to</strong>genetic in nature (i.e., the<br />
graphite was the primary phase <strong>and</strong> was overgrown by<br />
diamond; [16]). Second, compressive stress still acting<br />
on the inclusion (caused by heterogeoeus volume expansion<br />
of the diamond–graphite couple upon uplift <strong>to</strong><br />
the Earth’s surface) results in strong upshift <strong>and</strong><br />
broadening of the LO=TO b<strong>and</strong> [17]. The circular<br />
Fig. 3: Diamond crystal containing a single-crystal<br />
graphite inclusion, from the P<strong>and</strong>a kimberlite, Canada.<br />
A, pho<strong>to</strong>micrograph. B, color-coded <strong>Raman</strong> map<br />
(52,074 single analyses; step width 5 �m) showing the<br />
heterogeneous broadening of the main diamond b<strong>and</strong>.<br />
4083.pdf
CORALS II Conference (2011)<br />
black feature in Fig. 3B hence indicates an area of particularly<br />
extensive compression of the diamond lattice.<br />
To finish the – still incomplete – list of geoscientific<br />
fields in which <strong>Raman</strong> mapping has recently received<br />
particular attention, applications in the study of minerals<br />
that suffered radiation damage (Fig. 4; e.g., [18]),<br />
investigation of biominerals such as ivory, bones, <strong>and</strong><br />
pearls, <strong>and</strong> studies of microfossils [19,20] are mentioned.<br />
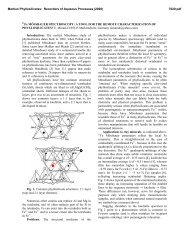
Fig. 4: Radiohaloes in cordierite from the Strangways<br />
Range, Australia. A, pho<strong>to</strong>micrograph. B, composite<br />
<strong>Raman</strong> map (7,134 point analyses; step width 3 �m),<br />
showing the locations of radioactive inclusions (red,<br />
monazite; green, zircon) <strong>and</strong> the broadening of a cordierite<br />
b<strong>and</strong> (blue) due <strong>to</strong> the irradiation damage.<br />
The various sorts of imperfectness of minerals, <strong>and</strong><br />
their spatial distribution patterns, constitute a record of<br />
a sample’s geological his<strong>to</strong>ry. This is because minerals<br />
are formed mostly in a non-homogeneous process,<br />
consisting of the primary growth <strong>and</strong> possible secondary<br />
alteration, both occurring in natural <strong>and</strong> hence<br />
“polluted” milieus. Correspondingly, the study of internal<br />
textures of minerals may provide a wealth of<br />
valuable information. <strong>Images</strong> or distribution patterns<br />
generated from luminescence emissions or <strong>Raman</strong><br />
scattered light have proven <strong>to</strong> be most versatile <strong>to</strong>ols in<br />
the study of internal textures of minerals <strong>and</strong> geological<br />
samples. The powerfulness of the two techniques<br />
discussed in detail in this plenary lecture is due <strong>to</strong> the<br />
particular sensitivity <strong>to</strong> minute variations of defects<br />
(luminescence) <strong>and</strong> the ability <strong>to</strong> detect <strong>and</strong> visualize a<br />
broad range of physical parameters (<strong>Raman</strong>), respectively.<br />
References: [1] Putnis A. (1992) Introduction <strong>to</strong><br />
Mineral Sciences. Univ. Press, Cambridge. [2] Corfu<br />
F. et al. (2003) Rev. Mineral. Geochem., 53, 469–500.<br />
[3] Wiedenbeck M. et al. (2004) Geost<strong>and</strong>ard.<br />
Geoanal. Res., 28, 9–39. [4] Hanchar J. M. et al.<br />
(2991) Am. Mineral., 86, 667–680. [5] Lee M. R. et al.<br />
(2005) J. Sediment. Res., 75, 313–322. [6] Engl<strong>and</strong> J.<br />
et al. (2006) J. Geophys. Res., 111, G03001. [7] Ryder<br />
A. G. et al. (2004) Appl. Spectrosc., 58, 1106�1115.<br />
[8] Nasdala L. et al. (2003) Rev. Mineral. Geochem.,<br />
53, 427–467. [9] Geisler T. et al. (2005) Eur. J. Mineral.,<br />
17, 883�894. [10] Niedermeier D. R. D. et al.<br />
(2009) Contrib. Mineral. Petr., 157, 65–76. [11] Corvisier<br />
J. et al. (2009) Eur. J. Mineral., 22, 63–74. [12]<br />
Burchell M. J. et al. (2006) Meteorit. Planet. Sci., 41,<br />
217�232. [13] Ferroir T. et al. (2008) Earth. Plan. Sci.<br />
Lett., 275, 26�31. [14] Korsakov A. V. et al. (2007)<br />
Spectrochim. Acta A, 68, 1046�1052. [15] Chopin C.<br />
et al. (2008) Eur. J. Mineral., 20, 857�865. [16] Nasdala<br />
L. et al. (2005) Am. Mineral., 90, 745–748. [17]<br />
Grimsditch M. H. et al. (1978) Phys. Rev. B, 18, 901–<br />
904. [18] Nasdala L. et al. (2006) Miner. Petrol., 86,<br />
1–27. [19] Chen J. Y. et al. (2007) Proc. Natl. Acad.<br />
Sci., 64, 6289�6292. [20] Bernard S. et al. (2007)<br />
Earth Planet. Sc. Lett., 262, 257�272.<br />
4083.pdf