Vodafone Group Plc Annual Report for the year ended 31 March 2012
Vodafone Group Plc Annual Report for the year ended 31 March 2012
Vodafone Group Plc Annual Report for the year ended 31 March 2012

You also want an ePaper? Increase the reach of your titles
YUMPU automatically turns print PDFs into web optimized ePapers that Google loves.
<strong>Vodafone</strong> <strong>Group</strong> <strong>Plc</strong><br />
<strong>Annual</strong> <strong>Report</strong> <strong>2012</strong> 106<br />
Notes to <strong>the</strong> consolidated financial statements (continued)<br />
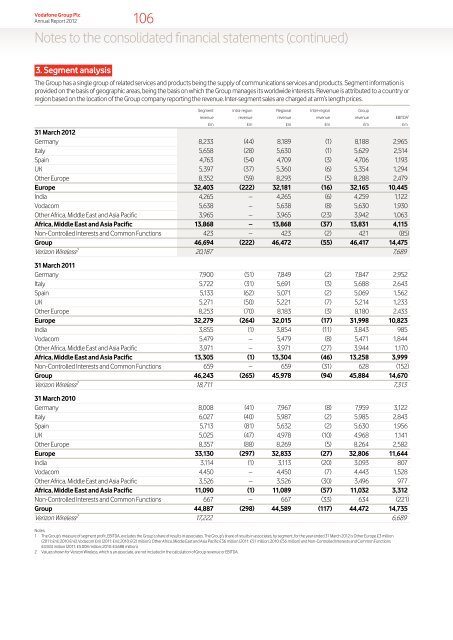
3. Segment analysis<br />
The <strong>Group</strong> has a single group of related services and products being <strong>the</strong> supply of communications services and products. Segment in<strong>for</strong>mation is<br />
provided on <strong>the</strong> basis of geographic areas, being <strong>the</strong> basis on which <strong>the</strong> <strong>Group</strong> manages its worldwide interests. Revenue is attributed to a country or<br />
region based on <strong>the</strong> location of <strong>the</strong> <strong>Group</strong> company reporting <strong>the</strong> revenue. Inter-segment sales are charged at arm’s length prices.<br />
Segment Intra-region Regional Inter-region <strong>Group</strong><br />
revenue revenue revenue revenue revenue EBITDA 1<br />
£m £m £m £m £m £m<br />
<strong>31</strong> <strong>March</strong> <strong>2012</strong><br />
Germany 8,233 (44) 8,189 (1) 8,188 2,965<br />
Italy 5,658 (28) 5,630 (1) 5,629 2,514<br />
Spain 4,763 (54) 4,709 (3) 4,706 1,193<br />
UK 5,397 (37) 5,360 (6) 5,354 1,294<br />
O<strong>the</strong>r Europe 8,352 (59) 8,293 (5) 8,288 2,479<br />
Europe 32,403 (222) 32,181 (16) 32,165 10,445<br />
India 4,265 – 4,265 (6) 4,259 1,122<br />
Vodacom 5,638 – 5,638 (8) 5,630 1,930<br />
O<strong>the</strong>r Africa, Middle East and Asia Pacific 3,965 – 3,965 (23) 3,942 1,063<br />
Africa, Middle East and Asia Pacific 13,868 – 13,868 (37) 13,8<strong>31</strong> 4,115<br />
Non-Controlled Interests and Common Functions 423 – 423 (2) 421 (85)<br />
<strong>Group</strong> 46,694 (222) 46,472 (55) 46,417 14,475<br />
Verizon Wireless 2 20,187 7,689<br />
<strong>31</strong> <strong>March</strong> 2011<br />
Germany 7,900 (51) 7,849 (2) 7,847 2,952<br />
Italy 5,722 (<strong>31</strong>) 5,691 (3) 5,688 2,643<br />
Spain 5,133 (62) 5,071 (2) 5,069 1,562<br />
UK 5,271 (50) 5,221 (7) 5,214 1,233<br />
O<strong>the</strong>r Europe 8,253 (70) 8,183 (3) 8,180 2,433<br />
Europe 32,279 (264) 32,015 (17) <strong>31</strong>,998 10,823<br />
India 3,855 (1) 3,854 (11) 3,843 985<br />
Vodacom 5,479 – 5,479 (8) 5,471 1,844<br />
O<strong>the</strong>r Africa, Middle East and Asia Pacific 3,971 – 3,971 (27) 3,944 1,170<br />
Africa, Middle East and Asia Pacific 13,305 (1) 13,304 (46) 13,258 3,999<br />
Non-Controlled Interests and Common Functions 659 – 659 (<strong>31</strong>) 628 (152)<br />
<strong>Group</strong> 46,243 (265) 45,978 (94) 45,884 14,670<br />
Verizon Wireless 2 18,711 7,<strong>31</strong>3<br />
<strong>31</strong> <strong>March</strong> 2010<br />
Germany 8,008 (41) 7,967 (8) 7,959 3,122<br />
Italy 6,027 (40) 5,987 (2) 5,985 2,843<br />
Spain 5,713 (81) 5,632 (2) 5,630 1,956<br />
UK 5,025 (47) 4,978 (10) 4,968 1,141<br />
O<strong>the</strong>r Europe 8,357 (88) 8,269 (5) 8,264 2,582<br />
Europe 33,130 (297) 32,833 (27) 32,806 11,644<br />
India 3,114 (1) 3,113 (20) 3,093 807<br />
Vodacom 4,450 – 4,450 (7) 4,443 1,528<br />
O<strong>the</strong>r Africa, Middle East and Asia Pacific 3,526 – 3,526 (30) 3,496 977<br />
Africa, Middle East and Asia Pacific 11,090 (1) 11,089 (57) 11,032 3,<strong>31</strong>2<br />
Non-Controlled Interests and Common Functions 667 – 667 (33) 634 (221)<br />
<strong>Group</strong> 44,887 (298) 44,589 (117) 44,472 14,735<br />
Verizon Wireless 2 17,222 6,689<br />
Notes:<br />
1 The <strong>Group</strong>’s measure of segment profit, EBITDA, excludes <strong>the</strong> <strong>Group</strong>’s share of results in associates. The <strong>Group</strong>’s share of results in associates, by segment, <strong>for</strong> <strong>the</strong> <strong>year</strong> <strong>ended</strong> <strong>31</strong> <strong>March</strong> <strong>2012</strong> is O<strong>the</strong>r Europe £3 million<br />
(2011: £nil; 2010 £nil), Vodacom £nil (2011: £nil; 2010: £(2) million), O<strong>the</strong>r Africa, Middle East and Asia Pacific £36 million (2011: £51 million; 2010: £56 million) and Non-Controlled Interests and Common Functions<br />
£4,924 million (2011: £5,008 million; 2010: £4,688 million).<br />
2 Values shown <strong>for</strong> Verizon Wireless, which is an associate, are not included in <strong>the</strong> calculation of <strong>Group</strong> revenue or EBITDA.