Wind Turbine
Wind Turbine
Wind Turbine

You also want an ePaper? Increase the reach of your titles
YUMPU automatically turns print PDFs into web optimized ePapers that Google loves.
Automotive<br />
For the Driver Who Has Everything<br />
HVAC<br />
Improving the Air for Arias<br />
Power Generation<br />
The Power of SOFC Fuel Cells<br />
Sports<br />
The Winning Edge<br />
VOL XI ISSUE I • SPRING 2002<br />
APPLIED COMPUTATIONAL FLUID DYNAMICS<br />
In the<br />
Wake<br />
of a<br />
<strong>Wind</strong><br />
<strong>Turbine</strong><br />
Materials Processing<br />
Supplement Inside!
Contents<br />
16<br />
S2<br />
feature stories<br />
30<br />
5<br />
wind energy<br />
In the Wake of a <strong>Wind</strong> <strong>Turbine</strong><br />
<strong>Wind</strong> <strong>Turbine</strong> Blade Aerodynamics<br />
Mapping a <strong>Wind</strong> Farm<br />
36 computing<br />
FLUENT Users Capitalize on Parallel Processing<br />
Linux Clusters: Inexpensive Power for High-End<br />
CFD Computations<br />
The Impact of the Web on the Engineering<br />
Simulation Process<br />
20<br />
applications<br />
9 environmental<br />
UK Water Seminar on Tap<br />
21<br />
electronics cooling<br />
Thermal Modeling of a Multi-Unit Charger<br />
for Li-ion Batteries<br />
10 chemical<br />
Improving Sparger Performance<br />
Static Mixers by Design<br />
13 aerospace<br />
Fatal Concorde Fire Explained<br />
Unsteady Flow Behind a High<br />
Speed Train<br />
16 sports<br />
The Winning Edge<br />
19 appliances<br />
Frost-Free Chilling<br />
Thermal Mapping of a Hermetic<br />
Compressor<br />
23 hvac<br />
Smoke Management at Frankfurt Airport<br />
Improving the Air for Arias<br />
28 automotive<br />
Customized Phosphate Dip Tanks for Cars<br />
Arrows Formula 1 Team Moving Up the Grid<br />
For the Driver Who Has Everything<br />
32<br />
power generation<br />
The Power of SOFC Fuel Cells<br />
Flameless Burner Validation
materials<br />
processing<br />
supplement<br />
S2<br />
business case<br />
Meeting the Wide-Ranging CFD<br />
Needs of Materials Processing<br />
S3<br />
S3 glass<br />
Reverse-Engineering a Gob<br />
of Glass<br />
Ensuring Successful Delivery of<br />
Molten Glass with CFD<br />
S4 plastics<br />
Design Calculator Takes the<br />
Guesswork Out of Headlight<br />
Engineering<br />
Preventing Punctures in Sterile<br />
Packaging<br />
S6 semiconductor<br />
Optimizing Photo-Resist Film<br />
Uniformity<br />
Sharp Labs Uses FIDAP to<br />
Accelerate Promising Flat Panel<br />
Display Research<br />
Optimization of Vapor Purging<br />
in Wafer Isolation Pods<br />
S8 metallurgy<br />
Steel Industry Applications at<br />
ARCELOR<br />
38<br />
42<br />
departments<br />
34<br />
product news<br />
New Specialty Modules for FLUENT 6.0<br />
Fluent’s Ted Blacker Wins the Meshing Maestro Prize<br />
36 partnerships<br />
Cooperative Research on Fuel Cells<br />
Parameterized Model Building for Climate Control<br />
Aerosol/Hydrosol Modeling in FLUENT<br />
Flowmaster Group Announces FLUENTLink<br />
Turn-key Parallel Computing Solutions<br />
14<br />
40<br />
44<br />
44<br />
support corner<br />
Getting Started with Parallel Processing<br />
academic news<br />
Italian University Researcher Wins Prestigious Award<br />
around fluent<br />
Fluent Attends Launch of Ferrari Formula 1 Race Car
Editor’s Note<br />
1986 1993 1997<br />
On the Cover:<br />
Line contours of velocity<br />
magnitude behind a<br />
wind turbine<br />
FluentNews is published by<br />
10 Cavendish Court<br />
Lebanon, NH 03766 USA<br />
1-800-445-4454<br />
© 2002 Fluent Inc.<br />
All rights reserved.<br />
FLUENT, FIDAP, GAMBIT, POLYFLOW,<br />
G/Turbo, MixSim, FlowLab, Icepak,<br />
and Airpak are trademarks of Fluent<br />
Incorporated. All other products or<br />
name brands are trademarks of their<br />
respective holders.<br />
Along with<br />
the steady<br />
growth of<br />
our business during<br />
the past several<br />
years has been the<br />
steady growth of our<br />
corporate newsletter. Launched in April, 1986,<br />
Volume 1, Number 1 of the Fluent User’s Newsletter<br />
provided an update on the development of new<br />
physical models in FLUENT 2.9 (transient flow,<br />
pressure boundary conditions, and conjugate heat<br />
transfer, to name a few). It reported on the first<br />
annual Users’ Group Meeting, and highlighted<br />
the capabilities of a new product undergoing testing,<br />
FLUENT/BFC, our first to offer body-fitted<br />
coordinates. A Frequently Asked Questions section<br />
focused on issues such as convergence and<br />
setting turbulence boundary conditions. A twopage<br />
article on the solution of natural convection<br />
problems using FLUENT was also featured.<br />
Since then, the newsletter has tracked the steady<br />
evolution of simulations performed with our software:<br />
from simple 2D case studies to complex,<br />
industrially relevant analyses providing return on<br />
investment for our customers. The name Fluent<br />
Inc. Newsletter was introduced in 1993, and with<br />
it, a full color format. Articles typically dealt with<br />
modeling advances, validations performed inhouse,<br />
product updates for solver and pre-processing<br />
software, and application stories by our<br />
clients. The title Fluent News was adopted in the<br />
Spring 1997 issue, along with a new format that<br />
highlighted a CFD image on the front cover. During<br />
the next several years, Fluent News underwent<br />
occasional upgrades as the number and depth<br />
of the application stories steadily increased.<br />
With the current issue, we have once again<br />
undergone a design change to better accommodate<br />
the increased number and quality of application<br />
stories submitted by you, our customers.<br />
Seasoned readers of Fluent News will notice that<br />
several stories have expanded to two or three<br />
pages to allow room for more technical details;<br />
stories about the Frankfurt Airport and the UK<br />
Sports Institute are examples. Sections with stories<br />
on related topics have been added; wind energy<br />
and computing are featured in this issue.<br />
Application stories continue to abound, with examples<br />
ranging from air flow inside the Budapest<br />
Opera House to automotive paint spraying systems.<br />
The supplement focuses on the breadth<br />
of applications found in the materials processing<br />
industry, with contributions from glass, semiconductor,<br />
steel, and plastics manufacturers.<br />
The changes we have implemented in this<br />
issue of Fluent News are the result of our gradually<br />
changing focus over the past sixteen years<br />
– from a newsletter in which we tell you about<br />
how our software works, to a magazine in which<br />
our customers tell each other about how our software<br />
works for them. We hope that you can benefit<br />
from the information contained in the pages<br />
that follow, and that you will let us know about<br />
your own experiences with our software. Please<br />
contact us at fluentnews@fluent.com with<br />
your comments, suggestions, and stories of your<br />
successes. ■<br />
Best regards,<br />
Liz Marshall, Editor
wind energy<br />
In the Wake of a<br />
<strong>Wind</strong> <strong>Turbine</strong><br />
by Thomas Hahm and Jürgen Kröning, TÜV Nord e.V., Hamburg, Germany<br />
Many companies throughout<br />
the world have been<br />
applying their skills and<br />
expertise to the development of<br />
renewable energy sources. The<br />
number of companies involved in the<br />
production of clean and sustainable<br />
energy will undoubtedly increase in<br />
the near future due in part to a commitment<br />
to the Kyoto Protocol<br />
(1997), which calls for sweeping reductions<br />
in man-made green-house gas<br />
emissions, and in part to an increased<br />
awareness of the environment.<br />
One of the most abundant<br />
sources of renewable energy is<br />
wind, and technology exists today<br />
for the efficient extraction of energy<br />
from wind for power generation.<br />
The efficiency of wind power is tied<br />
to a number of factors, one of which<br />
is the positioning of wind turbines<br />
near other wind turbines or structures.<br />
Decreased distances give rise to wake<br />
effects for the downstream units, which<br />
can lead to changeable wind loads,<br />
reduced energy yield, and vibration<br />
induced fatigue on the rotors and<br />
potentially on nearby power lines.<br />
One popular operation concept<br />
for wind turbines allows for adjustments<br />
in the blade pitch to deliver<br />
a reasonably constant power output<br />
when there are variations in the wind<br />
speed. The wake behind these socalled<br />
“pitch-regulated” wind turbines<br />
depends on a number of parameters,<br />
such as blade geometry, pitch<br />
angle, and rotor speed on the hardware<br />
side and wind velocity, turbulence<br />
characteristics, and wind<br />
gradients on the environmental<br />
side. The large number of governing<br />
parameters makes it difficult to<br />
judge whether wake influences will<br />
lead to loads not considered during<br />
the original construction process.<br />
In a recent series of simulations at<br />
TÜV Nord e.V., FLUENT has been used<br />
to examine the wakes behind wind<br />
turbines of this type on the basis<br />
of their geometry and operating<br />
characteristics.<br />
TÜV Nord e.V. is one of Germany’s<br />
Technical Inspection Agencies and<br />
has the goal of protecting humanity,<br />
the environment, and property<br />
against detrimental effects caused by<br />
technical installations and systems of<br />
every kind. To this end, it promotes<br />
the economic installation or manufacture<br />
and use of technical equipment,<br />
production, and operating<br />
facilities.<br />
In a typical simulation, approximately<br />
650 data points are used to<br />
create the geometry of a single rotor<br />
blade. A fine grid on the whole rotor<br />
surface is used to create a volume<br />
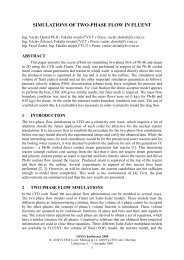
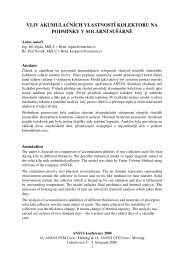
Velocity contours behind one turbine show the<br />
wake effect on a second, smaller turbine<br />
Fluent NEWS spring 2002 5
wind energy<br />
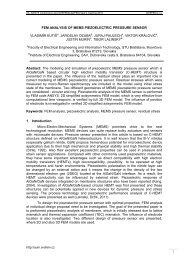
The geometry (front) and<br />
typical surface mesh (back)<br />
of a turbine rotor and hub<br />
Velocity magnitude slightly<br />
downstream of the rotor plane<br />
mesh of about 750,000 cells that gradually<br />
coarsens as the distance from<br />
the blades increases. The dimensions<br />
of the flow domain are adjusted to<br />
suit the needs of the specific problem.<br />
Downstream distances of six to<br />
ten times the rotor diameter have been<br />
modeled so far. The multiple reference<br />
frames (MRF) model is used to<br />
account for the rotation of the blades.<br />
Blade pitch, wind speed and direction,<br />
turbulence intensity and length<br />
scale, and rotor speed are input for<br />
each simulation.<br />
To validate the CFD model,<br />
wake measurements behind a 55 kW<br />
pitch-regulated turbine were taken<br />
from the literature [Ref. 1]. Despite<br />
some inconsistencies in the measured<br />
wind velocities, good agreement<br />
between the measurements and calculated<br />
values was obtained. In addition,<br />
calculations presented in<br />
Reference 1, based on a simpler model<br />
that did not use the blade geometry,<br />
were not able to predict flow details<br />
that were captured by the 3D<br />
FLUENT runs. In particular, the<br />
enhancement of wind velocity at the<br />
edges of the wake could only be predicted<br />
by the CFD calculations, even<br />
though the magnitude of the<br />
enhancement was larger than the<br />
measured value.<br />
Once the model was validated,<br />
it was used for several investigations<br />
of wake effects. On the previous page,<br />
one wind turbine is shown operating<br />
in the wake of a second, larger<br />
turbine. A wind velocity of 12.5 m/sec,<br />
with a turbulence intensity of 13%,<br />
was imposed upstream of the front<br />
turbine. Filled contours of constant<br />
mean velocity in the plane of the smaller<br />
turbine, four diameters behind the<br />
front turbine, show that the velocity<br />
field is nonuniform and not centered<br />
on the hub. Line contours in<br />
the plane containing the two turbines<br />
illustrate the decay in the wake as a<br />
function of distance behind the turbine.<br />
These results were used to help<br />
analyze the special wake loads<br />
experienced by the rear turbine.<br />
In another example, the excitation<br />
of vibrations in a power line was<br />
studied. <strong>Wind</strong> speeds in the range<br />
of 1 to 7 m/s and normal to the direction<br />
of the power line are most likely<br />
to cause these vibrations [Ref. 2].<br />
If there is a considerable shift in the<br />
wind speeds due to wake loadings<br />
on the power line, the installation of<br />
Velocity magnitude in the wake of a wind turbine<br />
6 Fluent NEWS spring 2002
vibration dampers on the power lines<br />
might be indicated. In the case studied,<br />
where the power line runs 25m<br />
above the ground, well below the<br />
turbine hub, the wake passes over<br />
the power line without causing any<br />
interference.<br />
Currently, there is little data<br />
available for the turbulence intensity<br />
in the vicinity of installed wind turbines,<br />
and this point requires further<br />
investigation. Today, different empirical<br />
models are used to predict turbulence<br />
intensity in the wake of wind<br />
turbines [Ref. 3, 4]. Since these models<br />
only predict single averaged values<br />
along the wake axis and differ<br />
from one another, they cannot be<br />
used to validate the CFD calculations.<br />
The distribution of turbulence intensity<br />
computed by FLUENT in the wake<br />
region is in reasonably good agreement<br />
with theory. Absolute values,<br />
however, fall well below measured<br />
turbulence intensities due to effects<br />
not captured in the current model<br />
(e.g. tip vortices and wake meandering).<br />
Nonetheless, the flexibility<br />
and increased rigor of the CFD calculations,<br />
when compared to the simpler<br />
models, suggests that this<br />
methodology can offer improved<br />
insight into the efficient production<br />
of wind energy in the years to come.<br />
In summary, given the rotor geometry<br />
and operating characteristics, CFD<br />
calculations are able to predict the<br />
wind velocities inside the wake of a<br />
wind turbine. Specific operating conditions,<br />
such as pitch angle and rotor<br />
speed, can easily be analyzed. Threedimensional<br />
simulations of wind turbines<br />
can also be extended to include<br />
landscape topography (see page 8)<br />
and other objects located in or near<br />
the wake. ■<br />
<strong>Wind</strong> <strong>Turbine</strong> Blade<br />
Aerodynamics<br />
by Frank Kelecy, Turbomachinery Application Specialist, Fluent Inc.<br />
wind energy<br />
Arecent project funded by the Department of Energy (DOE)<br />
and the National Renewable Energy Laboratory (NREL) involved<br />
the study of unsteady blade aerodynamics for large, threebladed<br />
wind turbines at the National <strong>Wind</strong> Technology Center (NWTC)<br />
in Colorado. The project was one component of a larger effort, funded<br />
by the International Energy Agency (IEA) R&D <strong>Wind</strong> Executive<br />
Committee, where field data was collected and analyzed for wind<br />
turbines operated by five organizations in four different countries.<br />
Because the incoming wind velocities were not, in general, normal<br />
to the plane of the rotors, the data collected from all of the<br />
sites is considered far more insightful than that taken from wind<br />
tunnel tests.<br />
At NWTC, a three-bladed, 10m diameter, 20kW Grumman wind<br />
turbine, operating at a constant speed of 72 rpm, was outfitted<br />
with 155 surface pressure taps on one of the rotor blades. The taps<br />
were used to collect data for incoming wind speed and angle, and<br />
for calculations of turbine power production, and aerodynamic and<br />
structural modes of the rotor.<br />
At Fluent, a simulation has been carried out for one of the NWTC<br />
cases, characterized by an inflow wind speed of 7 m/s, using the<br />
steady-state, moving reference frame (MRF) model in FLUENT 6.<br />
The geometry of the wind turbine was simplified for the calculation,<br />
and consisted of the main blade geometry specified for the<br />
NREL turbine (an S809 airfoil) along with an idealized cylindrical<br />
nacelle and spinner. The simpler nacelle geometry allowed a single<br />
blade to be analyzed due to the circumferential periodicity of<br />
the flow. An unstructured mesh was used, consisting of 478,664<br />
tetrahedral cells. The computed pressure distribution on the blades<br />
was used to determine the shaft power, from which the generator<br />
power could be derived using available powertrain efficiency<br />
data. The computed generator power and operating efficiency was<br />
found to be within 1% of test data from the reported power curve.<br />
Additional simulations will be performed in order to validate the<br />
present model over a range of wind speeds. These calculations will<br />
serve as a benchmark for others who may wish to pursue wind turbine<br />
modeling projects with FLUENT 6.<br />
Path lines through the turbine<br />
colored by velocity magnitude<br />
References<br />
1. Beyer, H.G. et. al.; Messungen von <strong>Wind</strong>geschwindigkeit und Turbulenz in der<br />
Nachlaufströmung eines 55 kW <strong>Wind</strong>energiekonverters mit variabler Drehzahl<br />
(Measurement of windspeed profiles and turbulence in the flow after a 55 kW wind energy<br />
converter with variable speed); DEWEK ’92, Deutsche <strong>Wind</strong>energie-Konferenz 1992;<br />
Wilhelmshaven 1993.<br />
2. Degener, T.; Kießling, F.; Tzschoppe, J.; Mindestabstand zwischen <strong>Wind</strong>energieanlagen<br />
und Freileitungen (Minimum distance between wind energy plants and overhead lines);<br />
Elektrizitätswirtschaft Jg. 98 (1999), No. 7, p. 32-35.<br />
3. Dekker, J.W.M.; Pierik, J.T.G. (Eds); European <strong>Wind</strong> <strong>Turbine</strong> Standards II; Petten, The<br />
Netherlands: ECN Solar & <strong>Wind</strong> Energy, 1998.<br />
4. Frandsen, St.; Thogersen, L.; Integrated Fatigue Loading for <strong>Wind</strong> <strong>Turbine</strong>s in <strong>Wind</strong><br />
Farms by Combining Ambient Turbulence and Wakes; <strong>Wind</strong> Engineering, Vol. 23,<br />
No. 6, 1999.<br />
Pressure contours<br />
on the surface of the<br />
Grumman 20 kW<br />
wind turbine<br />
Fluent NEWS spring 2002 7
wind energy<br />
Mapping a<br />
<strong>Wind</strong> Farm<br />
by Joseph K.W. Lam, Fluent Europe<br />
A typical wind map, and<br />
close-up showing the<br />
locations of the turbines<br />
Awind farm is a plot of land where a<br />
number of wind turbines operate concurrently.<br />
The power delivered by the<br />
wind to a turbine is proportional to the swept<br />
area of the rotor blades and the wind speed<br />
cubed. <strong>Wind</strong> turbines start to generate electricity<br />
at wind speeds of about 10 mph, and<br />
reach their maximum or rated power output<br />
at about 33 mph. Depending on the<br />
location, a wind farm will produce electricity<br />
for about 80-85% of the time, mostly at low<br />
wind speeds. The site of the farm, in particular<br />
the topology of the land at and surrounding<br />
the farm, can play a significant role<br />
in the efficiency of the collective energy output<br />
of the turbines.<br />
At Renewable Energy Systems in the UK,<br />
FLUENT has been used to predict the wind<br />
speeds for an existing wind farm at Coal<br />
Clough, Lancashire. There are 24 turbines<br />
at Coal Clough providing about 6,000 homes<br />
with their electricity needs. The analysis was<br />
done to generate a “wind map”, or high<br />
resolution contour map of wind speeds at<br />
a certain height above the ground. The best<br />
wind maps take into account the variations<br />
in the local terrain, including the topography<br />
of the land and the presence of nearby<br />
structures. A substantial amount of<br />
measured wind speed data was available,<br />
and was used for calibration of the CFD results.<br />
A well calibrated wind map can provide wind<br />
speeds at every location of the wind farm<br />
site. Accurate maps for the surface that slices<br />
through the turbine hub centers are essential<br />
for planning purposes, especially because<br />
of the strong dependence of wind speed<br />
on power.<br />
For the analysis, a rectangular footprint<br />
of land was considered that is oriented in<br />
the direction of the prevailing wind, with<br />
sufficient upstream and downstream distance<br />
from the existing core turbine region. Over<br />
160,000 points of terrain height data were<br />
used for a 20km wide strip of land, with a<br />
resolution of 50m horizontally and 1m vertically.<br />
A mesh of one million hexahedral cells<br />
was generated. The grid was progressively<br />
coarsened in the vertical direction, with the<br />
first cell layer approximately 0.05m off the<br />
ground and gradually increasing to 25m in<br />
height at the top boundary of the domain.<br />
The prevailing wind was found to have<br />
a height-dependent profile taken from<br />
anemometer measurements at the site of<br />
the turbines. The measured velocity profiles<br />
were applied at the upstream inlet to the<br />
domain through the use of a user-defined<br />
function. Because the terrain is hilly near the<br />
site of the turbines, the resulting CFD predictions<br />
for velocity at the turbine site were<br />
greater than the measured values by about<br />
50% in the initial runs. By calibrating the<br />
inlet profiles using the measured velocities<br />
at the turbine, the adjusted predictions at<br />
the turbines were brought to within 10%<br />
of the measured values. By repeating this<br />
process, using anemometer data from<br />
other nearby turbines and re-calibrating the<br />
inlet profiles, the wind speed map was developed<br />
into an accurate tool for predicting the<br />
flow field at all locations at the site. This project<br />
will allow the company to explore further<br />
the potential of CFD, to improve<br />
knowledge of wind conditions at existing<br />
and prospective sites. ■<br />
© Crown Copyright<br />
Land topography used as a<br />
boundary for the simulations<br />
8 Fluent NEWS spring 2002
environmental<br />
UK Water<br />
Seminar on Tap<br />
by Robert Harwood, Fluent Europe<br />
In December, Fluent Europe Ltd. held a seminar<br />
on CFD in the Water Industry. With the generous assistance<br />
of Anglian Water, the seminar took place at Grafham<br />
Water Treatment Works.<br />
Grafham Water is one of the largest man-made lakes<br />
in Europe. It contains nearly 13,000 million gallons (59<br />
million cubic meters), has a perimeter of 10 miles (16km),<br />
and at its deepest is 70 feet (21 meters). The site has<br />
been landscaped and considerable effort has been made<br />
to ensure that the public is able to enjoy the beauty and<br />
leisure opportunities of Grafham Water, while Anglian<br />
Water goes about the business of treating and delivering<br />
water to its customers. Grafham Water Treatment<br />
Works can deliver up to 360 million liters of water a day<br />
with an average daily supply of 230 million liters.<br />
The seminar opened with an introduction and welcome<br />
to Grafham and a general presentation on Fluent<br />
and CFD before the day’s proceedings got underway.<br />
Dr. Jim Wicks described some of the major CFD projects<br />
that had been undertaken by Anglian Water, and<br />
these included:<br />
• validation of CFD predictions against<br />
laboratory data for a service reservoir,<br />
• how £60,000 had been saved in pipework<br />
costs by using CFD in a service reservoir<br />
optimization study, and<br />
• how a 25% improvement in final<br />
water quality had been achieved by<br />
recommending a change in dosing<br />
location.<br />
Dr. Mike Faram then talked about how FLUENT was<br />
used at Hydro – a leading supplier of novel and innovative<br />
separation and flow control devices to the worldwide<br />
water industry. Their range of products includes<br />
the Hydrobrake ® Flow Control, Stormcell ® storage media,<br />
screening systems such as the Hydro-Jet screen, and a<br />
range of hydrodynamic separators such as the Gritking ®<br />
and Stormking ® .<br />
A novel design of combined sewer overflow (CSO)<br />
chamber, the StormFox, was introduced by Russ Currie<br />
of Johnston Pipes Ltd. The role of Fluent CFD software<br />
in fast tracking the design process was discussed.<br />
Following a demo of FLUENT 6.0, the delegates were<br />
taken on a tour of the works, providing a suitable end<br />
to a very enjoyable day. •<br />
Some of the delegates at the seminar after the tour<br />
around Grafham Water Treatment Works, with the<br />
anthracite, sand and garnet (ASG) filters in the<br />
background.<br />
Grafham Water (courtesy of Anglian<br />
Water)<br />
Fluent NEWS spring 2002 9
chemical<br />
The Lightnin A320 and other internals<br />
near the base of the vessel<br />
Improving<br />
Sparger<br />
PERFORMANCE<br />
by Dr. Sang Phil Han, LG Chemicals Ltd., Daejeon, Korea<br />
The dispersion of gases in liquids is a process that<br />
is used in the chemical, petrochemical, and pharmaceutical<br />
industries for fermentation and oxidation<br />
reactions, synthesis, and the manufacture of fine<br />
chemicals, for example. Stirred tanks, equipped with a<br />
gas delivering sparger near the base, are typically used<br />
for this purpose. If the gas flow rate is high, the behavior<br />
of the gas-liquid mixture differs considerably from<br />
that of the liquid alone. The power requirements are<br />
different as well. While the power required to drive a<br />
single or multiple impeller system is lowered in the presence<br />
of the gas, there is an additional power demand<br />
to operate the sparger. For optimal gas-liquid mixing,<br />
this device should deliver a uniform flow of gas through<br />
each of the many holes that cover its surface.<br />
One of the sparger systems used at LG Chemicals is<br />
a continuous stirred tank reactor, driven by two Lightnin<br />
agitators: an A310 near the top of the shaft and an A320<br />
near the base. The reactor has four baffles, a ring-type<br />
gas sparger positioned below the A320 with numerous<br />
side and bottom holes, side circulation inlets, and an<br />
outlet at the bottom with a vortex breaker and a degassing<br />
ring. Gas phase reactants are supplied through the sparger<br />
holes, and liquid phase products are extracted through<br />
the outlet. A portion of the product stream is recycled<br />
to the reactor through the side inlet.<br />
10 Fluent NEWS spring 2002
chemical<br />
The sparger assembly<br />
For a recent project, several simulations of the reactor<br />
were performed in an attempt to reduce the pressure<br />
difference through the sparger holes that had caused<br />
an overload problem on some of the compressors. In<br />
order to accomplish the goal without any loss in productivity,<br />
a decision was made to enlarge the sparger<br />
hole sizes. Changing the sparger hole sizes had to be<br />
carefully studied, however, because new problems might<br />
be introduced in the process. Using FLUENT, several aspects<br />
of the planned changes that would be critical to successfully<br />
achieving the goal were checked. First, the flow<br />
in the sparger itself was precisely investigated for various<br />
hole sizes. The results were used to assess the distribution<br />
of the gas flow rate per hole, and to test whether<br />
the pressure difference for the gas exiting through the<br />
holes was properly adjusted. Next, the liquid flow pattern<br />
in the reactor was calculated. These results were<br />
used to check for possible problems in the mixing patterns<br />
in the vessel. As a result of this effort, it was found<br />
that by modifying the agitator system, a better mixing<br />
pattern could be achieved. The revised liquid solution<br />
was then used as the basis for the gas sparging calculation,<br />
which was performed using the discrete phase<br />
model (DPM). This calculation was used to ensure that<br />
the hole size proposed in the first phase of the project<br />
would not lead to any unforeseen problems when the<br />
sparger was activated. During this phase of the project,<br />
the underlying assumptions for the DPM were validated,<br />
and the fundamental concepts for bubble formation<br />
by a gas emitted from a sparger hole in a liquid were<br />
investigated.<br />
As a result of the project work, the most appropriate<br />
hole sizes for the spargers was chosen that would<br />
satisfy the process goals while introducing no unexpected<br />
problems in reactor operation. The results also helped<br />
identify ways to modify other aspects of the agitating<br />
system so that better gas dispersion could be obtained.<br />
All of the ideas have since been applied in the field, and<br />
the reactor is now operating successfully. ■<br />
Path lines illustrate some of the bubble trajectories<br />
The gas flow<br />
in the sparger<br />
Fluent NEWS spring 2002 11
chemical<br />
SMX mixer geometry<br />
Static Mixers<br />
by Design<br />
by Shiping Liu, Andrew Hrymak, and Phil Wood,<br />
McMaster University, Hamilton, Ontario, Canada;<br />
and Rafiqul Khan, Fluent Inc.<br />
Static mixers consist of an array of<br />
similar, stationary mixing elements,<br />
placed one behind the other in a pipe<br />
or channel. Liquids are pumped through<br />
the channel, and the elements act to accelerate<br />
the homogenization of material properties,<br />
such as concentration, temperature,<br />
and velocity. In some types of static mixers,<br />
the elements are rotated by some angle<br />
(say, 90°) relative to the previous element.<br />
The SMX mixer is one example of this type<br />
of mixer. The elements are complex networks<br />
of angled guide blades, positioned<br />
at an angle to the pipe axis, and mixing<br />
occurs through the continuous redirecting,<br />
splitting, stretching, and diffusion of the<br />
fluids as they pass through the available<br />
openings.<br />
Since there are no moving parts<br />
involved, static mixing occurs with low shear,<br />
which is very important for some mixing<br />
processes where gentle treatment of the<br />
materials is required. Processes of this type<br />
are found in the food processing, pharmaceutical,<br />
and biotechnology industries.<br />
Static mixers are also widely used in a host<br />
of other industries, however, including oil<br />
and gas, chemical processing, polymer production<br />
and processing, and water and waste<br />
treatment. Some of the major manufacturers<br />
of static mixers are Sulzer Ltd., Koch-Glitsch<br />
Inc., and Chemineer Inc.<br />
Researchers from the Department of<br />
Chemical Engineering at McMaster University<br />
have been investigating the laminar mixing<br />
characteristics of an SMX static mixer<br />
using the discrete phase model (DPM) in<br />
FLUENT. Typically a series of SMX elements<br />
is used to ensure adequate mixing. The mixing<br />
quality increases with the number of<br />
mixing elements, but so does the power<br />
required to pump the fluids through the<br />
channel. For this reason, the number of mixing<br />
elements used in any given mixer is a<br />
function of the required product quality and<br />
operating budget.<br />
Mixing homogeneity is often rated using<br />
the coefficient of variation, or COV, which<br />
can be approximated using the fluid properties,<br />
operating parameters, and geometry<br />
of the mixing element. It can also be<br />
computed easily using CFD. Furthermore,<br />
CFD can be used to test the COV after the<br />
fluid has passed through different element<br />
designs, and to determine the minimum<br />
number of elements required to achieve the<br />
desired product quality. With CFD, these<br />
parameters can be established long before<br />
construction of an experimental apparatus<br />
begins, saving both time and money.<br />
Using FLUENT, COV values, pressure drop,<br />
and power requirements have been computed<br />
for a series of test cases using four<br />
SMX elements in a pipe. Qualitative<br />
results from the DPM calculations have clearly<br />
shown the expected stretching and layering<br />
of the fluid during the mixing process.<br />
Simulations using a two species model to<br />
track the mixing of epoxy resins have also<br />
been performed, and the results, particularly<br />
the species distribution on several axial<br />
planes, are in close agreement with experimental<br />
data provided by Sulzer for the SMX<br />
mixer. ■<br />
Using the DPM, the particle distribution through the mixer,<br />
using a central feeding of 20,000 tracers is shown<br />
Using the species mixing approach, concentration contours<br />
on the center plane are shown<br />
12 Fluent NEWS spring 2002
aerospace<br />
Afatal accident in July 2000 involving an Air France<br />
Concorde near the Charles De Gaulle Airport in<br />
Paris led to the temporary grounding of the entire<br />
fleet of these supersonic passenger planes. An investigation<br />
into the crash revealed that a metal strip had fallen<br />
off an aircraft previously departing from the<br />
runway. When the Concorde taxied over the shard, its<br />
tires burst, sending several pieces of rubber flying into<br />
the air. One piece struck the left wing fuel tank of the<br />
airplane, rupturing it. The leaking aviation fuel ignited<br />
near the left engine, causing a huge flame to erupt behind<br />
the aircraft. The altered aerodynamics made it impossible<br />
for the seasoned pilot to control the plane as it lifted<br />
off from the runway. Tragically, the Concorde crashed<br />
near the airport, killing all people on board and some<br />
on the ground.<br />
As part of the investigation to explain the accident,<br />
researchers at the University of Leeds were encouraged<br />
by John Tilston, QinetiQ, who worked on behalf of the<br />
Air Accident Investigation Board (AAIB), to look into the<br />
reason why the fire stabilized on the wing once it started.<br />
They used the VOF model in FLUENT to understand<br />
the flow characteristics of the leaking fuel that gave rise<br />
to the observed flame formation. A CFD model of the<br />
delta wing of the Concorde, minus the fuselage, was<br />
created. (The fuselage was judged to have little or no<br />
impact on the development of the leaking fuel jet.) Several<br />
simulations were performed using an estimated takeoff<br />
speed of 100m/s (224 mph) and a range of attack<br />
angles that matched amateur photos of the incident.<br />
In each model a steady stream of fuel was discharged<br />
into the CFD domain from a small hole on the underside<br />
of the aircraft wing. Both the k-ε and Spalart-Allmaras<br />
turbulence models were employed in the study, both<br />
of which led to similar results.<br />
The FLUENT predictions indicated that a very complex,<br />
recirculating flow structure developed under the<br />
wing as the aircraft lifted off, particularly inside the wheel<br />
bay. This result suggested that large recirculating air cells<br />
in the landing gear bay provided a suitably stable attachment<br />
point for the flame once it was ignited, probably<br />
by an electrical spark. The predicted fuel trajectory was<br />
mainly confined to a small area under the wing that closely<br />
matched the observed flame in the amateur footage<br />
of the crash. This was a qualitative verification of the<br />
conclusions drawn by the model. The CFD study, plus<br />
other recent studies on how to improve fuel tanks for<br />
the Concorde fleet, has led to modifications that should<br />
prevent a similar incident from happening in the future.<br />
The modified Concorde airliners were reintroduced to<br />
commercial service in October 2001, and the operational<br />
fleet is now fully functional. ■<br />
Fatal<br />
Concorde<br />
Fire Explained<br />
by L. Ma and M. Pourkashanian, Leeds University (CFD Center), Leeds,<br />
Yorkshire, UK, and J. Tilston, QinetiQ, Hampshire, UK<br />
GAMBIT Mesh for the delta wing simulation<br />
Predicted CFD cold fuel plume from ruptured<br />
left wing fuel tank during take off<br />
Fluent NEWS spring 2002 13
aerospace<br />
ICE 2 end car<br />
Unsteady Flow Behind a<br />
by Dr. Christoph Heine and Gerd Matschke, Deutsche Bahn AG, Munich, Germany<br />
Oil-flow path lines, colored by pressure, show<br />
the flow patterns on the end car surface<br />
Modern trains are lighter<br />
than those of past years.<br />
This is due in part to the<br />
replacement of a power car at the<br />
rear of the train with an unpowered<br />
driving trailer. This change has meant<br />
lower axle loads, reduced wear on<br />
ballast, and increased passenger<br />
capacity, since the end car can now<br />
be filled with seats.<br />
For a light-bodied driving trailer,<br />
the unsteady aerodynamic loads may<br />
become significant for the running<br />
behavior, and this effect has become<br />
a concern for a number of railway<br />
operators in Europe. In the BriteEuramfunded<br />
research project RAPIDE<br />
(Railway Aerodynamics of Passing and<br />
Interaction with Dynamic Effects), the<br />
partners have joined forces to investigate<br />
the boundary layer development<br />
along a modern high-speed train<br />
and the wake flow characteristics<br />
behind the end car using CFD.<br />
The CFD investigation was divided<br />
into three parts, corresponding<br />
to three sections of a moving<br />
train: the front car, the six mid-cars,<br />
and the trailing car. The boundary<br />
layer grows in thickness from the front<br />
to the trailing car, and when this thick<br />
boundary layer separates behind the<br />
trailing car, the points of separation<br />
on the train surface can periodically<br />
shift. This gives rise to aerodynamic<br />
oscillations about the longitudinal<br />
axis, which can cause discomfort<br />
to the passengers riding in the trailing<br />
car. The European organizations<br />
MIRA and SNCF performed boundary<br />
layer development calculations<br />
on the front and mid-car sections,<br />
respectively. Their results were then<br />
used by Deutsche Bahn to simulate<br />
the unsteady flow around and<br />
behind the German ICE 2 end car.<br />
The end section modeled was<br />
40m in length and positioned in a<br />
14 Fluent NEWS spring 2002
aerospace<br />
domain of length 60m, width<br />
20m, and height 15m. A volumetric<br />
mesh of tetrahedral and prismatic<br />
cells was used. The profiles along the<br />
sides and on top of the train generated<br />
by the other partners in the<br />
project were used as inlet boundary<br />
conditions. The ground under<br />
the train was given a uniform speed<br />
equal to that of the moving train.<br />
A steady-state simulation using<br />
the k-ε turbulence model was initially<br />
performed on multiple processors.<br />
The symmetric solution showed<br />
low pressure on the shoulder areas<br />
of the end car and a high pressure<br />
region on the back face that results<br />
from the onset of separation. A transient<br />
calculation was then initiated<br />
using the steady solution as a starting<br />
point. Using time steps of up to<br />
0.01s, unsteady flow developed with<br />
a period of oscillation on the order<br />
of 1 Hz. This frequency was found<br />
to be in good agreement with measurements<br />
reported by a Japanese railway<br />
company 1 . Further runs were<br />
done using smaller time steps and<br />
a higher order turbulence model<br />
(RSM), yielding identical oscillations<br />
in the flow. Based on the CFD results,<br />
the aerodynamic coefficients were<br />
calculated. These forces and moments<br />
served as an input for Multi Body<br />
Systems (MBS) calculations performed<br />
by Bombardier Transportation, and<br />
the running comfort was evaluated.<br />
Luckily, the oscillations were found<br />
to be far too weak to cause vehicle<br />
movements, so they would not cause<br />
any passenger discomfort. ■<br />
references<br />
1 Kohama, Y., Koshikawa, T. and<br />
Okude, Wake Characteristics of a High<br />
Speed Train in Relation to Tail Coach<br />
Oscillations, Vehicle Aerodynamics<br />
Conference, Loughbuough Univ.,<br />
UK, 1994. steady unsteady<br />
Comparison of surface pressure for the steady and unsteady cases<br />
High Speed Train<br />
Path lines and planes showing velocity magnitude contours behind the train<br />
Fluent NEWS spring 2002 15
sports<br />
The<br />
Dr. Richard Young at the UKSI<br />
competed in the sport of cycling<br />
at the 1988 and 1992 Olympics<br />
while completing a degree in<br />
biomechanics<br />
Winning<br />
Edge<br />
by Richard Young, Technology and Innovation Coordinator, UKSI,<br />
London, England<br />
Today, victory in sport is a matter<br />
of a fraction of a second or<br />
a few millimeters separating first<br />
and second place. Therefore any legal,<br />
cost-effective, and performanceenhancing<br />
technology has to be taken<br />
seriously, especially given the<br />
amount of money associated with<br />
winning. Whole new scientific disciplines<br />
like sports psychology,<br />
sports nutrition, and sports biomechanics<br />
have developed over the<br />
last 30 years, and have become part<br />
of the supporting framework behind<br />
elite sportsmen and women around<br />
the world. During the last five to ten<br />
years, rather late into the fray, sports<br />
engineers and technologists have also<br />
emerged, and their contributions to<br />
the engineering and technological<br />
aspects of sports equipment and athlete<br />
biomechanics have gained<br />
increasing acceptance. All of these<br />
disciplines have combined to help<br />
continually improve elite performance<br />
in sport.<br />
It has long been accepted that<br />
an understanding of fluid flow phenomena<br />
could lead to performance<br />
enhancements for certain competitive<br />
sports, especially those<br />
dominated by aerodynamics and<br />
hydrodynamics. Over the years,<br />
FLUENT has been used for a number<br />
of pioneering simulations of this<br />
type, such as motor racing, ski jumping,<br />
yachting, and sports ball modeling.<br />
Results have been used to<br />
optimize the balance between drag<br />
and downforce (motor racing), to<br />
illustrate why one posture is better<br />
than another (ski jumping), to<br />
perfect the design of a winged keel<br />
(yachting), and to better understand<br />
the impact of laces and geometric<br />
patterns on flight (sports balls).<br />
Performance enhancements that result<br />
from analyses like these will undoubtedly<br />
lead to the continued expansion<br />
of sports engineering in the years<br />
to come through the use of CFD.<br />
In the United Kingdom, the concept<br />
of a sports institute, dedicated<br />
to understanding and improving<br />
performance, was first discussed in<br />
1995. In October 2000, the idea<br />
became a reality as the United<br />
Kingdom Sports Institute (UKSI)<br />
opened in London. Sports institutes<br />
of this type are not new; many have<br />
been established around the world<br />
during the last ten years. All, and<br />
especially the Australian Institute of<br />
Sport, have helped contribute to<br />
notable sporting successes. These government-funded<br />
organizations,<br />
16 Fluent NEWS spring 2002<br />
Olympic cyclists in team pursuit formation<br />
Courtesy of the International Sports Engineering Association
sports<br />
which are primarily aimed at helping<br />
Olympic athletes, seek to provide<br />
elite competitors with the facilities<br />
and leading edge support necessary<br />
to help them excel at the pinnacle<br />
of their sport.<br />
It was with this ideal in mind that<br />
the UKSI has begun to investigate<br />
some of the fundamentals of flow<br />
applications in Olympic sports<br />
using FLUENT, with the hope of helping<br />
elite athletes on the British<br />
Olympic and Paralympic teams. To<br />
date, technological advances have<br />
played a major role in many<br />
Olympic sports, such as pole vaulting,<br />
cycling, and skiing, resulting in<br />
better equipment and refined techniques.<br />
Many of these advances have<br />
not been systematically studied, however,<br />
and some of the underlying<br />
engineering phenomena have never<br />
been fully understood. Through the<br />
use of CFD, many of these knowledge<br />
gaps can be filled. At the UKSI,<br />
this technology has been identified<br />
as having the potential to produce<br />
significant performance gains for elite<br />
athletes. Fluent’s software has been<br />
proven to be successful in other competitive<br />
sports and is head and shoulders<br />
better than other CFD codes<br />
for sports applications.<br />
crosswind effects<br />
on cyclists<br />
Cycling is one Olympic sport<br />
where CFD can help illuminate several<br />
flow phenomena. Applications<br />
for CFD in this sport are many, including<br />
cycle aerodynamic design,<br />
cyclist posture, helmet design, and<br />
optimal cyclist drafting positions during<br />
pursuit races. One area where<br />
cyclists do not agree, however, is on<br />
the selection of rear wheel type in<br />
a crosswind. While disk wheels<br />
become unmanageable for the<br />
front of a bicycle on windy days, the<br />
choice between disk and the traditional<br />
spoked wheels for the rear<br />
continues to undergo vigorous<br />
debate.<br />
It has been speculated that the<br />
rear disk wheel could act as a sail<br />
in certain circumstances, providing<br />
a forward force in the rolling direction<br />
opposite the drag force, and<br />
hence reducing the net drag experienced<br />
by the cyclist. Although many<br />
cyclists use rear disk wheels to try<br />
to capitalize on this lift, there has<br />
been little clear evidence to support<br />
its existence. An analysis of wheel<br />
performance would add to the growing<br />
body of knowledge that CFD has<br />
provided to date for cycling applications,<br />
much of which cannot be<br />
easily obtained from wind tunnel tests.<br />
In the CFD study carried out, simulations<br />
using FLUENT were applied<br />
to a generic geometrical representation<br />
of a cyclist and bike created<br />
in GAMBIT. All crosswinds were simulated<br />
as constant and steady at 90°<br />
to the direction of motion of the<br />
cyclist. Calculations were performed<br />
for a cyclist using a spoked front wheel<br />
at a forward speed of 25 mph, in<br />
crosswind speeds varying from still<br />
air to 30 mph, with spoked and disk<br />
rear wheels. Since the same CFD<br />
mesh was used for each simulation,<br />
it was felt that it should lead to the<br />
predicted trends being accurately<br />
resolved.<br />
In crosswinds, the cyclist experiences<br />
a drag force (opposing the<br />
direction of motion) and a side force.<br />
While the cyclist only has to work<br />
against the drag force, the CFD calculations<br />
showed an increase in the<br />
magnitude of the drag force for both<br />
types of rear wheels when a crosswind<br />
is present. The net drag force<br />
predicted by FLUENT as a function<br />
of wind speed shows that in still air,<br />
the advantage of using a rear disk<br />
wheel over a spoked wheel is negligible<br />
(about 2%). As the wind speed<br />
Fluent NEWS spring 2002 17
sports<br />
FlowLab 1.0 is<br />
Released!<br />
Virtual Fluids Laboratory<br />
for Engineering Education<br />
Flow path lines around a cyclist with a spoked<br />
rear wheel in a 20 mph crosswind (top) and a<br />
disk rear wheel (bottom)<br />
Bring the power of CFD<br />
to the classroom:<br />
•Reinforce fundamental<br />
concepts<br />
•Expand lab experiences –<br />
easily and economically<br />
•Stimulate interest in fluid<br />
mechanics<br />
•Expose students to essential<br />
job skills<br />
•Use pre-defined examples<br />
or customize your own<br />
increases, however, the advantage of<br />
the disk wheel improves dramatically<br />
owing to the “sail effect.” In a 20 mph<br />
cross wind, the net drag experienced<br />
by the cyclist is 17% lower with the disk<br />
wheel than with the spoked wheel, suggesting<br />
that the disk wheel gives an apparently<br />
overwhelming advantage.<br />
There are practical disadvantages to<br />
disk wheels though. For example, a disk<br />
wheel creates significantly larger side<br />
forces. In a 20 mph crosswind, the side<br />
force acting on the cyclist plus bicycle<br />
with a rear disk wheel is approximately<br />
double that for a cyclist using a spoked<br />
rear wheel. The trade-off for the cyclist<br />
is, therefore, one of stability, especially<br />
in a gusting wind. In reality, the situation<br />
is complicated further by<br />
variability of wind and rolling directions,<br />
and shielding by surrounding objects<br />
(including, in stage races, the other<br />
cyclists). The message from the simulations<br />
is clear, however. The cyclist can<br />
move moderately to significantly faster<br />
for the same power output, using the<br />
rear disk wheel rather than a spoked<br />
wheel, confirming the empirical observations<br />
experienced by many top-notch<br />
cyclists. ■<br />
more.info@<br />
flowlab.fluent.com<br />
flowlab@fluent.com<br />
Graph of relative drag difference between a cyclist using a rear wheel with and<br />
without a disk in a range of crosswinds<br />
18 Fluent NEWS spring 2002
appliances<br />
Frost-Free<br />
Chilling<br />
by Graham Sands and Weizhong Xiang, General Domestic Appliances, Peterborough, Cambridgeshire, England<br />
Mesh scheme of the freezer<br />
General Domestic Appliances (GDA) Ltd. is the largest manufacturer<br />
of domestic appliances in the UK, with products<br />
that include refrigerators, stoves, washing machines, clothes<br />
dryers, dishwashers, and more. GDA began using FLUENT in April<br />
2001. The first of their projects to make extensive use of CFD was<br />
the development of a new line of frost-free refrigeration appliances.<br />
One of the main goals of the project was to design the refrigerators<br />
with improved energy performance, to cut operating costs. To<br />
reduce the energy demands of the units, two aspects of the airflow<br />
inside the refrigerators had to be optimized. First, the maximum air<br />
flow rate had to be generated using the smallest possible fan. This<br />
would not only improve the efficiency, but would also make the unit<br />
run more quietly. Second, the fan(s) and other internals needed to<br />
be positioned in such a way that the airflow inside both the refrigerator<br />
and freezer units was distributed in the most efficient way.<br />
Test rigs were constructed so that measurements could be made in<br />
parallel with the CFD simulations. The role of these rigs was to validate<br />
the results of the CFD simulations and carry out the airflow<br />
optimization phase of the project.<br />
The largest freezer studied in this project was 1.8 meters high<br />
and had 9 baskets. Because the geometry of the freezer is very complicated,<br />
with small gaps between the food packs and baskets, a tetrahedral<br />
mesh was used. The results for pressure distribution indicated<br />
that the largest pressure losses were occurring below and behind<br />
the bottom basket. This result was validated by measurements on<br />
the test rig. After increasing the clearance between the baskets and<br />
inside walls, the simulation was repeated, and the total airflow rate<br />
of the freezer was found to increase considerably.<br />
The model was also used to study the pack temperature distribution<br />
in the freezer. A steady-state simulation was performed for a<br />
case where the compressor was running 100% of the time, and a<br />
transient simulation was performed when the compressor was cycling<br />
on and off. The results for the steady-state case (top right) suggested<br />
that the top and bottom basket have the warmest pack temperature<br />
if the air is uniformly distributed in the freezer. When the compressor<br />
runs intermittently, however, the top basket has the warmest<br />
pack temperature. In order to reduce the pack temperature near the<br />
top and bottom baskets, the simulations showed that more air should<br />
be introduced to these regions.<br />
At GDA, FLUENT has been proven to be a useful tool to assist<br />
the development of frost-free refrigerators. It has been used successfully<br />
to identify problems before any prototype models were built. Models<br />
of other appliances have since been developed and these models<br />
have provided further useful information for design decision making,<br />
and have assisted in the product development process. ■<br />
Pack temperature distribution<br />
in the freezer<br />
Pressure distribution in the freezer<br />
Fluent NEWS spring 2002 19
appliances<br />
Thermal<br />
Mapping of<br />
a Hermetic<br />
Compressor<br />
Temperature distribution on the internal<br />
pump assembly<br />
by Rahul Chikurde and S. Manivasagam, Kirloskar Copeland Ltd., Karad, India<br />
The complex fluid flow and heat transfer<br />
phenomena in hermetic compressors are<br />
very difficult to analyze theoretically. Because<br />
there is insufficient understanding of the physics<br />
involved, assumptions are often made in order<br />
to solve these problems analytically, and these<br />
assumptions can have a negative impact on<br />
the quality of the results. To cope with today’s<br />
high-energy efficiency standards, there is a need<br />
to overcome these limitations, so that the flow<br />
and heat transfer inside the compressor can<br />
be better understood.<br />
At Kirloskar Copeland in Karad, India, CFD<br />
has been used to perform a more rigorous analysis<br />
of the entire compressor domain, including<br />
the suction and discharge gas paths. The<br />
ability of the FLUENT code to deal with conjugate<br />
heat transfer (conduction and convection)<br />
in a turbulent flow encouraged engineers to<br />
perform a flow and thermal analysis for the<br />
entire compressor. The effort has helped predict<br />
such important characteristics as motor<br />
winding temperature, and velocity and pressure<br />
fields across the domain. The powerful<br />
visualization tools have made it easy to see the<br />
overall flow patterns along the gas flow paths.<br />
The thermal performance of the compressor<br />
plays an important role in the optimal working<br />
of the appliance in which it is fitted. Hence,<br />
it is necessary to carefully simulate the heat<br />
transfer inside the compressor, since it governs<br />
the energy efficiency of the whole system.<br />
The most important contributors to the<br />
thermal performance are the suction gas superheating,<br />
which is mainly due to heat sources<br />
20 Fluent NEWS spring 2002<br />
related to the copper and iron (or core) losses<br />
and the heat of compression, and volumetric<br />
and energy losses occurring in the suction and<br />
discharge gas paths. Other heat sources inside<br />
the compressor are due to rotor and frictional<br />
losses. Each of these effects is represented by<br />
a volumetric heat source in the FLUENT model.<br />
To date, the CFD analysis has provided predictions<br />
for the temperatures on numerous<br />
components inside the compressor. This information<br />
has been used to help design more<br />
efficient motors (with better cooling) and select<br />
the appropriate Internal Overload Protector<br />
(OLP), which protects the motor from overheating<br />
under adverse conditions.<br />
The results of the numerical simulation have<br />
been validated using an experimental set-up<br />
that uses conventional thermocouples to perform<br />
thermal mapping of the compressor. The<br />
numerical solution has been found to agree<br />
well with the experimental results. Because<br />
the simulation resembles the actual testing of<br />
the compressor on the calorimeter test rig under<br />
specified conditions, the compressor behavior<br />
can be visualized and thoroughly understood<br />
well before the prototypes are built and<br />
tested. If need be, the compressor design can<br />
be altered to obtain the target performance.<br />
The success of the validation work has given<br />
Kirloskar Copeland engineers the necessary confidence<br />
to use CFD during the product development<br />
stage for new equipment, thereby<br />
reducing the number of prototypes for trial<br />
and error, and the total design cycle time by<br />
almost 30%. ■<br />
Path lines illustrate the flow through<br />
the compressor<br />
Temperature distribution on a vertical plane<br />
through the crankshaft axis
electronics cooling<br />
Thermal Modeling<br />
of a Multi-Unit Charger<br />
for Li-ion Batteries<br />
by Hossein Maleki, John Johnson and Kevin Kitts, Motorola Energy System Group (ESG), Lawrenceville, GA<br />
Demands for small and high power sources<br />
to operate portable electronics and their<br />
associated accessories are continuing<br />
to increase. Among these demands are<br />
increased power and reduced size for lithiumion<br />
(Li-ion) battery packs and their associated<br />
charging units. Li-ion batteries have<br />
become the power source of choice for portable<br />
electronics because of their high energy density,<br />
rate capability, and long cycle-life.<br />
However, they tend to self-heat during<br />
charge and discharge cycles, and lose capacity<br />
if exposed to or operated at temperatures<br />
greater than 65°C.<br />
To charge a Li-ion battery, a charger needs<br />
to apply a controlled current to increase the<br />
Li-ion cell voltage from about 3.0 V to no more<br />
than 4.2 V. Overcharging could lead to capacity<br />
fading and thermal stability issues. Multiunit<br />
chargers are more economical to operate<br />
than single-unit chargers, but they can run at<br />
higher temperatures, causing potential damage<br />
to the batteries and control electronics.<br />
Motorola Energy System Group (ESG), a<br />
leading provider of complete energy system<br />
solutions for portable electronics, such as cell<br />
phones and laptop computers, has used Icepak<br />
to address thermal management issues related<br />
to a multi-unit charger for Li-ion batteries.<br />
This effort has allowed engineers to simulate<br />
the product’s thermal response for a given set<br />
of customer specifications, and confirm or make<br />
changes to the design before a new product<br />
is built.<br />
Using Icepak, an eight-unit charger with<br />
maximum natural convection cooling was simulated.<br />
Early design validations demonstrated<br />
that Icepak predictions of temperature at<br />
several sites on the charger were in good agreement<br />
with measured data (see table at right).<br />
Through subsequent modeling, it was determined<br />
early in the design phase that the cus-<br />
The internal peak temperature rise of the charger when fuel gauging (calibrating) eight batteries<br />
simultaneously is shown. The temperature of the load resistors (location 2) rises to ~88°C. Modeling also<br />
showed that the heat that evolves mainly from the load resistors causes the temperature of the back of the<br />
aluminum (Al) base (location 4) to rise above the critical limit (55°C), set by UL for metallic parts that<br />
could be touched by the end users.<br />
Temperature (°C)<br />
8-Batteries Discharge<br />
Location /Part Experiment Modeling<br />
1 Power Supply 54 52-56<br />
2 Load Resistors 92 88<br />
3 Logic ICs 56 54<br />
4 Chassis Back Exterior (AL, 3mm) 58 58-69<br />
5 Cell Pocket Bottom Interior (PC/ABS) 44 45<br />
6 Back Housing Over the Vent 47 45-51<br />
7 Chassis Exterior Bottom (Al) 51 55<br />
8 Chassis Exterior (Al) Under Load Resistors 80 78-81<br />
The table above compares Icepak predictions to experimental data obtained while<br />
the unit calibrated eight batteries simultaneously<br />
Fluent NEWS spring 2002 21
electronics cooling<br />
Fin cooling (top) and fan cooling (bottom) show the temperature distribution on<br />
the outside surface of the charger. In both cases, the simulation was conducted<br />
with four batteries being charged and four batteries being discharged. Both<br />
configurations caused the charger to exceed the allowed upper temperature limit<br />
(55°C).<br />
tomer’s time-frame requirement for charging<br />
or calibrating (discharging a fully charged cell<br />
for capacity check) all eight batteries simultaneously<br />
was not possible. The charge step caused<br />
the temperature of the power supply to rise<br />
above its optimum operating temperature.<br />
Calibrating affected heat dissipation from the<br />
Li-ion cells and their associated load resistors.<br />
Icepak was also used to evaluate the effects<br />
of fan cooling versus fin cooling on the operating<br />
temperature of the unit while simultaneously<br />
discharging four batteries and<br />
charging four batteries. Results showed that<br />
the addition of a fan, meeting cost and design<br />
limitations, provides 15-17% more cooling to<br />
some parts of the charger.<br />
After a number of modifications were tested,<br />
a final design was chosen. The series of<br />
simulations showed that the eight-unit charger,<br />
meeting customer design requirements,<br />
is capable of calibrating only three batteries,<br />
while charging five at the same time. This optimized<br />
solution, which includes detailed<br />
operating temperature information for all charger<br />
components, could not have been obtained<br />
without the combined strengths of the ESG<br />
engineering staff and Icepak software. The simulations<br />
demonstrated not only the limitations<br />
of the existing design, but also alternative solutions<br />
to improve the thermal performance of<br />
a multi-unit charger. At Motorola ESG, CFD<br />
modeling with Icepak has proved to be a costeffective<br />
tool for predicting the thermal response<br />
of electronic power sources. ■<br />
This charger has fins placed on the<br />
backside of the printed circuit board<br />
(PCB) beneath the load resistors.<br />
Additional modifications in this model<br />
included increasing the height of the<br />
back-wall of the Al-base, and thermal<br />
isolation of the back end of the PCB<br />
from the Al-base. These changes led<br />
to better cooling of the Al-base,<br />
maintaining a temperature below<br />
55°C.<br />
22 Fluent NEWS spring 2002
FOCUS on CFD<br />
For Materials Processing<br />
Newsletter Supplement<br />
S2<br />
business case<br />
Meeting the Wide-Ranging CFD<br />
Needs of Materials Processing<br />
S3 glass<br />
Reverse-Engineering a Gob<br />
of Glass<br />
Ensuring Successful Delivery of<br />
Molten Glass with CFD<br />
materials processing<br />
S4 plastics<br />
Design Calculator Takes the<br />
Guesswork Out of Headlight<br />
Engineering<br />
Preventing Punctures in Sterile<br />
Packaging<br />
S6 semiconductor<br />
Optimizing Photo-Resist Film<br />
Uniformity<br />
Sharp Labs Uses FIDAP to<br />
Accelerate Promising Flat<br />
Panel Display Research<br />
Optimization of Vapor Purging<br />
in Wafer Isolation Pods<br />
S8 metallurgy<br />
Steel Industry Applications at<br />
ARCELOR<br />
CFD:<br />
Showerhead in a 300 mm<br />
thermal CVD reactor<br />
Courtesy of Novellus Systems, Inc.<br />
In background:<br />
Concept Two Dual ALTUS<br />
tungsten process chamber<br />
Courtesy of Novellus Systems, Inc.
usiness case<br />
materials processing<br />
Meeting the Wide-<br />
Ranging CFD Needs of<br />
Materials<br />
Processing<br />
by Eric Grald, Materials Industry Director, Fluent Inc.<br />
The term “materials processing” conjures up<br />
an amazingly wide range of applications and<br />
industries, including (but certainly not limited<br />
to) semiconductor manufacturing, glass, polymers,<br />
non-woven materials, consumer products,<br />
food, and metals. The analysis needs of these<br />
industries are similarly broad, not to mention complex:<br />
chemical reactions, plasma physics, multiphase<br />
flow, radiation, phase change, generalized<br />
non-Newtonian rheology, free surfaces, fluid-structure<br />
interaction, porous media, and many more.<br />
Fluent is able to meet these diverse needs<br />
through a trio of industry-leading products: FLU-<br />
ENT, FIDAP, and POLYFLOW. By drawing on the<br />
unique strengths of these programs, customers<br />
are able to realize the true potential of CFD by:<br />
• reducing the time and expense of<br />
developing new products,<br />
• troubleshooting existing products<br />
and processes,<br />
• decreasing the number of<br />
prototypes needed,<br />
• gaining invaluable physical insight<br />
into their problems.<br />
These benefits have become reality because<br />
of the tremendous advances in CFD in recent<br />
years, many pioneered by Fluent. One of the main<br />
goals is to improve productivity by reducing the<br />
time required to create the CFD model and obtain<br />
the solution. The direct import of CAD models,<br />
extensive use of unstructured meshes, and automated<br />
meshing techniques have greatly reduced<br />
the time required for preprocessing. To further<br />
reduce the turnaround time, more and more users<br />
are taking advantage of parallel processing capabilities<br />
with multi-processor computers and networks<br />
of workstations. To extend the capabilities<br />
of the software, many users have taken advantage<br />
of user-defined subroutines and functions.<br />
Specialty modules are available to simulate continuous<br />
fiber manufacturing, magnetohydrodynamics<br />
(MHD), and glass batch melting, electrical<br />
boosting, and bubbling (see Product News on<br />
page 34).<br />
Another way that leading edge physical models<br />
are incorporated into Fluent’s products is through<br />
partnerships with technology leaders. In a partnership<br />
with Kinema Research and Software,<br />
FLUENT has been linked with the plasma simulation<br />
program PLASMATOR ® to address plasma-enhanced<br />
chemical vapor deposition,<br />
dielectric and metal etching, ion implantation,<br />
and reactor cleaning (see Addressing Plasma<br />
Processing, Fluent News, Fall 2000). The resulting<br />
3D simulations are fast enough to allow design<br />
iterations in an industrial time frame. The Fine<br />
Particle Model, developed by Chimera Technologies,<br />
allows the simulation of aerosol and hydrosol<br />
formation, growth/shrinkage, transport and deposition<br />
(see Partnerships on page 42). The integration<br />
of CFD with flowsheet models is being<br />
accomplished by a partnership between Fluent,<br />
AspenTech, ALSTOM Power, Intergraph, and West<br />
Virginia University in the Vision21 project funded<br />
by the U.S. Department of Energy (see Vision<br />
Above, melt blown die for non-wovens<br />
manufacturing: instantaneous flow field (velocity<br />
vectors) reveals large scale eddy structure<br />
Below left, temperature differential in a crutcher<br />
used for detergent manufacturing<br />
21 Update, Fluent News, Fall 2001). By incorporating<br />
a detailed CFD model (such as a stirred<br />
tank reactor) into the flowsheet model of the<br />
entire system, engineers can be certain that fluid<br />
flow details are accurately accounted for as the<br />
process is designed and optimized.<br />
The examples in this supplement provide a<br />
sample of the different ways customers have applied<br />
Fluent software to solve their real-world problems.<br />
We hope it will offer an appreciation for<br />
the diverse world of applications known as “materials<br />
processing.” The future holds many more<br />
challenges in this area, and Fluent is working hard<br />
to expand the scope and capability of CFD to<br />
meet these challenges. ■<br />
S2 Fluent NEWS spring 2002
glass<br />
Reverse-Engineering<br />
a Gob of Glass<br />
by Matthew R. Hyre, Virginia Military Institute, Lexington, VA<br />
Gob formation<br />
at the feeder<br />
Industrial glass container forming is a complex sequence<br />
of unit processes that leads up to the actual forming process<br />
in an individual section machine. The forming process can<br />
be roughly divided into several steps that begin with the<br />
formation of a glass gob at the feeder, followed by the transfer<br />
and loading of the gob into a blank mold. The shape of<br />
the glass gob and its orientation before it falls are important<br />
components of the manufacturing process of many glass<br />
products. Large deviations from the ideal gob shape and<br />
trajectory can have severe consequences on the penetration<br />
of the glass into the transfer equipment and molds, and<br />
asymmetric loading of the gob into the blank molds can<br />
cause uneven temperature and wear patterns on the mold<br />
interiors. Traditionally, gob shape control has been conducted<br />
by trial and error based on past experience and operator<br />
knowledge, but recent advances in numerical techniques<br />
and computer capabilities have made the numerical modeling<br />
of the gob forming processes feasible.<br />
A numerical study was performed recently using<br />
POLYFLOW to investigate the importance of the initial gob<br />
formation and transfer on the formation of glass bottles. The<br />
simulation modeled the formation of the gob at the feeder,<br />
and the transfer of the gob to the blank mold. Techniques<br />
such as thermo-mechanical coupling, mesh-to-mesh interpolation,<br />
and mesh superposition of the plungers on the<br />
glass were employed. Remeshing techniques were used that<br />
allowed a continuation of the calculations despite very severe<br />
mesh deformations. By evaluating the extent to which feeder<br />
plunger motion and gob transfer equipment affect gob<br />
shape and weight, a systematic methodology to control these<br />
parameters can be developed. ■<br />
Ensuring Successful Delivery<br />
of Molten Glass with CFD<br />
by Christopher Jian, Owens Corning, Granville, OH<br />
As the world’s leading glass fiber and materials manufacturer, Owens Corning<br />
is committed to delivering products of the highest quality to its customers.<br />
One of the critical processes in the manufacture of continuous strand glass<br />
fiber is the front-end glass delivery system. The front-end system consists of various<br />
covered channels and forehearths made of refractory materials. Channels are<br />
used to deliver glass from the melter to a network of product-forming stations,<br />
and to provide a means of thermally conditioning the glass to the required temperatures<br />
by applying cooling or heating along the way. Forehearths are used to<br />
distribute glass to each forming station while maintaining glass temperatures dictated<br />
by the forming products. It is crucial that the front-end system delivers glass<br />
of the highest quality to the forming operations, both chemically and thermally,<br />
to insure that the products meet customers’ highest quality standards.<br />
In order to meet the stringent requirements of fiber forming operations, significant<br />
effort has been devoted to the design, engineering, and operation of these<br />
front-end systems. Engineers at Owens Corning have successfully integrated CFD<br />
modeling in the overall process. Coupled with an in-house computer code,<br />
FLUENT is used for modeling both the combustion space and the glass flow. Extensive<br />
validation of the CFD model against field measurements has been performed, to<br />
ensure the accuracy and integrity of the simulation results. The CFD model has<br />
become an integral tool for improving the design and operation of front-end glass<br />
delivery systems. It is also being used to make engineering and business decisions<br />
that have resulted in significant capital and operating savings. Currently, this frontend<br />
CFD model is being integrated with Owens Corning’s forming technology model<br />
to maximize the potential of numerical simulation. ■<br />
103<br />
Temperature in a fiberglass front-end<br />
103<br />
materials processing<br />
Gob transfer<br />
to a blank<br />
mold<br />
normalized glass temperature<br />
102<br />
101<br />
100<br />
99<br />
98<br />
97<br />
FLUENT<br />
Measurement<br />
normalized glass temperature<br />
102<br />
101<br />
100<br />
99<br />
FLUENT<br />
Measurement<br />
96<br />
0.65<br />
98<br />
0.0<br />
0.75 0.85 0.95 1.05<br />
normalized glass depth<br />
0.2 0.4 0.6 0.8 1.0<br />
normalized glass depth<br />
Temperature validation in a channel<br />
Temperature validation in a forehearth<br />
Fluent NEWS spring 2002<br />
S3
plastics<br />
materials processing<br />
Design Calculator Takes<br />
the Guesswork Out of<br />
Headlight<br />
Engineering<br />
by Eric Jaarda, GE Plastics, Southfield, MI<br />
Material selection decisions are becoming<br />
increasingly critical in automotive<br />
lighting. The drive for product differentiation<br />
and unique styling has pushed the performance<br />
envelope of traditional materials. At<br />
the same time, the demands of the marketplace<br />
continue to reign in costs and design development<br />
time.<br />
GE Plastics, an engineering resin supplier, has<br />
used FLUENT software to deliver more precise<br />
material selection guidelines to their automotive<br />
customers by predicting the operating temperature<br />
of a given headlamp reflector design. According<br />
to David Bryce, GEP’s Technical Manager,<br />
Lighting, “By selecting the most appropriate material<br />
for each component, our customers can design<br />
for tooling and manufacturing needs that are<br />
specific to that material. Additionally, the lowest<br />
cost material meeting the thermal load requirements<br />
can be chosen, averting costs due to<br />
over-engineering of the design.” Design-specific<br />
heat transfer and fluid flow analysis captures the<br />
uniqueness of each lamp system.<br />
Development timelines are continually being<br />
shortened however, and the time required to model<br />
and analyze a complex system can sometimes<br />
extend the entire program timeline. “We are finding<br />
that many of our customers can only allow<br />
very little time in their design cycle for feasibility<br />
analysis,” says Jim Wilson, GEP’s Commercial<br />
Technology Manager, High Performance Polymers.<br />
A completed design must be immediately sent<br />
out for tooling prior to verification that the correct<br />
material selection was made. Iterative design<br />
changes are viewed as inefficiency in the<br />
process. A material choice is needed to optimize<br />
the design, yet the appropriate material cannot<br />
be selected until the design is ready for analysis<br />
and its thermal requirements determined. This<br />
conundrum has encouraged GEP to implement<br />
FLUENT in the design process in a new way.<br />
GEP wanted to put the ability to design in<br />
its customers’ hands, rather than dictate changes<br />
to suit material requirements after the design was<br />
finalized. To accomplish this, they developed a<br />
headlamp design calculator to assist their customers<br />
in making up-front material selections.<br />
Using FLUENT, GEP was able to examine a broad<br />
array of common lamp designs and focus on the<br />
design features that were most critical to material<br />
selection. The result was a design calculator,<br />
soon to be available to GEP’s customers on their<br />
An example of an automotive head lamp reflector<br />
web site www.geplastics.com. The calculator<br />
allows the customer to examine their allowable<br />
system space before they ever produce any design<br />
data. Instant temperature and material suggestions<br />
enable them to adjust or trade-off various<br />
elements of their design to achieve a more costeffective<br />
material specification. This is all prior<br />
to establishing a final geometry that can then<br />
be optimized for that material.<br />
A verification of correct material selection is,<br />
of course, needed when the design is finalized.<br />
At that point a design-specific CFD analysis can<br />
be performed, but the initial material suggestion<br />
from the calculator helps reduce post-design<br />
modifications and speed development. ■<br />
The automotive lighting design calculator<br />
S4 Fluent NEWS spring 2002
plastics<br />
The use of thin flexible films for the packaging of<br />
disposable sterile medical devices is a large and<br />
growing part of the medical packaging market.<br />
In most cases, the packaging format used for medical<br />
devices is a formed pack produced using a thin<br />
polymeric film sealed to a top web of paper, which<br />
permits the ingress of the sterilization gas but is resistant<br />
to bacterial penetration post sterilization. In addition,<br />
to keep the cost of the packaging to a minimum<br />
and to reduce environmental impact, it is desirable to<br />
use as thin a polymeric web as possible. In the case<br />
of a syringe pack, the film thickness may typically be<br />
65 – 150µ, reducing to as low as 15 – 35µ in the corners<br />
after the thermoforming process. This is adequate<br />
for providing a sterile environment, but may not be<br />
sufficiently rugged for the life and demands of the packaging.<br />
For instance, during transit from the manufacturing<br />
site to the end user, it is important that the package<br />
remains intact with no holes or pits forming in the film.<br />
A small hole of 10 microns will allow airborne bacterial<br />
spores to ingress into the pack, leading to a sterilization<br />
failure.<br />
At REXAM, one of the top consumer packaging companies<br />
in the world, transit tests have been devised<br />
to simulate and quantify levels of packaging failure for<br />
syringe packs. The rates of failure typically average less<br />
than 0.2%, with the two primary causes being abrasion<br />
and puncture by the syringe. Failure due to puncture<br />
was of primary interest to REXAM engineers. They<br />
wanted to develop a technique to predict failure accurately<br />
and use this knowledge to “reverse engineer”<br />
their packaging, so that it would be less prone to puncture.<br />
The approach they chose involved two computational<br />
software packages: POLYFLOW, to model the<br />
thickness distribution of the thermoformed pack; and<br />
MSC.Marc, a stress analysis code, to model the strain<br />
rate of the thermoformed packaging and predict probabilities<br />
for puncturing the pack. When combined, these<br />
two simulation techniques could be powerful predictors<br />
of mechanical strengths for a given type of syringe packaging.<br />
REXAM engineers validated their modeling approach<br />
for a typical 10ml syringe package using two different<br />
film packaging materials. Both films were thermoformed<br />
into a “coffin” style die for the 10ml syringe.<br />
In the experimental tests, randomly chosen packs were<br />
punctured using a Lloyd Tensile Tester. CFD models<br />
for the two cases were set up in POLYFLOW, using the<br />
physical properties, including the special rheological<br />
behavior, of each material used. A membrane approximating<br />
approach was used to simulate the thermoforming<br />
process in order to reduce the computational<br />
time required. The CFD predictions were in excellent<br />
agreement with measurements for one of the films,<br />
and in good agreement for the other. The puncture<br />
resistance simulations using MSC.Marc were also in<br />
very good agreement with measurements, thus confirming<br />
the suitability of this dual simulation approach<br />
for analyzing this type of film packaging. REXAM believes<br />
that the ability to assess material changes in the packaging<br />
design will lead to significant time and cost savings<br />
in their manufacturing processes in the future. ■<br />
Typical syringe and packaging<br />
Preventing<br />
Punctures in<br />
Sterile Packaging<br />
by Roy Christopherson, REXAM Flexibles Ltd., Bristol, England<br />
POLYFLOW CFD simulation of the<br />
“coffin” thermoformed product<br />
packaging, showing the thickness<br />
distribution. Predictions for thickness<br />
at five locations on the coffin surface<br />
were found to be in very good<br />
agreement with experimental<br />
measurements for both materials<br />
tested.<br />
materials processing<br />
Fluent NEWS spring 2002<br />
S5
semiconductor<br />
materials processing<br />
Optimizing<br />
Photo-Resist<br />
Film Uniformity<br />
by David Crowley, Tokyo Electron Texas, Inc.,<br />
Austin, TX<br />
Flow characteristics within the exhaust cup<br />
Tokyo Electron Texas, Inc., (TEX) is part<br />
of a worldwide organization, Tokyo Electron<br />
Limited (TEL), a leader in semiconductor<br />
and LCD production equipment based in<br />
Japan. TEX performs research and development<br />
for Tokyo Electron’s Clean Track systems,<br />
which dominate the market because of their<br />
reputation for superior reliability and performance.<br />
Clean Track systems are used in the photolithography<br />
process that silicon wafers undergo<br />
during microchip fabrication. They are used<br />
to coat silicon wafers with a sub-micron thick<br />
layer of photo-sensitive polymer (called<br />
photo-resist), perform baking and surface preparation<br />
processes, send the wafers to a pattern<br />
exposure tool, and develop the photo-resist<br />
after exposure. The precision of the resulting<br />
pattern is strongly dependent on the uniformity<br />
of the photo-resist thickness across the<br />
wafer. This thickness is governed by the wafer<br />
rotation speed and air flow inside the system,<br />
which is driven in part by the design of an<br />
exhaust cup, used to remove volatiles. To understand<br />
the features of two different exhaust cup<br />
designs, two models of about 1.4 million cells<br />
each were analyzed using FLUENT.<br />
The FLUENT results were in agreement with<br />
a simulation done previously by TEX’s parent<br />
company, Tokyo Electron Kyushu (TKL),<br />
which used slightly different boundary conditions<br />
and other software tools. The results<br />
supported observations of vortices created at<br />
high spin speeds, giving engineers confidence<br />
in the simulation techniques and providing<br />
valuable information related to the modification<br />
of the exhaust cup to improve the system<br />
performance. In the future, FLUENT will<br />
be used to verify improvements to the airflow<br />
and exhaust system designs. ■<br />
Sharp Labs Uses FIDAP to<br />
Accelerate Promising Flat Panel<br />
Display Research<br />
by Tolis Voutsas, Sharp Laboratories of America, Camas, WA<br />
Sharp Laboratories is the worldwide leader in the development and mass-production of flat<br />
panel displays, otherwise known as thin film transistor LCDs, or TFT-LCDs. Recently there<br />
has been an explosive growth of low-temperature polycrystalline silicon (poly-Si) TFT technology<br />
that promises to deliver novel, high performance, high-content displays. The new concept<br />
of a “sheet-computer,” where the display is the heart of the system, offers multiple functions<br />
(input/output, data/video imaging, etc.) on a very thin and portable device. For such concepts<br />
to materialize, the development of new process technology is needed to understand the complex<br />
interactions between individual process parameters. Sharp Labs of America is focusing on<br />
the development of such new processes, equipment, and materials to advance the state of LCD<br />
technology.<br />
One area of particular interest and complexity is the crystallization of amorphous silicon to<br />
form poly-Si films. The quality of the poly-Si microstructure impacts the performance of devices<br />
made with these films and profoundly affects the display capabilities. FIDAP has been used to<br />
simulate the transformation of amorphous-Si thin films to poly-Si through irradiation of the former<br />
by a pulsed laser beam. This is a highly complicated process in which the thin film experiences<br />
ultra-rapid heating, melting, and equally rapid cooling. The process is complicated by several<br />
factors: phase change occurs far from thermal equilibrium; nucleation occurs in the molten material<br />
as it cools, and the crystals grow and coalesce. A number of modifications have been implemented<br />
in FIDAP through user-defined subroutines to incorporate these complexities into the<br />
existing phase change model.<br />
Equipped with this advanced simulation tool, the temperature history in the film as a function<br />
of the relevant problem parameters can be computed, and the final microstructure within<br />
the laser-irradiated area can be predicted. The predicted microstructure has been found to compare<br />
favorably with images of the actual material obtained experimentally. As a result, FIDAP<br />
has been used as a reliable substitute for experimental work to identify promising operating regimes<br />
that optimize the material properties (microstructure). In addition, simulation has been used to<br />
investigate different irradiation schemes that are either difficult or expensive to implement experimentally,<br />
unless sufficient evidence exists to warrant the value of the expenditure. As new features<br />
have been added to the model, the value of accurate simulation has proved to be invaluable<br />
in the investigation of these highly complex processes. A vast array of operating regimes can now<br />
be explored without having to resort to tedious and time consuming traditional methods. ■<br />
temperature (K)<br />
3000<br />
2800<br />
2400<br />
2000<br />
1600<br />
1200<br />
800<br />
400<br />
0<br />
0.00<br />
Si<br />
SiO2<br />
laser pulse<br />
substrate<br />
0.05 0.10 0.15 0.20<br />
Temperature history at various locations<br />
within the film stack<br />
Position and temperature of the solid-liquid interface<br />
within the top Si layer as a function of elapsed time<br />
Comparison of simulated (left) and experimental (right) poly-Si microstructure for<br />
the case of laser irradiation that results in random nucleation at the center of the<br />
irradiated domain, a scenario that is typically undesirable<br />
interface position (µm)<br />
4<br />
3<br />
2<br />
1<br />
0<br />
0.00<br />
interface temperature<br />
interface position<br />
0.05 0.10 0.15 0.20<br />
0.25 0.30<br />
1800<br />
1700<br />
1600<br />
1500<br />
1400<br />
1300<br />
interface temperature (K)<br />
S6 Fluent NEWS spring 2002
semiconductor<br />
Optimization of Vapor Purging<br />
in Wafer Isolation Pods<br />
by Keyvan Keyhani and Sameer Abu-Zaid, Asyst Technologies, Inc., Fremont, CA<br />
Asyst Technologies, Inc. is the<br />
world’s leading provider of<br />
environmental and automated<br />
work-in-progress material<br />
management systems for the semiconductor<br />
manufacturing industry.<br />
For the fabrication of integrated circuits,<br />
Asyst’s automated wafer isolation<br />
solutions enable the safe and<br />
rapid transfer of wafers between<br />
process equipment and the fabrication<br />
line, thus increasing production<br />
yield and reducing operating<br />
expenses. At Asyst, CFD analysis is<br />
used for design optimization during<br />
product development, performance<br />
verification of existing<br />
systems, and troubleshooting of contamination<br />
problems. CFD has<br />
proven to be a valuable tool in the<br />
design and analysis of a broad range<br />
of environmental isolation systems.<br />
As an example of the value of<br />
CFD analysis at Asyst, FLUENT has<br />
been used to optimize nitrogen purg-<br />
Geometry of the CFD model. The front surfaces of the FOUP<br />
have been removed to display the wafers. The inlet and<br />
outlet ports are shown on the bottom in blue and green,<br />
respectively.<br />
ing of a 300mm front opening unified<br />
pod (FOUP). Vapors inside FOUPs<br />
can damage wafers during transport,<br />
storage, and queuing between<br />
processes. For example, moisture<br />
can cause native oxide growth, corrosion,<br />
and cracking of films, and<br />
contamination by various organic<br />
compounds can degrade the electrical<br />
properties of integrated circuits.<br />
Purging with an inert gas, such<br />
as nitrogen, is a method of removing<br />
harmful vapors from FOUPs.<br />
To determine optimal purging<br />
methods, a CFD model of the system<br />
was developed. A FOUP<br />
geometry filled with 25 wafers was<br />
first constructed using Pro/E, and<br />
the model was imported into<br />
GAMBIT for meshing. The FOUP was<br />
initially set to contain air (with 20.7%<br />
oxygen). Pure nitrogen was then<br />
injected through inlet ports on the<br />
bottom of the FOUP, and the transient<br />
change in vapor concentration<br />
was computed. Various injection<br />
and exhaust methods were simulated<br />
using the same total amount<br />
of nitrogen for all cases, to determine<br />
the fastest rate of oxygen<br />
removal in all regions of the FOUP.<br />
Examination of a series of oxygen<br />
contour plots on the center<br />
plane of the FOUP show that the<br />
average concentration of oxygen<br />
drops rapidly over time, and that<br />
regions between the wafers can be<br />
effectively purged within an acceptable<br />
time period. Plots of oxygen<br />
concentration vs. time between two<br />
wafers show good agreement<br />
between FLUENT predictions and<br />
experiment. Using CFD as a predictive<br />
tool for purging optimization<br />
is less expensive than<br />
experimentation and provides<br />
Contours of mass percent of oxygen on a plane through the<br />
wafer centers after 40s of purging (not the optimal purge<br />
results). The FOUP initially has 20.7% oxygen (red) in every<br />
region.<br />
% oxygen<br />
100<br />
10<br />
1<br />
0.1<br />
0.01<br />
0 40 80<br />
FLUENT<br />
Measurement<br />
120 160 200 240<br />
time (s)<br />
Comparison of FLUENT results and data at the center point<br />
between the top two wafers (not the optimal purge results)<br />
detailed concentration results in every<br />
location within the FOUP.<br />
Work is ongoing at Asyst to further<br />
improve the purging of FOUPs<br />
using FLUENT simulations. Asyst is<br />
also presently using FLUENT for<br />
design optimization of the next generation<br />
of ultra-clean mini-environments<br />
for automated 300 mm<br />
wafer handling. ■<br />
materials processing<br />
Fluent NEWS spring 2002<br />
S7
metallurgy<br />
materials processing<br />
Steel Industry<br />
Applications at<br />
ARCELOR<br />
by Jean-Francois Domgin and Pascal Gardin, IRSID, ARCELOR, Maizieres les Metz, France<br />
Process chart<br />
vertical velocity [m/s]<br />
0.5<br />
0.4<br />
0.3<br />
0.2<br />
0.1<br />
0.0<br />
-0.1<br />
Ladle<br />
-0.2<br />
0.0 0.2 0.4<br />
r/R<br />
Continuous<br />
casting mold<br />
experimental results<br />
Eulerian approach (FLUENT 4.5)<br />
Lagrangian approach<br />
0.6 0.8 1.0<br />
Fluid velocity for a water scale model of a ladle – FLUENT<br />
results compared to experimental data<br />
The manufacture of steel products is a complex<br />
process. Demands for improved product<br />
quality have led research centers<br />
dedicated to the steel industry to try to better<br />
understand all phases of the manufacturing<br />
process. Improved measurement techniques<br />
and numerical simulation are two of the many<br />
areas where the efforts have been directed.<br />
At ARCELOR, Europe’s largest steel producer<br />
and one of the leading steel producers in<br />
the world, FLUENT has been used for<br />
numerical simulations of various steel production<br />
processes, many of which involve multiphase<br />
flow. The work has been carried out at IRSID,<br />
the company’s central research organization.<br />
purging in a ladle<br />
Steel ladles are used for the transport of<br />
molten steel to product forming stations, temporary<br />
holding prior to the forming operation,<br />
chemical addition, and purging.<br />
Chemical addition is done to give the steel<br />
the required properties, and purging, usually<br />
with jets of argon gas, is done to homogenize<br />
the mixture, both thermally and<br />
chemically. It is also used to promote the upward<br />
motion of inclusions, undesired particulate<br />
matter that develops when certain substances<br />
are added. A slag, or layer of impurities, forms<br />
on top of the molten metal, and by transporting<br />
the inclusions to the slag layer, they<br />
can be removed with the slag prior to product<br />
forming. Both the discrete phase model<br />
(DPM) and the Eulerian multiphase model<br />
have been used to simulate the purging process,<br />
and results are in good agreement with PIV<br />
measurements on water scale models.<br />
decarburization in a<br />
vacuum degasser<br />
Vacuum degassing is another process that<br />
is used to purify molten steel. The steel is drawn<br />
up from the ladle through a snorkel into a<br />
vessel held at high temperature and low pressure,<br />
an environment that helps remove<br />
unwanted carbon and dilute gas from the melt.<br />
The upward flow is driven by the injection<br />
A vacuum degasser, showing the two snorkels at the bottom<br />
of argon or oxygen gas. The steel is returned<br />
to the ladle through another snorkel after the<br />
degassing and decarburization have occurred.<br />
FLUENT has been used at ARCELOR to simulate<br />
the flow field induced by the gas injections,<br />
and to study the tracks of carbon and<br />
gas particles in the degasser.<br />
cleanliness in<br />
continuous casting<br />
The continuous casting process has been<br />
studied carefully because it is critical to the<br />
final product quality. Casting is most successful<br />
if there is a gradual yet steady growth of the<br />
solidified shell, with few or no inclusions trapped<br />
in the material. An understanding of the flow<br />
patterns in the casting mold is therefore very<br />
important, since it is an indicator of the inclusion<br />
behavior and can be used to evaluate<br />
the effects of argon injection mechanisms and<br />
electromagnetic actuators. The effect of argon<br />
injection can be simulated using either the<br />
DPM or Eulerian multiphase model. Inclusions,<br />
on the other hand, are best modeled using<br />
the DPM, since it more conveniently allows<br />
for a range of particle sizes and densities.<br />
Electromagnetic fields have been incorporated<br />
into the FLUENT simulations using a module<br />
developed at the EPM-MADYLAM<br />
Laboratory in Grenoble. The module includes<br />
a Lorentz force term in the momentum equations<br />
for the melt and particles that has been<br />
found to contribute not only to the flow patterns<br />
and particle trajectories, but to the deformation<br />
of the free surface as well. ■<br />
Behavior of inclusions injected into a continuous<br />
casting mold<br />
S8 Fluent NEWS spring 2002
HVAC<br />
Smoke Management<br />
at Frankfurt Airport<br />
by Ingo Cremer, Joachim Luy, Jens Elmers, and Albrecht Gill, Fluent Germany<br />
An overview of the buildings at Terminal 1<br />
In Germany, the occurrence of one severe fire accident<br />
at an airport has led officials to review the existing<br />
fire protection strategies for airport buildings as<br />
well as those for renovated terminals. Thus when the<br />
renovation of Terminal 1 at Frankfurt Airport was planned,<br />
fire protection scenarios had to be checked and possibly<br />
optimized. In order to compare the performances<br />
of different concepts, FLUENT simulations of the original<br />
geometry of the terminal were ordered by the airport<br />
authorities. For validation purposes, experiments<br />
using a 1:20 model were performed.<br />
The effort began with simulations of the external air<br />
flow around the buildings that make up the terminal. The<br />
results were used to predict static pressures along the outer<br />
surfaces of the buildings and at several potential building<br />
openings. A second set of simulations focused on fire<br />
management inside the departure hall of Terminal 1. Of<br />
particular interest was the time-dependent dispersion<br />
of smoke using different combinations of ventilation fans<br />
and openings. Results from the external simulations were<br />
used to identify the optimum locations for fresh air supplies<br />
for the fire scenarios.<br />
For the external flow simulations, GAMBIT and TGrid<br />
were used to build a hybrid mesh of about 4.9 million<br />
cells, based on engineering drawings of the airport buildings.<br />
This model spans a geometric region of 2830 x<br />
2830 x 500m 3 . Surrounding the building of interest, a<br />
typical mesh size of 0.9m was used. An exponential profile<br />
for the wind velocity as a function of height above<br />
the ground was used as a boundary condition. Two wind<br />
conditions were considered: one blowing from the<br />
Northeast at 3.7 m/s (8 mph), and one from the Southwest<br />
at 5.4 m/s (12 mph). The simulations were performed<br />
using the parallel version of FLUENT. All of the external<br />
flow results, even the pressure levels on the building<br />
surfaces, were successfully validated through<br />
Fluent NEWS spring 2002 23
HVAC<br />
measurements on the scaled structure.<br />
Because of a tall building adjacent to (and south of)<br />
the departure hall, the pressures on the roof of the departure<br />
hall were found to be different for the different wind<br />
conditions. This important realization made it clear that<br />
the smoke management had to be based on a combination<br />
of fans and natural smoke outlets, rather than<br />
on outlets alone. Fans ensure consistent smoke extraction,<br />
independent of exterior weather conditions that<br />
might compromise the efficacy of the outlets.<br />
The second phase of the project involved an examination<br />
of the flow field inside Terminal 1 itself, with the<br />
primary goal being the optimization of the smoke management<br />
system in the departure hall. A mixed concept<br />
of mechanical and natural ventilation systems was<br />
tested. The internal geometry was again created in GAM-<br />
BIT based on engineering drawings of Terminal 1. Most<br />
of the meshing was done in GAMBIT as well, while TGrid<br />
was used to assemble the meshed parts into a whole.<br />
The resulting mesh had 1.3 million cells. To have the<br />
flexibility of placing trial outlets where needed, this model<br />
was equipped with openings in many locations. For each<br />
simulation, the inactive outlets were switched to walls<br />
in FLUENT. The calculations were again performed using<br />
the parallel solver.<br />
All fire simulations are inherently unsteady. Taking<br />
into account the flow physics, safety requirements, and<br />
flow handling devices typically used for fire prevention<br />
tasks, a sophisticated time dependent control system<br />
was developed. At t=0, the fire is assumed to begin.<br />
After one minute, it is detected, and after another minute,<br />
the smoke outlets are activated. Three minutes after the<br />
fire begins the extinguishing system is activated and after<br />
ten minutes, the fire fighters arrive on the scene.<br />
For the indoor simulations, fires at five different locations<br />
were set up following the guidelines of a fire pro-<br />
Static pressure on the outer surfaces of the buildings during<br />
northeast (above) and southwest (below) wind conditions. The<br />
tall structure at the center alters the pressure on the roof of the<br />
adjacent departure hall for the different wind conditions.<br />
24 Fluent NEWS spring 2002
HVAC<br />
The geometry of the internal model (left)<br />
showing some of the grid detail (right). The<br />
departure hall is the area colored green in<br />
the geometry.<br />
tection expert. The fires were modeled as transient sources<br />
of hot smoke in FLUENT with a number of simplifying<br />
assumptions. Most of the fire simulations were run for<br />
a physical time of 8 minutes, using a time step that ranged<br />
from 0.2 to 4 seconds. In spite of the simplifications<br />
made, all of the simulations showed good agreement<br />
with experimental measurements from the scaled<br />
1:20 model.<br />
Several optimization runs were performed for the different<br />
fire locations. During this phase of the project, it<br />
became evident that dividing the hall volume into active<br />
smoke management segments had a very positive effect<br />
on the smoke exhaust, because the fans were loaded with<br />
the nearby smoke and not air. In contrast, attempts to<br />
dilute the smoke with air had a negative effect. The contaminated<br />
volume merely grew more rapidly and, as a<br />
consequence, more fans with a given volume flow were<br />
needed to carry the smoke-air mixture out of the hall.<br />
In addition to segmenting the hall, attempting to<br />
create a layer of smoke in the upper region while keeping<br />
air in the lower region of the hall was found to be<br />
advantageous, especially near the escape routes. In order<br />
to achieve this, the mixing of smoke and air had to be<br />
suppressed and a stable stratification of gases had to<br />
be achieved with a well-chosen combination of ventilation<br />
fans and building openings. To achieve this goal,<br />
it was found that windows should not be opened in<br />
the wrong places, and that fresh air supplies in general<br />
should be large enough and far away enough to<br />
avoid unwanted mixing.<br />
In the course of the project, several parameters were<br />
modified as the five different fire locations were independently<br />
studied. Special care was taken for regions<br />
with low ceilings, where it was more difficult to create<br />
and maintain a thin smoke layer well above the floor.<br />
Properly positioned fans and smoke outlets were critical<br />
for keeping a nearly smoke-free layer, about 2m<br />
thick, on the floor, to allow people to escape safely.<br />
Based on the experimental and CFD results, the airport<br />
management is able to judge renovation measures<br />
beforehand in order to maintain a high level of<br />
airport security. ■<br />
Fluent NEWS spring 2002 25
HVAC<br />
Improving<br />
Air the for<br />
Arias<br />
26 Fluent NEWS spring 2002
HVAC<br />
by Tamás Régert, Gergely Kristóf, Tamás<br />
Lajos of Budapest University of Technology<br />
& Economics, Budapest, Hungary;<br />
and Atul Karanjkar, Fluent Europe<br />
Budapest, the capital of Hungary, is<br />
one of the most beautiful cities in the<br />
world. One of the jewels in its architectural<br />
crown is the Budapest Opera House,<br />
built by Miklós Ybl in 1884 at the height<br />
of the Austro-Hungarian Empire. It has several<br />
ornate decorations that are stunning,<br />
and like many public buildings of its vintage,<br />
was designed with natural ventilation<br />
in mind. One ventilation feature, for<br />
example, is a central chimney above a large<br />
chandelier that hangs from the ceiling.<br />
When a Fluent Europe staff member<br />
visited the local Fluent partner in Budapest<br />
last year, the two went to the Opera House<br />
to see Tchaikovsky’s Eugen Onegin. It was<br />
a hot day in May, and both felt that the<br />
building was quite warm during the performance.<br />
The experience inspired them<br />
to contact the technical manager of the<br />
Opera House and introduce him to<br />
Fluent’s CFD software, a tool that could<br />
help find a solution to the building’s thermal<br />
comfort control problem.<br />
At the beginning of the last century the<br />
Opera House’s natural ventilation system<br />
relied on drafts that were governed by the<br />
temperature differential across the central<br />
chimney. This meant that higher temperatures<br />
were needed in the upper reaches<br />
of the building in comparison to the<br />
cooler temperatures outside. The natural<br />
drafts acted to draw air up and out of the<br />
auditorium. Vents underneath the seating<br />
area could be opened to permit air to flow<br />
into the auditorium, if needed. During the<br />
summer months, the incoming air passed<br />
over ice blocks to provide additional cooling.<br />
In the past decades the ventilation<br />
system was modernized several times, with<br />
the last upgrade occurring in the 1980s.<br />
During the renovations, forced ventilation<br />
and air conditioning systems were introduced,<br />
and the stage was outfitted with<br />
a separate air conditioning system, which<br />
prevents cross-flow between the auditorium<br />
and stage.<br />
Fluent’s Hungarian partner decided to<br />
offer the manager of the Opera House a<br />
free HVAC assessment of their building,<br />
with the goal of identifying hot spots dur-<br />
ing a typical performance. The CFD simulation<br />
encompassed the whole auditorium<br />
(minus the stage) with the simulated<br />
effect of an audience of 1250 heat-generating<br />
people and the lights dimmed. The<br />
realizable k-ε turbulence model was used<br />
in the study and full buoyancy effects were<br />
included. The CFD results showed that the<br />
orchestra pit ventilation was poor in places,<br />
a fact that musicians all too readily confirmed<br />
from their own experiences.<br />
Thermal anomalies in the balconies were<br />
also correctly identified.<br />
This is not the first time that consultants<br />
have helped the Budapest Opera House.<br />
Fifty years ago, the celebrated scientist Leo<br />
Beranek, an expert in the field of acoustics,<br />
carried out a sound characterization of the<br />
building. His data is still in use today. Fluent’s<br />
CFD study will be used in an upcoming<br />
reconstruction and modernization of the<br />
Opera House, which will include an overhaul<br />
of its air conditioning system. Once<br />
the renovations are complete, opera enthusiasts<br />
in Budapest will no doubt be appreciative<br />
of Fluent’s CFD efforts for the next<br />
fifty years! ■<br />
Path lines, colored by temperature, show differences of up to<br />
5°C throughout the seating area and orchestra pit<br />
A view from the stage of the simulated auditorium, showing<br />
temperature contours<br />
Fluent NEWS spring 2002 27
automotive<br />
Customized<br />
Phosphate Dip Tanks for Cars<br />
by Christof Knüsel, Dürr Systems GmbH, Paint Systems Automotive, Stuttgart, Germany<br />
As a full-range systems supplier,<br />
Dürr Systems GmbH offers<br />
turn-key paint shops for<br />
mass production paint finishing. The<br />
complete package contains buildings,<br />
plant and environmental engineering,<br />
conveyor equipment and control,<br />
automation, and material<br />
handling techniques. Dürr also<br />
offers a complementary range of manufacturing<br />
support services for all<br />
aspects of the paint finishing process.<br />
One important component of their<br />
work involves CFD simulations.<br />
Since 1998, Dürr has used FLUENT<br />
to model such things as air flow in<br />
spray booths and work stations, air<br />
flow and heat transfer in ovens, mist<br />
elimination in scrubbers, response to<br />
electric fields during cathode dip painting,<br />
and fluid flow in dip tanks.<br />
Pretreatment is the first of many<br />
stages in the painting process. Here<br />
the automotive body is cleaned and<br />
prepared for subsequent coating<br />
processes using methods appropriate<br />
for the material involved (steel,<br />
aluminium, magnesium, etc). One<br />
phase of the pretreatment process,<br />
called phosphating, is used to apply<br />
a zinc phosphate base coat. The<br />
process is normally carried out in dip<br />
tanks, where the flow is driven by<br />
100 to 300 injection nozzles. This coat<br />
protects the body from corrosion and<br />
acts as a bonding base. A secondary<br />
reaction produces iron phosphate,<br />
which takes the form of sludge and<br />
is removed from the dip tank continuously.<br />
When the process is applied to<br />
aluminium sections, it triggers a further<br />
secondary reaction, which produces<br />
cryolite. To counteract any<br />
reduction in surface quality arising<br />
from the presence of cryolite, the flow<br />
velocity should always be above 0.3-<br />
0.5 m/sec near the aluminium<br />
components. Since the current<br />
trend is toward bodies with more aluminium<br />
parts, phosphate tanks in exist-<br />
28 Fluent NEWS spring 2002
automotive<br />
ing plants often need to be upgraded<br />
for new car models in order to<br />
increase the flow velocity at critical<br />
points.<br />
CFD simulation is an excellent tool<br />
for optimizing the flow in a phosphate<br />
tank. First, a simulation of one<br />
injection nozzle is carried out using<br />
a fine grid of approximately 150,000<br />
cells. The results are used to generate<br />
velocity and turbulence profiles<br />
that are characteristic of the nozzle.<br />
Second, a simulation of the complete<br />
tank is performed using a larger (about<br />
2 million cells), yet comparatively coarser<br />
grid. The velocity and turbulence<br />
profiles predicted in the first simulation<br />
are used as boundary conditions<br />
for the injection nozzles in the<br />
second. The profiles are modified<br />
slightly to ensure that the jet characteristics<br />
on the coarser grid are nearly<br />
identical to those on the fine grid<br />
of the first simulation. The second<br />
round of calculations usually requires<br />
several days to obtain a suitably converged<br />
solution, using a 1.0 GHz<br />
processor. Experiments using tanks<br />
filled with water show good agreement<br />
with the simulation.<br />
CFD has enabled Dürr to develop<br />
new dip tanks with optimized flow<br />
conditions and offer customers individual<br />
solutions for optimizing existing<br />
tanks to suit new car models. The<br />
3D simulation plots make it easy for<br />
customers to understand where the<br />
problem areas lie, and where modifications<br />
should be made to obtain<br />
a better surface quality. A decline in<br />
surface quality can result from poor<br />
flow in dip tanks, and can add expense<br />
to customers’ operating costs. In many<br />
cases it can be avoided with CFD. ■<br />
Detail of injector nozzle jet simulation<br />
Detail simulation of injector nozzle jet<br />
Flow in a dip tank: the side-flooding<br />
system is illustrated by path lines<br />
Fluent NEWS spring 2002 29
automotive<br />
Arrows<br />
Formula 1<br />
Team<br />
Moving Up<br />
The Grid<br />
by Peter Machin, Senior CFD Engineer, Arrows Formula One Team, Oxfordshire, UK<br />
The Formula One racing calendar consists of 17 grueling races across<br />
four continents. The only goal of each team is for its car to win. The<br />
teams are focused on building racing cars to compete at the pinnacle<br />
of motorsport. There are many factors that must be considered in designing<br />
such a highly complex machine. The designers’ aim is to make the car<br />
the fastest around every corner, on every lap. Driver ability, weather conditions,<br />
and luck play a part, but the performance of the car is paramount.<br />
In recent years, the Arrows Formula One Team has used FLUENT to maximize<br />
performance. The majority of our team’s work has been in the area<br />
of wing design, with a particular focus on assessing the level of downforce<br />
and its effect on the performance of the car. Over half of the car’s total<br />
downforce is due to the wings. However, the production of downforce comes<br />
with an associated drag force penalty. The aim of the designer is to find<br />
wings that generate more downforce with a minimum increase in drag,<br />
which on the racetrack could mean the difference between a place on the<br />
podium or not.<br />
Without CFD, many more wing prototypes would have to be constructed<br />
and tested, which would be very time consuming and expensive at a time<br />
when the focus is on ever-shortening design cycle times. Before CFD, all<br />
F1 wings were very similar and based on ground-effect wing profiles published<br />
in the public domain. Thanks to CFD, designers can predict exactly<br />
which performance improvements will accompany every wing shape<br />
modification, no matter how subtle. Indeed, we can usually expect better<br />
than 90% accuracy on wing element forces before putting them in the wind<br />
tunnel. FLUENT has also been used to provide accurate load data for our<br />
stress department, and forces on other parts of the car.<br />
One important issue that all Formula One teams must focus on is safety.<br />
Ultimately, safety comes first and the Fédération Internationale de l’Automobile<br />
(FIA) has laid down clear rules to which each team must adhere. Each race<br />
season, CFD is used to optimize the racing car design within the FIA regulations.<br />
In recent years, it has been particularly useful in reacting to aerodynamic<br />
rule changes that have further limited the size and number of wing<br />
elements on the car to reduce cornering speeds.<br />
At Arrows, our long-term objective with CFD software is to carry out<br />
much more detailed full-car work. We regularly do simulations of 10 million<br />
cells and plan to expand to 30 million cells in the near future as we<br />
tackle larger problems and look at existing ones with finer mesh resolution.<br />
It is our belief that as FLUENT becomes more widely used on such<br />
areas as radiator cooling flows, it will become as common as CAD on the<br />
designer’s desktop computer. ■<br />
30 Fluent NEWS spring 2002
automotive<br />
External flow around the body and inside the engine bay<br />
of the Bentley Arnage: contours of static pressure and path<br />
lines colored by velocity magnitude<br />
For the Driver Who<br />
Has Everything<br />
by Keith Hanna, Director of Marketing Communications, Fluent Inc.<br />
Project done in collaboration with MSX International Ltd. and Bentley Motors<br />
With 835 Nm of torque, 400 bhp<br />
(brake horsepower) and a 6.75<br />
liter V8 engine, the elegant<br />
Bentley Arnage is an English luxury automobile<br />
from the old school. Hand-built<br />
in Great Britain by Bentley Motors of Crewe,<br />
now part of the German Volkswagen Group,<br />
these luxuriously appointed, individually<br />
tailored cars are the most powerful<br />
Bentleys ever, capable of speeds up to 155<br />
mph with an impressive acceleration of<br />
0 – 60 mph in just 5.9 seconds. In addition<br />
to its awesome engine, the Bentley<br />
Arnage is noted for its outstanding ride<br />
characteristics, minimal internal noise, speedsensitive<br />
steering, and spacious interior.<br />
Recently, Bentley has married the ageold<br />
tradition of English engineering<br />
craftsmanship to advanced technology to<br />
further perfect its designs. This effort has<br />
resulted in state-of-the-art suspension, transmission,<br />
braking systems and, thanks to<br />
CFD simulations performed by Fluent<br />
Europe and MSX International, improved<br />
aerodynamics. MSX is a British firm that<br />
provides engineering solutions for its clients.<br />
After evaluating a number of CFD codes,<br />
they selected FLUENT to simulate the external<br />
flow around the Bentley Arnage. The<br />
choice was based on FLUENT’s ease-ofuse<br />
and flexible meshing capabilities.<br />
The CFD work made use of a centerline<br />
symmetric model created with<br />
detailed underhood and underbody resolution<br />
that was subsequently used in a<br />
benchmark study. The FLUENT simulation<br />
was adapted to values of y+ and gradients<br />
of pressure during the convergence<br />
process, and the final CFD predictions<br />
agreed well with experimental measurements.<br />
Engineers from MSX and<br />
Bentley look forward to using CFD to tackle<br />
future challenges in the design and optimization<br />
of the next generation of elite<br />
cars. This automotive manufacturer is clearly<br />
setting the pace at the top end of the<br />
automotive market in more ways<br />
than one. ■<br />
Path lines<br />
colored by<br />
velocity<br />
magnitude<br />
showing the<br />
flow pattern<br />
near the<br />
underbody<br />
of the<br />
Bentley<br />
Arnage<br />
Fluent NEWS spring 2002 31
power generation<br />
The Power of SOFC<br />
Fuel Cells<br />
by Mehrdad Shahnam and Michael Prinkey, Senior Consulting Engineers, Fluent Inc.<br />
The geometry of the tubular SOFC shows the interconnects in<br />
green (used to electrically connect a stack of fuel cells), the air<br />
inflow and oxidizer channel in red, and the electrolyte in blue.<br />
The anode and cathode are cylindrical surfaces on the inside<br />
and outside of the electrolyte, respectively.<br />
exterior<br />
fuel flow<br />
electrolyte<br />
interconnect<br />
support tube<br />
oxidizer channel<br />
Temperature contours on the cathode<br />
side of the electrolyte<br />
air flow in<br />
Fuel cell technology promises to provide an environmentally<br />
friendly source of power with broad applications in many<br />
industries, such as transportation and the military. Among<br />
the current issues surrounding the continued development<br />
and deployment of this technology is that of manufacturing<br />
costs. Reduction of manufacturing costs can only be realized<br />
by optimizing the efficiency of the devices, and this can<br />
only happen through detailed analysis of the complex electrochemical<br />
and mass transport phenomena taking place.<br />
Fluent has developed modeling tools for FLUENT to help<br />
meet this need, so that engineers can optimize fuel cell design<br />
as well as performance. (See the Partnerships section on page<br />
42.) As part of this ongoing effort, a user-defined function<br />
(UDF) has been developed recently with detailed models<br />
for Solid Oxide Fuel Cells (SOFC), a variety that is being targeted<br />
for distributed power applications, portable power generation<br />
(for the military), and auxiliary power units (or APUs,<br />
for commercial aircraft).<br />
The SOFC module works in tandem with a FLUENT calculation<br />
that includes species transport and heat transfer.<br />
Species and temperature fields are passed to the SOFC model,<br />
which uses them to compute the current density, cell voltage,<br />
and heat flux at the electrodes. This information is then<br />
passed back to FLUENT, where it is used to update the species<br />
and temperature fields. The process continues in an iterative<br />
manner until convergence is reached. In addition to the<br />
fuel cell geometry, the operating characteristics include the<br />
total current output for the fuel cell, which is set as an initial<br />
condition. The comprehensive SOFC model, which is fully<br />
parallelized, address the following important processes:<br />
electrochemistry<br />
Appropriate chemical reactions for H 2 and CO are used<br />
to predict the local current density and voltage distributions<br />
at the electrolyte surfaces. The electrolyte layer is assumed<br />
thin for electrochemical modeling purposes (the ionic transport<br />
across the electrolyte is assumed to be one dimensional),<br />
but a finite thickness region in the FLUENT simulation can<br />
be used to represent it. The electrochemical model takes<br />
into account the losses due to activation overpotential (kinetic<br />
losses), ohmic overpotential (losses due to ionic transport<br />
in the electrolyte), and concentration overpotential (losses<br />
due to to inadequate diffusion of species through the electrodes).<br />
Binary diffusion coefficients are used to calculate the<br />
molecular diffusion of the (gaseous) species throughout the<br />
domain.<br />
32 Fluent NEWS spring 2002<br />
The current density and voltage on a<br />
surface through the electrolyte<br />
potential field<br />
This model predicts the current and voltage in all conducting<br />
solid and porous regions of the SOFC. Heat generated<br />
as a result of ohmic losses in the conducting regions<br />
is also predicted.<br />
The model has been applied recently to a tubular SOFC,<br />
where hydrogen and air are used as the fuel and the oxidizer,<br />
respectively. Fuel utilization is about 80% and the oxidizer<br />
utilization is about 25%. The total cell current is 11<br />
Amp and the average current density is 1850 A/m 2 . The figures<br />
illustrate the non-uniformity in several of the fuel cell<br />
variables that could not be captured by a more simplified<br />
approach. ■<br />
more.info@<br />
fuelcells@fluent.com
power generation<br />
The 3D hybrid mesh used for all simulations<br />
Researchers at the Combustion Technology Section<br />
of ENEA (Research Center La Casaccia) in Rome<br />
recently validated FLUENT through a series of simulations<br />
of the WS Rekumat C-150 B burner. Operation<br />
of the 40 kW burner is based on flameless combustion<br />
technology 1 , which gives rise to high process efficiency<br />
with low pollutant emissions. While the burner is designed<br />
to operate in either conventional flame or diluted combustion<br />
(flameless) modes, only the latter was the subject<br />
of the present studies. Measurements were made<br />
for three sets of operating conditions, corresponding<br />
to process temperatures of 950, 1050, and 1150 K. These<br />
were compared to results predicted by FLUENT for the<br />
corresponding conditions.<br />
In FLUENT, two different combustion modeling<br />
approaches were tested: the mixture fraction/pdf method,<br />
using an equilibrium assumption, and the Magnussen,<br />
or finite rate/eddy dissipation method, using a one-step<br />
reaction mechanism. For both sets of simulations, NO x<br />
prediction was performed. The realizable k-ε turbulence<br />
model was chosen to give the most accuracy for the<br />
least amount of CPU effort, based on earlier benchmark<br />
tests performed for similar conditions. Radiation was incorporated<br />
through the use of the discrete ordinates (DO)<br />
model.<br />
Both the pdf and Magnussen models gave good qualitative<br />
agreement with the experimental data, with the<br />
Magnussen model outperforming the pdf model in its<br />
prediction of centerline temperatures for the low and<br />
moderate process temperature cases. This result suggests<br />
that at these temperatures, the diluted combustion<br />
is controlled more by kinetics than by turbulent mixing.<br />
The equilibrium assumption at the core of the pdf model<br />
fails to accurately predict the ignition delay in this regime.<br />
At the highest process temperature, the ignition delay<br />
is reduced. The Magnussen model overpredicts the delay<br />
as well as the maximum temperature. The pdf model,<br />
on the other hand, comes closer to predicting the overall<br />
temperature field, even though the maximum temperature<br />
is again higher than that suggested by the<br />
measurements. This result suggests that turbulent fluctuations<br />
in the local temperature and mixture fraction,<br />
which are better handled by the statistical methods of<br />
the pdf model, play a more important role in this regime<br />
of operation. Temperature fluctuations were found to<br />
play a significant role in thermal and prompt NO x production<br />
at the higher temperature, as well. ■<br />
Flameless<br />
Burner<br />
Validation<br />
by Daniele Tabacco and Claudio Bruno, University of Rome La Sapienza -<br />
Department of Mechanics and Aeronautics, Rome, Italy; and<br />
Giorgio Calchetti and Marco Rufoloni, Italian National Agency for New Technology,<br />
Energy, and the Environment (ENEA), Rome, Italy<br />
The measured temperatures for the 1050 K reference temperature case<br />
The temperatures predicted by FLUENT for the 1050 K reference<br />
temperature case, using the one-step Magnussen model<br />
reference<br />
1 Wunning, J. A., and Wunning, J. G., Burners for Flameless Oxidation<br />
with Low-No x Formation Even at Maximum Preheat, Journal of the<br />
Institute of Energy 65, 35-40, 1992.<br />
Fluent NEWS spring 2002 33
product news<br />
New Specialty<br />
Modules for<br />
FLUENT 6.0<br />
by Nicole M. Diana, FLUENT Product Market Manager, Fluent Inc.<br />
Contours of the surface dipole strength are shown on the top and bottom surfaces of a blunt flat<br />
plate, as predicted by the flow-induced noise model in FLUENT<br />
A comparison of FLUENT MHD predictions with measurements of normalized steel velocity as a<br />
function of imposed magnetic field at the meniscus of a steel mold. In the simulation, the<br />
meniscus velocity changes its direction slowly with increasing field strength, whereas in the<br />
experiment, the meniscus velocity changes its direction more rapidly. The sudden change in the<br />
actual casting process is due to the effects of injected argon gas, and these effects were not<br />
included in the simulation.<br />
Three UDF-based add-on modules have been developed<br />
for use with FLUENT 6.0. All three modules handle complicated<br />
geometry efficiently using unstructured grids,<br />
and are accessible through the graphical user interface. The<br />
modules have been subjected to the same level of testing<br />
as FLUENT 6.0, and full documentation and technical support<br />
are available.<br />
flow-induced noise prediction<br />
The noise generated by flows across the surface of an<br />
obstruction can be computed using the noise prediction module.<br />
This capability can be applied to the simulation of flowinduced<br />
noise in many industries. Some examples include<br />
noise generated by air flowing past the exterior mirror of a<br />
moving automobile and noise generated by the flow over<br />
landing gear attached to an airframe. Based on a transient<br />
turbulent flow simulation, the time variation of the acoustic<br />
pressure together with the sound pressure level (SPL) are<br />
calculated using Lighthill’s Acoustic Analogy. The large eddy<br />
simulation (LES) turbulence model is highly recommended<br />
for this purpose, since it can capture the wide band sound<br />
spectrum. The model predicts the power spectrum and surface<br />
dipole strength distribution. Results for flow across a<br />
flat plate are in good agreement with experiment data.<br />
magnetohydrodynamic modeling<br />
The interaction between an applied electromagnetic field<br />
and an electrically conductive fluid can be analyzed using<br />
the magnetohydrodynamics (MHD) module. This capability<br />
can be applied to the continuous casting of steel or aluminum,<br />
for example. The model, an upgrade of the MHD<br />
model in FLUENT 4, simulates the flow under the influence<br />
of either constant or oscillating electromagnetic fields. A prescribed<br />
magnetic field can be generated by selecting simple<br />
built-in functions or by importing a user-supplied data<br />
file. Coupling between the flow and the magnetic field is<br />
modeled through the induced current (due to the movement<br />
of conducting material in the magnetic field), and the<br />
effect of the Lorentz (J x B) force as a source term in the<br />
momentum equations. The capability is compatible with both<br />
the discrete phase and volume of fluid models. The effect<br />
of the discrete phase on the electrical conductivity of the<br />
mixture can also be included.<br />
continuous fiber modeling<br />
In the fiber spinning process, molten polymer is extruded<br />
through a spinneret, which normally contains hundreds<br />
of holes, to form multiple fibers. The fibers are then solidified<br />
and drawn down in a quenching chamber. The final<br />
fiber strength and quality is strongly influenced by the gas<br />
flow field surrounding the fibers, including the rate of convective<br />
cooling or heating and the concentration of the<br />
gases within the quenching chamber. The fiber module in<br />
FLUENT 6.0 is an upgrade to the model that originally appeared<br />
in FLUENT 4. It includes the effect of numerous fibers with<br />
complete coupling between the fibers and gas flow. Gravity<br />
effects, friction with the surrounding gas, as well as heat and<br />
mass transfer are included. The model predicts the effect<br />
of fiber motion on the flow field as well as the fiber temperatures<br />
in the quench box. ■<br />
34 Fluent NEWS spring 2002
product news<br />
Fluent’s Ted Blacker Wins the<br />
Meshing Maestro Prize<br />
by Dipankar Choudhury, Chief Technology Officer, Fluent Inc.<br />
The Tenth International Meshing Roundtable conference<br />
was held last fall in Newport Beach, CA.<br />
One of the highlights of this annual meeting is the<br />
naming of the Meshing Maestro, a coveted award that<br />
is given to a conference poster presenter who has generated<br />
a mesh that exhibits innovative technology, and<br />
is both eye-catching and technically sound. Ted<br />
Blacker, the project leader for GAMBIT, was last year’s<br />
winner of this prestigious award. His poster also won<br />
the “Best Technical Poster” award.<br />
The clown grid, one of the examples submitted by<br />
Blacker, made use of technology that was developed<br />
at Fluent Inc. by Blacker and his colleagues Richard Smith,<br />
Yongheng Shao, and Jin Zhu. In particular, new advances<br />
in mesh density controls were used that are now available<br />
in GAMBIT. These controls, called size functions,<br />
are aimed at eliminating automation obstacles during<br />
meshing, particularly when generating a tetrahedral mesh.<br />
Historically, most volume meshing problems are related<br />
to a bad surface mesh. The problematic surface mesh<br />
typically doesn’t capture the geometry well, or isn’t sized<br />
appropriately for thin regions of the geometry. It is also<br />
particularly important in CFD analysis that the gradation<br />
of the mesh be tightly controlled. This control limits<br />
transition rates from small to large elements, allowing<br />
capture of the boundary layer phenomena as well as<br />
control over solution accuracy.<br />
Although density control is not new in the meshing<br />
community, this technique is unique in how grading<br />
controls radiate or propagate to surrounding regions<br />
in a tightly controlled manner. For example, the eyebrows<br />
on the clown have a tight curvature, which is captured<br />
through a curvature-based size function. Not only<br />
is the eyebrow adjusted, however, but portions of the<br />
geometry in close proximity are included in the sizing<br />
effects as well. The forehead near the eyebrow attachment<br />
and even the interior of the eyelid show a graceful,<br />
controlled gradation of size. This ensures that the<br />
volumetric tet mesher can successfully fill this region with<br />
well-shaped elements, with minimal intervention by the<br />
user. A simple size function was defined to capture the<br />
curvature and set the gradation rate. This size function<br />
was attached to the volume and the meshing initiated.<br />
The software then generated the needed octree background<br />
grid and automatically guided the meshing based<br />
on these controls. (An octree is a hierarchical structure<br />
used in certain grid generation algorithms. It begins with<br />
Ted Blacker and his<br />
winning surface mesh<br />
a coarse background grid that is recursively divided until the<br />
desired grid density is achieved.)<br />
The technical advance that is central to the new controls<br />
in GAMBIT is accomplished by imposing individual size<br />
functions (such as the curvature of individual surfaces) on<br />
the underlying octree-based background grid. The octree<br />
depth (the number of levels in the hierarchy, which corresponds<br />
to the grid density) adjusts automatically to capture<br />
regions of importance in the size function. With the aid of<br />
the octree background grid, the size functions can then radiate<br />
beyond the regions where they are defined to accomplish<br />
the control and effects as desired. Three types of size<br />
functions are available, and these can be specified individually<br />
by the user. The edge, face and volume meshing tools<br />
then obtain sizing information directly from the background<br />
in a highly efficient manner. ■<br />
Fluent NEWS spring 2002 35
computing<br />
FLUENT Users<br />
Capitalize on<br />
Parallel<br />
Processing<br />
by Liz Marshall, Fluent Inc.<br />
The computing potential available to<br />
today’s CFD engineers is nothing short of<br />
remarkable. Ten years ago, only the most<br />
adventurous CFD practitioners used models with<br />
more than 100,000 cells. Many simulations of<br />
this size could only be solved on the supercomputers<br />
of the day. Since then, scientists and<br />
engineers have scaled up to larger and larger<br />
problems, fueled by ever-faster hardware at steadily<br />
decreasing cost. The drop in price of processors<br />
and memory has coincided with advances<br />
in software technology to make parallel computing<br />
within the reach of many companies.<br />
For large scale problems, parallel processing algorithms<br />
have been introduced that allow a calculation<br />
to be segmented into two or more<br />
partitions that are solved simultaneously on different<br />
CPUs. Multi-processor workstations, and<br />
networks of single or multi-processor machines<br />
are now routinely being deployed at companies<br />
around the world to make faster work of<br />
simulations of all kinds using parallel processing.<br />
Fluent software users are among those who<br />
have taken advantage of this trend, thanks in<br />
part to the robust and scaleable parallel processing<br />
capabilities of the software.<br />
variety of hardware<br />
There are many ways that a parallel calculation<br />
can be performed. Multi-processor machines<br />
contain two or more CPUs, and can be based<br />
on RISC (running UNIX) or Intel (running<br />
<strong>Wind</strong>ows or Linux) architecture. On a dualprocessor<br />
machine, for example, the two processors<br />
share the memory in the system. The shared<br />
memory enables independent processes to communicate,<br />
using a technique called shared memory<br />
processing (SMP 1 ). Single, or serial<br />
processor machines, which contain only a single<br />
CPU, can be connected over a network to<br />
form a cluster. When a network of such machines<br />
performs a calculation in parallel, the process<br />
is called distributed memory processing (DMP).<br />
Unlike shared memory processing, where a single<br />
machine manages all the memory, with<br />
distributed memory processing the memory<br />
is managed locally on each machine; here, communication<br />
among processes occurs over a network<br />
rather than through shared memory.<br />
Multi-processor machines can also be networked<br />
to other multiple or single processor machines.<br />
Calculations run on a cluster of this type can<br />
use a process called distributed shared memory<br />
processing (DSMP, or often just DSM).<br />
1<br />
SMP traditionally stands for Symmetric Multi-<br />
Processor, used as a designation for a system that<br />
supports shared-memory parallel processing.<br />
Contours of cell partition on a car surface for a mesh subdivided into eight partitions<br />
36 Fluent NEWS spring 2002
computing<br />
“ In addition to its superior accuracy, ease of use and<br />
consistency, FLUENT is also absolutely amazing in its<br />
parallel processing ability. We assembled a small<br />
Linux cluster and obtained a parallel processing<br />
license. FLUENT performed flawlessly in our clustered<br />
environment the first time we tried it. Setting up<br />
and running a job in parallel is seamless to the end<br />
user, making FLUENT the ultimate return on<br />
investment in simulation tools.”<br />
– Ryan Huizenga<br />
CAD Systems Supervisor<br />
Litens Automotive Group<br />
FLUENT users have employed all of the above approaches<br />
for large jobs in need of parallel processing. Rodney<br />
Balzar from Briggs & Stratton Corporation uses a twoprocessor<br />
HP J6000, with 1024 MB of RAM shared by<br />
each processor. His simulations of turbulent flow with<br />
heat transfer typically involve more than three million<br />
cells. Jim DeSpirito at the US Army Research Laboratory<br />
(ARL) has a large computing facility at his disposal. The<br />
Major Shared Resource Center at ARL has over 1200 processors<br />
on SGI Origin 2000, Origin 3800, and IBM SP supercomputers,<br />
most of which have hundreds of gigabytes<br />
of RAM. DeSpirito’s group is one of many that use the<br />
facility, but he rarely has to wait long in the queue to<br />
launch jobs. He finds that he gets the best performance<br />
if he sets a limit of about 200,000 cells on each CPU.<br />
Thus, jobs involving five million cells typically use 28 to<br />
32 processors, while those involving 16 million cells work<br />
well with 64-96 processors. At Hamilton Sundstrand, Gary<br />
Post uses a cluster of six dual-processor Dec Alphas, running<br />
UNIX, each of which has 4 GB of memory. The<br />
machines are networked to each other, but are segregated<br />
from the rest of the corporate network. His typical<br />
runs, which include combustion and radiative heat<br />
transfer, involve from 500,000 to one million cells, are<br />
usually done using six processors on three machines. He<br />
often needs to find six available processors on more than<br />
three machines, and is grateful for the flexibility that allows<br />
him to choose either one or two from each machine.<br />
Giri Manampathy at GE Aircraft Engines usually uses a<br />
cluster of dual-processor HP workstations. The machines<br />
are linked via a high-speed network, and are segregated<br />
from all of the other computers on the company network.<br />
For problems using up to six million cells, most<br />
of which involve turbulent combustion, he typically makes<br />
use of 12 CPUs on this network. When not using the<br />
HP cluster, he can also elect to use an 8-processor shared<br />
memory PC.<br />
The PC, with Intel-based architecture, has gained popularity<br />
among Fluent software users, and indeed, among<br />
engineers and scientists running computationally intensive<br />
simulations of all types. For FLUENT users, parallel<br />
computing is available for both the <strong>Wind</strong>ows and Linux<br />
operating systems and on CPUs from both Intel and<br />
Advanced Micro Devices (AMD). At Babcock Borsig, Ken<br />
Hules uses a cluster of one- and two-processor machines<br />
using Intel and AMD hardware running <strong>Wind</strong>ows. With<br />
twelve CPUs at his disposal on a high speed network<br />
that is segregated from the corporate network, he usually<br />
runs FLUENT jobs on four to six processors at a time,<br />
using load balancing (through FLUENT’s partitioning tools)<br />
to effectively mix the range of CPU speeds in use. His<br />
problems are large, in excess of two million cells, but<br />
are primarily characterized by complex physics, including<br />
coal combustion and water sprays. Paul Chapman<br />
at Alstom Power also uses a collection of UNIX and PC<br />
workstations, but has added a Linux-based cluster for<br />
larger cases. The cluster has six dual-processor machines,<br />
with direct high-speed connections between each of the<br />
nodes. It is ideal for larger cases which can exceed two<br />
million cells, including radiation and chemical reactions<br />
associated with simulations of large scale power and process<br />
equipment. Considering the total cost of running large<br />
CFD simulations, the economics favor running on the<br />
fastest possible hardware. For this reason, they have upgraded<br />
the hardware twice in the past two years, with the<br />
latest swap to AMD processors running Linux.<br />
performance enhancements<br />
All of the FLUENT users interviewed have found impressive<br />
gains in their computing ability since switching to<br />
parallel processing. For Manampathy at GEAE, who has<br />
been using parallel processing for about a year, performance<br />
has scaled linearly as he has added compute nodes during<br />
this time. Grid independence is very important to<br />
him, so with parallel processing, he can always ensure<br />
that each solution satisfies this requirement. Balzar at<br />
Briggs & Stratton has seen a four-fold improvement after<br />
adding a second node. This exaggerated improvement<br />
is most likely due to the fact that his calculations were<br />
too large to fit inside the available RAM on his serial machine.<br />
continues on page 41 •<br />
Fluent NEWS spring 2002 37
computing<br />
Linux Clusters:<br />
Inexpensive Power for<br />
High-End CFD Computations<br />
by Jonas Larsson, Volvo Aero Corporation, Trollhättan, Sweden<br />
“We are extremely satisfied with FLUENT’s stability and<br />
performance on our new 150 CPU Linux cluster. Over the<br />
three years Volvo Aero has been using Linux clusters, Fluent<br />
has consistently met and exceeded all our expectations. By<br />
switching to running FLUENT on Linux clusters, we have been<br />
able to increase our computational resources by a factor of 10.”<br />
– Peter Emvin, Ph.D.<br />
Manager, Aero and Thermodynamics, Volvo Aero Corporation<br />
Jonas Larsson in front of the 150 CPU Linux cluster<br />
A multi-stage axial compressor simulation<br />
38 Fluent NEWS spring 2002<br />
An air-intake<br />
simulation<br />
of a Swedish<br />
fighter jet<br />
By switching to Linux clusters, the CFD<br />
group at Volvo Aero Corporation has been<br />
able to increase their computational<br />
resources by a factor of ten with a reduced hardware<br />
budget. The transition from expensive<br />
parallel UNIX machines to large Linux clusters<br />
has been a tremendous success, and has led<br />
to huge improvements both in quality and leadtime<br />
for all CFD work done.<br />
The CFD group at Volvo Aero were pioneers<br />
in using Linux clusters. They bought their first<br />
Linux cluster three years ago, and today have<br />
more than 150 CPUs in the cluster, which is<br />
used only for CFD simulations using FLUENT<br />
and their in-house CFD code, VolSol. The CFD<br />
engineers are very happy with the new computing<br />
environment. Stability and performance<br />
with FLUENT and VolSol have been markedly<br />
better than on their old UNIX servers. Because<br />
the engineers were already familiar with the<br />
UNIX environment, the migration to Linux has<br />
gone smoothly. UNIX desktop machines are<br />
still used for most pre- and post-processing work.<br />
Volvo Aero Corporation designs and manufactures<br />
components for military jet engines,<br />
commercial jet engines, and rocket engines.<br />
CFD plays an important role in all of these areas<br />
and has traditionally been a very strong discipline<br />
at Volvo Aero. Most of the work is performed<br />
at the CFD Center of Excellence, a leading<br />
engineering department that has a long history<br />
of CFD experience, and which serves all<br />
business units of Volvo Aero. Today there are<br />
twenty-four engineers; one adjunct professor,<br />
twelve PhDs, and eleven MScs. The cluster is<br />
used only by this group and has made it possible<br />
for them to run a whole new class of problems.<br />
Transient, multi-stage turbomachinery<br />
simulations with several million cells are now<br />
easily and routinely run using parallel processing<br />
on the cluster.<br />
When the cluster was first assembled the<br />
philosophy was to use as many standard, offthe-shelf<br />
components as possible. The compute<br />
nodes are normal desktop PCs and the<br />
network is normal 100Mbs, switched Ethernet.<br />
A faster network or non-standard nodes can<br />
easily double the costs. Using standard components<br />
also makes it much easier to maintain<br />
and upgrade the cluster, since most<br />
companies already have a well-established channel<br />
for buying and maintaining their desktop<br />
PCs. New nodes can easily be added as the<br />
need arises and old slow nodes can be removed<br />
and re-used as desktop office PCs.<br />
The switch to Linux clusters has also eliminated<br />
the need for a queue system. The only<br />
type of scheduling used now is a script that displays<br />
the cluster load on a web page. This allows<br />
users to select available CPUs on an as-needed<br />
basis. With today’s low cost per CPU, it makes<br />
more sense to buy new nodes as the need arises,<br />
rather than force users to wait for CPU in a<br />
queue system.<br />
With more than three years of experience<br />
running CFD on large Linux clusters, Volvo Aero<br />
Corporation has no doubt that this is the computing<br />
platform of the future. Volvo Aero has<br />
also started to replace their desktop UNIX machines<br />
with Linux machines – creating a homogenous,<br />
low-cost/high-performance computing environment<br />
that can scale to any future needs. ■
computing<br />
The Impact of the<br />
Web on the Engineering<br />
Simulation Process<br />
By Paul Bemis, Vice President, eBusiness, Fluent Inc.<br />
The internet and web technologies are<br />
continuing to revolutionize the ways<br />
in which people and organizations communicate.<br />
The engineering community is<br />
now poised to take advantage of this electronic<br />
infrastructure to increase efficiencies<br />
in product development processes.<br />
Moreover, with even greater improvements<br />
on the horizon as a result of higher bandwidth<br />
networks and high performance personal<br />
computers, the potential impact on<br />
the design and development process is significant.<br />
For engineering applications,<br />
these capabilities will provide the ability<br />
to simulate more complex systems faster<br />
and more efficiently than ever before, using<br />
“pay as you go” software on thin clients<br />
that access remote “compute servers” via<br />
the LAN, a WAN (local- and wide-area networks,<br />
respectively), or over the internet.<br />
Thin client systems use centralized servers<br />
that provide application software to users<br />
on a network, in contrast to fat client systems,<br />
where every desktop has a PC or workstation<br />
outfitted with individual installations<br />
of the software. An increasingly popular<br />
method for deployment of this method uses<br />
a Remote Simulation Facility (RSF) that specializes<br />
in providing this service to users<br />
through the internet.<br />
Using the web as a delivery mechanism<br />
for engineering solutions has significant benefits<br />
for many end users. Companies can<br />
run simulations affordably, scaling the cost<br />
of performing simulations to demand, without<br />
the conventional investment required<br />
for software and hardware. A Remote<br />
Simulation Facility arrangement readily<br />
accommodates the rise and fall of computational<br />
power needs and solution time<br />
required for peak periods and lulls<br />
between jobs. Another benefit of this model<br />
is the potential to increase the rate at which<br />
users gain access to new software versions.<br />
It is not unusual for users to wait nearly<br />
one year for new versions of application<br />
software to reach their desktop systems.<br />
Using the RSF model, new versions can be<br />
deployed more quickly without adversely<br />
affecting the desktop user. Further, older<br />
versions can be kept available for users who<br />
have not yet migrated to the newer version.<br />
Administration and support of the applications<br />
is more efficient and less disruptive,<br />
due to the central nature of this model.<br />
One of the more far-reaching benefits<br />
of a web-based RSF is that it can facilitate<br />
greater collaboration between users. This<br />
is primarily manifested through the centralized<br />
nature of the web infrastructure.<br />
Specifically, a file located on a web server<br />
appears to all users, regardless of their<br />
physical location, as the same file. This means<br />
that users will be able to interact across<br />
geographical and organizational boundaries<br />
within one company, or across the<br />
entire supply chain. An example of this type<br />
of collaboration might be between an automotive<br />
tier-one supplier and one of the big<br />
three automotive companies. The supplier<br />
will use the RSF as a mechanism to run<br />
the exact simulation sequence using<br />
methods and tools specified by the buyer.<br />
Once the simulation is complete, the results<br />
and reports become available to the buyer<br />
as files on the remote facility, eliminating<br />
the need to move data from one location<br />
to another. Thus, the RSF becomes the central<br />
point for collaboration, the repository<br />
for shared files, and serves to implement<br />
best practices throughout the simulation.<br />
Another potential area of collaboration<br />
is the Simulation Portal. Recent developments<br />
in web technologies now allow a<br />
web portal to become a location for groups<br />
of users to develop a cyber-community.<br />
For example, users interested in one particular<br />
type of simulation could create a<br />
small group that could exchange ideas via<br />
email about methods and solutions used<br />
to solve specific problems. Using the same<br />
portal, users could also create custom templates<br />
for solving application specific<br />
problem types that could be shared and<br />
distributed using access control methods.<br />
When used in combination, a web-based<br />
Remote Simulation Facility integrated<br />
within a custom Simulation Portal opens<br />
up engineering simulation and collaboration<br />
to a much larger audience of users than<br />
ever before. The implementation of this<br />
solution is generally referred to as an<br />
Application Service Provider model. At first<br />
blush, many seasoned users often dismiss<br />
the ASP model as a throw back to the times<br />
of large shared mainframes and high costs.<br />
However, with today’s reduced computing<br />
costs, and the higher bandwidth promise<br />
of the next generation internet, a fresh<br />
look at the RSF model is well worth the<br />
time. The challenge for us all is in developing<br />
streamlined engineering processes<br />
and innovative business strategies that take<br />
best advantage of the new tools for this<br />
growing body of potential users. ■<br />
Fluent NEWS spring 2002 39
support corner<br />
More and more FLUENT users are taking advantage of parallel processing<br />
to reduce turnaround time and fully utilize available hardware.<br />
Based on the client interviews in the related article on page<br />
36, it is clear that parallel processing is used today across a wide range of<br />
applications and industries. In this article, some parallel processing basics<br />
are presented along with representative performance statistics and an update<br />
on new parallel processing features in FLUENT 6.0. If you haven’t tried running<br />
in parallel yet, this information should convince you to give it a try<br />
and help get you started.<br />
Getting Started<br />
with Parallel<br />
Processing<br />
by Kirk L. Oseid, US Director of Support, Fluent Inc.<br />
hardware requirements<br />
Many hardware systems today support parallel processing, as shown in<br />
the list below. On these systems, a FLUENT calculation can be shared by<br />
two or more processors.<br />
• Multi-processor UNIX (including Linux) machines<br />
• Multi-processor <strong>Wind</strong>ows-based machines<br />
• Networks of UNIX workstations<br />
• Networks of <strong>Wind</strong>ows-based workstations<br />
Since many engineers have access to one or more of these systems,<br />
the option for parallel processing is now widely available throughout the<br />
FLUENT user base.<br />
how parallel processing speeds up the calculation<br />
In an ideal world, the time required to run a calculation on two processors<br />
should be half that required to run it on a single processor. Associated<br />
with this reduction in calculation time, however, is the addition of time required<br />
to continually communicate information between the processors as the calculation<br />
proceeds. This computational overhead contributes to the performance<br />
rating given to a multi-processor calculation. Each time the number of processors<br />
doubles, the computation time on each processor halves, but the overhead<br />
continues to increase.<br />
The ideal performance improvement for a parallel calculation is one where<br />
the performance rating increases linearly with the addition of processors.<br />
After several years of dedicated effort, FLUENT is now impressively close to<br />
this ideal for most practical configurations. The graph at left shows the actual<br />
scale-up of the performance rating for several representative hardware<br />
systems. The medium-sized benchmark problem used for this set of tests<br />
is that of a turbulent flow in a domain of approximately 250,000 cells.<br />
This and other benchmarks are described in detail on the Fluent User<br />
Services Center (www.fluentusers.com) and on the corporate web site<br />
(www.fluent.com/software/fluent/fl5bench).<br />
getting started<br />
You can run FLUENT in parallel if your current license allows for two<br />
or more FLUENT processes, and if you have two or more CPUs exclusively<br />
available to you. By following the steps outlined below, you can be up<br />
and running quickly.<br />
Performance ratings for a number of representative UNIX and Intel-based systems<br />
show linear or nearly-linear behavior<br />
1. Launch the parallel solver<br />
The parallel version of FLUENT can be launched on various platforms<br />
using commands like those shown in the table below.<br />
Platform<br />
FLUENT Launch Command<br />
Multi-processor UNIX Machine fluent 3d -t2<br />
Multi-processor <strong>Wind</strong>ows-based Machine fluent 3d -t2<br />
Network of UNIX Workstations<br />
fluent 3d -t -pnet -cnf=hostfile<br />
Network of <strong>Wind</strong>ows-based Workstations fluent 3d -t -pnet -cnf=hostfile<br />
40 Fluent NEWS spring 2002
computing<br />
In these examples the 3D version of the code is specified<br />
(3d), and two processes are started on the multi-processor<br />
machines (-t2). For the network examples, a process<br />
will be launched on each machine listed in the hostfile, up<br />
to a number specified by the -t flag. For the <strong>Wind</strong>owsbased<br />
network example, it is assumed that the RSHD communicator<br />
software (included with the FLUENT distribution)<br />
has been installed. For instructions on building the hostfile<br />
file, please refer to Chapter 28 of the FLUENT User’s Guide.<br />
2. Read the grid (or case) file and partition<br />
Partitioning is the task of segmenting your computational<br />
domain and assigning the segments to individual processors.<br />
FLUENT will automatically partition the grid or case<br />
file for you, using defaults that should be close to optimal.<br />
If the grid or case has been partitioned previously, the partitions<br />
are retained, but they can be reviewed and adjusted<br />
at any time. FLUENT provides partition quality<br />
reporting, as well as state-of-the-art partitioning tools.<br />
3. Initialize and solve<br />
Initialize and compute the solution as you would in a serial<br />
(single processor) run. The only difference you should<br />
see is faster turnaround!<br />
parallel enhancements in FLUENT 6.0<br />
Parallel processing has been available in Fluent products<br />
since the mid-1990s, with improvements highlighted in every<br />
major release. In FLUENT 6.0, this trend continues, with numerous<br />
enhancements featured in partitioning controls and flexibility.<br />
For example:<br />
• Unpartitioned grids can be imported and<br />
partitioned in the parallel solver;<br />
• Stationary non-conformal interfaces can be<br />
partitioned directly in the parallel solver;<br />
• Partitioning can be invoked automatically,<br />
following grid adaption and remeshing; and<br />
• Two types of partitioners (Geometric and Metis,<br />
developed at the University of Minnesota) are<br />
now available for use.<br />
Dynamic load balancing (automatic cell migration between<br />
partitions) has also been added to help keep your FLUENT session<br />
running optimally. Changes due to local mesh adaption,<br />
new loads added to individual processors, and variations in<br />
network performance for clusters are now managed efficiently<br />
using behind-the-scenes technology.<br />
want to learn more?<br />
Check out the User Services Center to read more about<br />
parallel processing with FLUENT. You can also refer to the User<br />
Documentation CD, where a Parallel Processing Tutorial is provided<br />
to take you through the process in a step-by-step fashion.<br />
Call your local Fluent office with any questions you may<br />
have about using this exciting option at your site. Watch out,<br />
though. As you cycle through simulations at a faster pace, you<br />
may soon find your workload increasing as your colleagues<br />
approach you with more and more problems to solve! ■<br />
Parallel Processing<br />
continued from page 37<br />
When this occurs, portions of the calculation<br />
must continually be swapped<br />
out of RAM to the disk so that other<br />
portions can be moved into RAM for<br />
active computation. Swapping, audible<br />
by the sound produced when data<br />
is written to a hard drive (often a rattling<br />
sound coming from the computer),<br />
can easily slow a calculation down by<br />
a factor of two. By adding a second<br />
processor and more memory, his calculations<br />
now easily fit into the available<br />
RAM, so his savings have been<br />
effectively quadrupled. For Post at<br />
Hamilton Sundstrand, who has been<br />
parallel processing for about two years,<br />
larger simulations with a step change<br />
in detail are now possible. For a typical<br />
combustion problem he usually<br />
needed an overnight run to compute<br />
a cold flow solution. He would then<br />
have to wait until the following day<br />
before he could ignite the flame and<br />
compute the final solution. Now, the<br />
setup and cold flow can be done in a<br />
single day, so that the flame solution<br />
can be performed that night. Whereas<br />
on a single processor machine, it might<br />
have taken two and a half days to solve<br />
a combustion problem with 200,000<br />
cells, it now takes one full day to solve<br />
one with over 500,000 cells. According<br />
to DeSpirito at ARL, whose simulations<br />
can exceed 10 or even 15 million cells,<br />
“Our problems would not be solvable<br />
without parallel processing.”<br />
Clearly, obvious benefits are realized<br />
for CFD simulations that rely solely<br />
on the solution of transport<br />
equations (species mixing and reactions,<br />
Eulerian multiphase, transient flow, etc.).<br />
The benefits are less apparent when<br />
the simulation involves particle tracking<br />
and is performed on a cluster.<br />
According to Hules at Babcock Borsig,<br />
while he achieves linear scale-up<br />
Running FIDAP and<br />
POLYFLOW in Parallel<br />
FLUENT is not the only software<br />
from Fluent that takes advantage of<br />
parallel processing. Most of the capabilities<br />
of FIDAP and POLYFLOW run<br />
in parallel on multi-processor machines.<br />
most of the time, the scale-up is reduced<br />
when he simulates coal combustion.<br />
This is because the particle tracking routines<br />
currently run at parallel speeds<br />
on shared memory machines only. (A<br />
distributed memory particle tracking<br />
model is planned for FLUENT 6.1.)<br />
Despite the current limitations, he is<br />
still pleased with the speed-up he<br />
achieves when compared to his serial<br />
runs of the past.<br />
In addition to the benefits of<br />
faster processors and algorithms for running<br />
calculations in parallel, high performance<br />
graphics cards have added<br />
the ability to visualize the results of larger<br />
models. Where the PC was previously<br />
incapable of rendering the<br />
results of large 3D simulations, the falling<br />
cost of 3D graphics hardware has<br />
allowed users to easily manipulate and<br />
animate CFD data, making post-processing<br />
an enjoyable experience.<br />
Advances in linking parallel calculations<br />
to real-time desktop post-processing<br />
will allow CFD modeling to extend far<br />
beyond its traditional boundaries in the<br />
years to come.<br />
In today’s engineering landscape,<br />
there are increased demands for<br />
higher accuracy from CFD simulations,<br />
and these are coupled with demands<br />
for more rapid turnaround times. To<br />
meet these demands, parallel processing<br />
will continue to play an ever-expanding<br />
role. Having evolved from algorithms<br />
for shared memory workstations to those<br />
for distributed memory clusters connecting<br />
single and multi-processor<br />
machines, parallel processing technology<br />
will continue to grow. Computers will<br />
continue to stun us as well, with their<br />
increased power and reduced costs.<br />
With these advances, the day will soon<br />
come when problems with tens of millions<br />
of cells will become routine. ■<br />
Many platforms are supported, and<br />
upcoming releases will continue to focus<br />
on improving the usability, performance<br />
and robustness of parallel processing.<br />
■<br />
Fluent NEWS spring 2002 41
partnerships<br />
Cooperative Research on Fuel Cells<br />
Fluent CFO Peter Christie (seated, left) and NETL’s Larry<br />
Headley (seated, right) sign the CRADA on PEMFC modeling<br />
In November 2001, Fluent entered into a<br />
Cooperative Research and Development<br />
Agreement (CRADA) with the US Department<br />
of Energy’s National Energy Technology<br />
Laboratory (NETL). This collaboration will focus<br />
on the development and validation of a<br />
FLUENT-based Polymer Eletrolyte Membrane<br />
Fuel Cell (PEMFC) model.<br />
NETL and Fluent have agreed to work together<br />
on the development of the PEMFC model,<br />
which builds on the existing capabilities of the<br />
FLUENT code to calculate fluid flow, heat and<br />
mass transfer, and chemical reactions. NETL<br />
will provide expertise in PEM fuel cell technology<br />
to assist in the implementation of submodels<br />
describing complex PEMFC physics. NETL will<br />
also work with Fluent in model validation by<br />
providing data from NETL PEMFC experiments<br />
to compare with model predictions and ensure<br />
model accuracy. The validated PEMFC code<br />
will then be made available to the public as<br />
part of the commercial Fluent software family.<br />
NETL will use the resulting model for their<br />
in-house studies of PEMFC systems. ■<br />
“The result of this CRADA between NETL<br />
and Fluent Inc. will be a fully-validated, commercial<br />
CFD model of the PEMFC, including<br />
electrochemistry, electric field, and<br />
multiphase flow of water. This FLUENT-based<br />
tool will allow PEMFC designers and manufacturers<br />
to understand the detailed<br />
operation of their PEMFC cell and stack, which<br />
is critical information for design optimization.”<br />
– Dipankar Choudhury<br />
Chief Technology Officer, Fluent Inc.<br />
FLUENT prediction of water vapor mole fraction at<br />
the anode of a PEM Fuel Cell<br />
Parameterized Model Building for Climate Control<br />
Fluent and ICEM CFD Engineering<br />
have partnered to provide an<br />
up-front design tool for performing<br />
passenger comfort studies<br />
in automobiles. This easy-to-use application-specific<br />
tool, CABIN MOD-<br />
ELER, developed by ICEM CFD<br />
Engineering, allows FLUENT users to<br />
define and mesh the interior geometry<br />
of a sedan, mini-van, or hatchback<br />
(SUV) by simply defining<br />
dimensions on a parameterized<br />
template.<br />
Through its parameterized<br />
approach, CABIN MODELER provides<br />
a quick and easy way to perform<br />
climate control studies in the<br />
absence of a CAD file. Parametric<br />
design studies varying not only compartment<br />
size, shape and angle, but<br />
also register locations, seat clearances<br />
and instrument panel details can be<br />
quickly performed throughout the<br />
design process to ensure optimized<br />
ventilation systems and identify<br />
potential design flaws long before<br />
prototypes are built or even detailed<br />
CAD data exists.<br />
CABIN MODELER creates a<br />
tetrahedral volume mesh, with<br />
optional prism layers on wall surfaces.<br />
Meshing is fully automatic, with default<br />
meshing parameters tuned to the<br />
geometry, but with the ability of the<br />
user to override defaults and exert<br />
control. The mesh is saved in native<br />
FLUENT format and can be read directly<br />
into the FLUENT solver.<br />
Beyond this, CABIN MODELER<br />
can be a valuable tool in the later stages<br />
of vehicle compartment design. As<br />
detailed CAD data becomes available,<br />
it can be used to facilitate the cleanup<br />
and meshing process by merging<br />
the actual CAD geometry (e.g.<br />
the dashboard) into the parameterized<br />
template, thus streamlining the<br />
process from CAD to analysis. ■<br />
more.info@<br />
cabinmodeler@fluent.com<br />
CABIN MODELER provides parameterized model building and automated<br />
meshing for FLUENT automotive climate control simulations<br />
42 Fluent NEWS spring 2002
partnerships<br />
Aerosol/Hydrosol<br />
Modeling in FLUENT<br />
Fluent partners at Chimera Technologies have developed a new<br />
“plug-in” model for FLUENT that addresses aerosol and hydrosol<br />
behavior. Referred to as the Fine Particle Model (FPM), the new<br />
model simulates the formation, growth, transport, and deposition of<br />
particles in systems influenced by fluid flow, heat transfer, and chemical<br />
reaction. Applications include chemical reactors, materials processing,<br />
pollutant formation and transport, nano-particle sprays, particle inhalation<br />
and transport, and other systems involving sub-micron particles<br />
in gas or liquid systems.<br />
In contrast to Fluent’s Lagrangian Discrete-Phase Model (DPM), the<br />
FPM treats particles in an Eulerian reference frame, and allows particle-particle<br />
interactions. It describes the spatial and temporal evolution<br />
of the particle size distribution accounting for nucleation and growth<br />
of particles, including effects like Brownian motion, adsorption, condensation,<br />
and coagulation. The FPM is a set of User-Defined Functions<br />
(UDFs) that work with FLUENT 6. It includes a native FLUENT GUI interface<br />
and also allows users to modify and extend the model microphysics<br />
and chemistry via their own UDFs.<br />
Release of the FPM is planned for late-2002. ■<br />
Flowmaster Group<br />
Announces FLUENTLink<br />
Flowmaster Group has developed an interface between FLUENT<br />
and FLOWMASTER ® , a leading 1D fluid flow simulation code.<br />
FLUENT users will be able to perform co-simulation analysis with<br />
the two codes, gaining the benefit of low memory use and high speed<br />
1D simulation coupled to detailed 3D analysis from FLUENT.<br />
Typical applications include automotive thermal modeling, in which<br />
a 1D FLOWMASTER simulation can be used to accurately determine<br />
flow rates, pressures and temperatures for the external circuit including<br />
components such as the water pump, hoses, radiator, and thermostat.<br />
This simulation might be coupled to a highly detailed 3D FLUENT<br />
simulation of the flow distribution in the engine cylinder block and<br />
heads.<br />
The initial release of FLUENTLink will be available for FLUENT on<br />
HP workstations under HP/UX and FLOWMASTER on PCs running <strong>Wind</strong>ows ®<br />
across a network. Later releases, due before the end of the Q2, will<br />
add further platform support for FLUENT. ■<br />
The Fine Particle Model describes the nucleation and growth of particles in<br />
aerosol and hydrosol systems, including the influence of chemical reactions, fluid<br />
flow, and heat transfer.<br />
more.info@<br />
www.aerosols.com<br />
partnerships@fluent.com<br />
more.info@<br />
www.flowmaster.com<br />
or contact Flowmaster Group<br />
at +44 1327 306000<br />
Turn-key Parallel Computing Solutions<br />
Fluent has teamed with Soho Corporation, an HP<br />
Technical Computing Channel Partner, to offer customers<br />
in North America a fully integrated and tested Linux cluster<br />
computer system for cost-effective parallel computing<br />
with FLUENT. Since its inception in 1996, Soho has<br />
been dedicated to the support and implementation of<br />
infrastructure requirements for technical computing applications.<br />
Recently, Soho has worked with Fluent to fully<br />
understand the unique requirements of running FLUENT<br />
on a Linux cluster. They assemble the cluster at their facility,<br />
and fully configure it for running FLUENT, in a process<br />
that includes installation of the operating system, cluster-enhancing<br />
applications, drivers, and utilities, and validation<br />
using FLUENT benchmarks. The complete<br />
system is then installed at the customer’s site, where the<br />
FLUENT benchmarks are run a second time. Following<br />
the installation, Soho serves as the single point of contact<br />
for cluster infrastructure support management. ■<br />
more.info@<br />
fluent@sohocorporation.com<br />
Fluent NEWS spring 2002 43
around Fluent<br />
Fluent Attends Launch of<br />
Ferrari Formula 1 Race Car<br />
Fluent Worldwide<br />
Fluent Inc.<br />
10 Cavendish Court<br />
Lebanon, NH 03766, USA<br />
Tel: 603 643 2600<br />
email: info@fluent.com<br />
US regional offices<br />
Evanston, IL 60201<br />
Tel: 847 491 0200<br />
Ann Arbor, MI 48104<br />
Tel: 734 213 6821<br />
Santa Clara, CA 95051<br />
Tel: 408 522 8726<br />
Morgantown, WV 26505<br />
Tel: 304 598 3770<br />
Fluent Europe Ltd.<br />
Sheffield Airport Business Park<br />
Europa Link<br />
Sheffield, S9 1XU, England<br />
Tel: 44 114 281 8888<br />
email: info@fluent.co.uk<br />
The Maranello, Italy-based Ferrari Formula 1 Team<br />
recently unveiled their eagerly awaited 2002 race<br />
car to a crowd of 1000 specially invited guests,<br />
including 500 motor racing journalists from the print<br />
and televised media around the world. Ferrari’s new<br />
car launch was a predictably glitzy show, to match<br />
the confidence of the World Champions for the last<br />
two years. Gerard De Neuville, Fluent’s Vice President<br />
and Manager of Fluent France, was invited to the launch<br />
as a Technical Partner of the Ferrari Formula 1 Team.<br />
academic news<br />
Italian University Researcher<br />
Wins Prestigious Award<br />
Dr. Francesco Migliavacca<br />
44 Fluent NEWS spring 2002<br />
He was accompanied by Martine De Neuville,<br />
Fluent’s Communications Director for South Europe,<br />
and Marco Rossi, the Manager of Fluent Italia. In the<br />
picture they are seen beside Luca di Montezemelo,<br />
President of Ferrari, and the all-new 2002 race car that<br />
will be driven again this year by Michael Schumacher,<br />
the world champion driver from Germany. After working<br />
closely with Scuderia Ferrari for several years, it<br />
was a proud moment, and another motor racing first,<br />
for Fluent. ■<br />
November 16, 2001 was an important day for LaBS, the Laboratory<br />
of Biological Structure Mechanics of Politecnico di Milano in<br />
Milan, Italy. Dr. Francesco Migliavacca, a member of the LaBS<br />
staff, was awarded Le Scienze Medal for his outstanding accomplishments<br />
in the study of the haemodynamics after paediatric cardiac surgery.<br />
His work consists of mathematical modeling using FIDAP and FLUENT<br />
software. At the same time Dr. Migliavacca was also awarded a Medal<br />
from Mr. Ciampi, President of the Italian Republic.<br />
Le Scienze is the Italian edition of the journal Scientific American.<br />
Le Scienze Medal was established in 2000 and is presented to three young<br />
researchers, working in Italy, whose results have been internationally<br />
acknowledged, in recognition of distinguished contributions to the different<br />
fields of science. This year the conferral ceremony took place at<br />
the Università degli Studi, Milan, and the Awards were presented to<br />
Dr. Migliavacca (for engineering), Dr. Roberto Bini (for chemistry) and<br />
Dr. Elena Cattaneo (for medicine) by Prof. Enrico Decleva and Prof. Paolo<br />
Mantegazza, Rector and Rector Emeritus of the Università degli Studi,<br />
respectively. ■<br />
European regional offices<br />
Fluent Benelux<br />
Wavre, Belgium<br />
Tel: 32 1045 2861<br />
Fluent Deutschland GmbH<br />
Darmstadt, Germany<br />
Tel: 49 6151 36440<br />
Fluent France SA<br />
Montigny le Bretonneux, France<br />
Tel: 33 1 3060 9897<br />
Fluent Italia<br />
Milano, Italy<br />
Tel: 39 02 8901 3378<br />
Fluent Sweden AB<br />
Göteborg, Sweden<br />
Tel: 46 31 771 8780<br />
Fluent Asia Pacific Co., Ltd.<br />
Shinjuku Center Building 50F<br />
1-25-1, Nishishinjuku, Shinjuku-ku<br />
Tokyo 163-0650, Japan<br />
Tel: 81 3 5324 7301<br />
Osaka, Japan<br />
Tel: 81 6 6445 5690<br />
Fluent India<br />
Pune, India<br />
Tel: 91 20 6119424<br />
distributors<br />
ATES - Korea<br />
Beijing Hi-key Technology Corporation<br />
Ltd. - China<br />
Figes Ltd. - Turkey<br />
Fluid Codes Ltd. - U.K. (serving the Middle East)<br />
Hungarian Combustion Ltd. - Hungary<br />
J-ROM Ltd. - Israel<br />
LEAP Australia Pty., Ltd.<br />
Australia & New Zealand<br />
Process Flow - Finland<br />
RCCM - Japan (FIDAP & POLYFLOW only)<br />
Scientific Formosa, Inc. - Taiwan<br />
(not an Icepak distributor)<br />
SimTec Ltd. - Greece<br />
SMARTtech Services and Systems, Ltd.<br />
Brazil<br />
SymKom - Poland<br />
Taiwan Auto-Design Company (TADC)<br />
Taiwan (Icepak only)<br />
Techsoft Engineering s.r.o<br />
Czech Republic<br />
Thermal Technologies - South Africa<br />
more.info@<br />
Visit www.fluent.com<br />
for specific contact information