Healthy Outlook - Sydney Local Health District - NSW Government
Healthy Outlook - Sydney Local Health District - NSW Government
Healthy Outlook - Sydney Local Health District - NSW Government

Create successful ePaper yourself
Turn your PDF publications into a flip-book with our unique Google optimized e-Paper software.
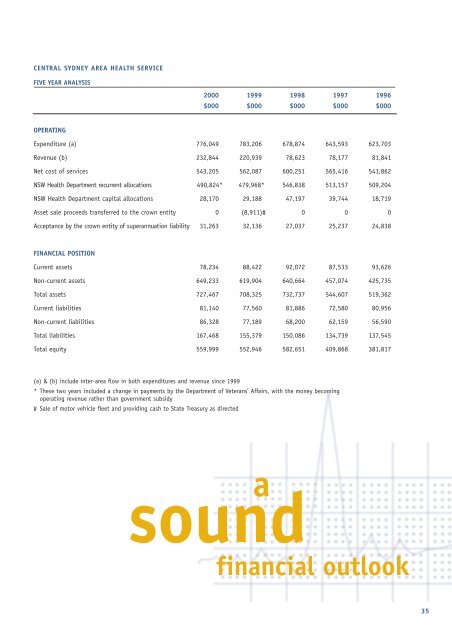
CENTRAL SYDNEY AREA HEALTH SERVICE<br />
FIVE YEAR ANALYSIS<br />
2000 1999 1998 1997 1996<br />
$000 $000 $000 $000 $000<br />
OPERATING<br />
Expenditure (a) 776,049 783,206 678,874 643,593 623,703<br />
Revenue (b) 232,844 220,939 78,623 78,177 81,841<br />
Net cost of services 543,205 562,087 600,251 565,416 541,862<br />
<strong>NSW</strong> <strong>Health</strong> Department recurrent allocations 490,824* 479,968* 546,838 513,157 509,204<br />
<strong>NSW</strong> <strong>Health</strong> Department capital allocations 28,170 29,188 47,197 39,744 18,719<br />
Asset sale proceeds transferred to the crown entity 0 (8,911)# 0 0 0<br />
Acceptance by the crown entity of superannuation liability 31,263 32,136 27,037 25,237 24,838<br />
FINANCIAL POSITION<br />
Current assets 78,234 88,422 92,072 87,533 93,626<br />
Non-current assets 649,233 619,904 640,664 457,074 425,735<br />
Total assets 727,467 708,325 732,737 544,607 519,362<br />
Current liabilities 81,140 77,560 81,886 72,580 80,956<br />
Non-current liabilities 86,328 77,189 68,200 62,159 56,590<br />
Total liabilities 167,468 155,379 150,086 134,739 137,545<br />
Total equity 559,999 552,946 582,651 409,868 381,817<br />
(a) & (b) include inter-area flow in both expenditures and revenue since 1999<br />
* These two years included a change in payments by the Department of Veterans’ Affairs, with the money becoming<br />
operating revenue rather than government subsidy<br />
# Sale of motor vehicle fleet and providing cash to State Treasury as directed<br />
a<br />
sound<br />
financial outlook<br />
35