Indigo Shire - renewable energy mapping - Indigo Shire Council
Indigo Shire - renewable energy mapping - Indigo Shire Council
Indigo Shire - renewable energy mapping - Indigo Shire Council
Create successful ePaper yourself
Turn your PDF publications into a flip-book with our unique Google optimized e-Paper software.
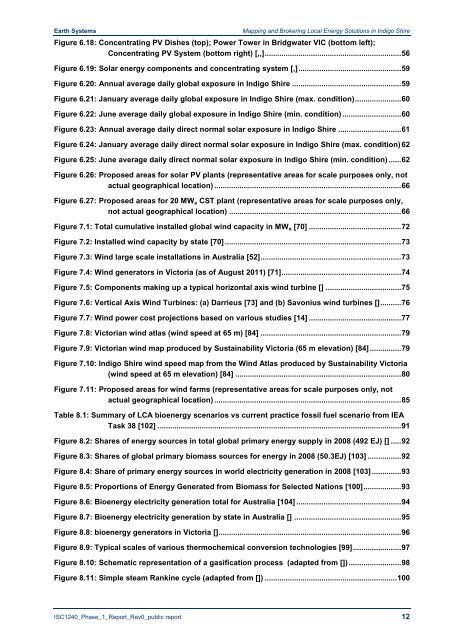
Earth Systems<br />
Mapping and Brokering Local Energy Solutions in <strong>Indigo</strong> <strong>Shire</strong><br />
Figure 6.18: Concentrating PV Dishes (top); Power Tower in Bridgwater VIC (bottom left);<br />
Concentrating PV System (bottom right) [,,] ................................................................. 56<br />
Figure 6.19: Solar <strong>energy</strong> components and concentrating system [,] ................................................. 59<br />
Figure 6.20: Annual average daily global exposure in <strong>Indigo</strong> <strong>Shire</strong> .................................................... 59<br />
Figure 6.21: January average daily global exposure in <strong>Indigo</strong> <strong>Shire</strong> (max. condition) ...................... 60<br />
Figure 6.22: June average daily global exposure in <strong>Indigo</strong> <strong>Shire</strong> (min. condition) ............................ 60<br />
Figure 6.23: Annual average daily direct normal solar exposure in <strong>Indigo</strong> <strong>Shire</strong> .............................. 61<br />
Figure 6.24: January average daily direct normal solar exposure in <strong>Indigo</strong> <strong>Shire</strong> (max. condition) 62<br />
Figure 6.25: June average daily direct normal solar exposure in <strong>Indigo</strong> <strong>Shire</strong> (min. condition) ...... 62<br />
Figure 6.26: Proposed areas for solar PV plants (representative areas for scale purposes only, not<br />
actual geographical location) ......................................................................................... 66<br />
Figure 6.27: Proposed areas for 20 MW e CST plant (representative areas for scale purposes only,<br />
not actual geographical location) .................................................................................. 66<br />
Figure 7.1: Total cumulative installed global wind capacity in MW e [70] ............................................ 72<br />
Figure 7.2: Installed wind capacity by state [70] .................................................................................... 73<br />
Figure 7.3: Wind large scale installations in Australia [52] ................................................................... 73<br />
Figure 7.4: Wind generators in Victoria (as of August 2011) [71]......................................................... 74<br />
Figure 7.5: Components making up a typical horizontal axis wind turbine [] .................................... 75<br />
Figure 7.6: Vertical Axis Wind Turbines: (a) Darrieus [73] and (b) Savonius wind turbines [] .......... 76<br />
Figure 7.7: Wind power cost projections based on various studies [14] ............................................ 77<br />
Figure 7.8: Victorian wind atlas (wind speed at 65 m) [84] ................................................................... 79<br />
Figure 7.9: Victorian wind map produced by Sustainability Victoria (65 m elevation) [84] ............... 79<br />
Figure 7.10: <strong>Indigo</strong> <strong>Shire</strong> wind speed map from the Wind Atlas produced by Sustainability Victoria<br />
(wind speed at 65 m elevation) [84] ............................................................................... 80<br />
Figure 7.11: Proposed areas for wind farms (representative areas for scale purposes only, not<br />
actual geographical location) ......................................................................................... 85<br />
Table 8.1: Summary of LCA bio<strong>energy</strong> scenarios vs current practice fossil fuel scenario from IEA<br />
Task 38 [102] .................................................................................................................... 91<br />
Figure 8.2: Shares of <strong>energy</strong> sources in total global primary <strong>energy</strong> supply in 2008 (492 EJ) [] ..... 92<br />
Figure 8.3: Shares of global primary biomass sources for <strong>energy</strong> in 2008 (50.3EJ) [103] ................ 92<br />
Figure 8.4: Share of primary <strong>energy</strong> sources in world electricity generation in 2008 [103] .............. 93<br />
Figure 8.5: Proportions of Energy Generated from Biomass for Selected Nations [100] .................. 93<br />
Figure 8.6: Bio<strong>energy</strong> electricity generation total for Australia [104] .................................................. 94<br />
Figure 8.7: Bio<strong>energy</strong> electricity generation by state in Australia [] ................................................... 95<br />
Figure 8.8: bio<strong>energy</strong> generators in Victoria []....................................................................................... 96<br />
Figure 8.9: Typical scales of various thermochemical conversion technologies [99] ....................... 97<br />
Figure 8.10: Schematic representation of a gasification process (adapted from []) ......................... 98<br />
Figure 8.11: Simple steam Rankine cycle (adapted from []) ............................................................... 100<br />
ISC1240_Phase_1_Report_Rev0_public report 12


